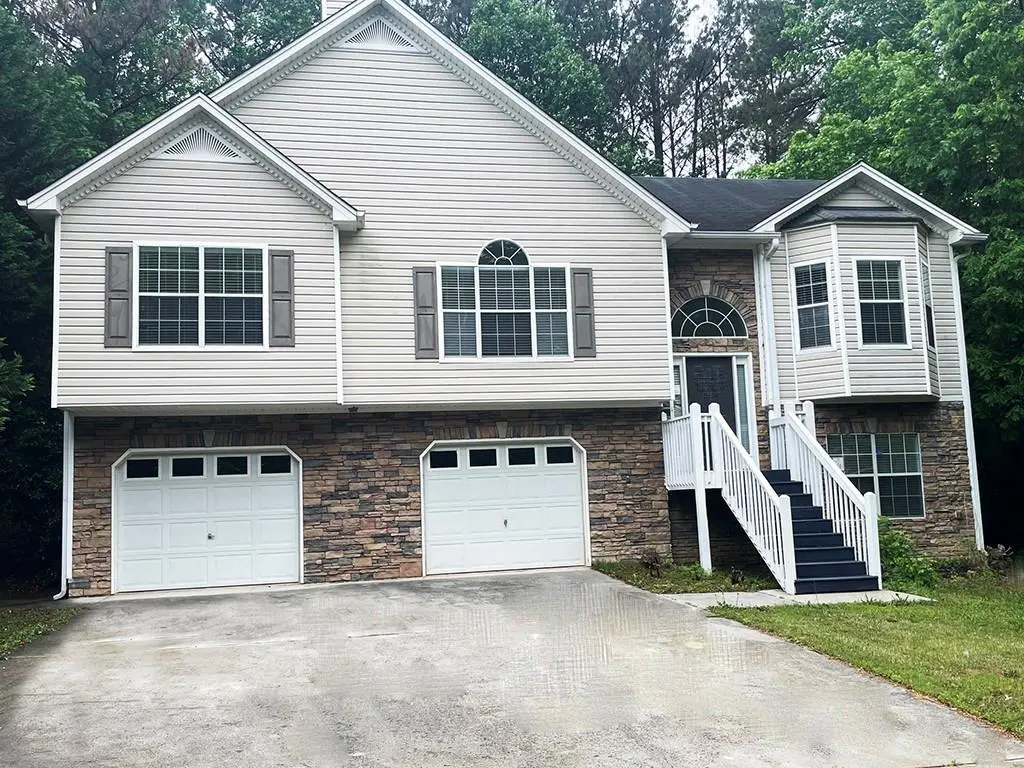
95 Luke Dr · Cartersville, GA
Flood risk 1/10 · Minimal
- FEMA flood zone
- X (unshaded)
- Chance of flooding over 30 yrs
- 0.0%
- Est. flood insurance / yr
- $473 – $860
Fire risk 5/10 · Moderate
- Est. fire insurance / yr
- $963 – $1,789
Heat risk 5/10 · Moderate
- Hot days now (above 104°F)
- 7 days/yr
- Hot days in 30 yrs
- 18 days/yr
Wind risk 4/10 · Minor
- Chance of severe wind over 30 yrs
- 19.0%
Air-quality risk 4/10 · Minor
- Unhealthy air days now
- 4 days/yr
- Unhealthy air days in 30 yrs
- 5 days/yr
Risk factors via First Street. Map © Google.
Why this score? — see what drove the D grade
The composite is a weighted blend of 9 inputs, each scored 0–100. Each bar is that input's sub-score; the figure is the points it added to the 100-point composite (weight × sub-score).
- Cash flow +12.7/30.0
- ARV discount +9.8/15.0
- DSCR +3.8/10.0
- Livability +3.7/5.0
- Schools +3.6/10.0
- 1% rule +3.1/10.0
- Rent growth +3.0/5.0
- Condition / age +2.5/5.0
- Appreciation +0.0/10.0
$286,000
🖨 Deal sheet (PDF) 📄 Offer letter ✓ Due diligence
Listing remarks
LOCATION! This 3 bedrooms, 2 bathrooms plus a bedroom and bathroom in the basement is a split-foyer style home located in a quiet cul-de-sac in Dallas, Georgia! Don't miss this opportunity!
Key facts
- 0.61 acre lot
- 2 garage spots
- Built 2003
Property features AI
Finance
- Other: Roads are paved asphalt on a county road; GPS friendly directions
- HOA & community: Association fees collected annually
Exterior
- Parking: Drive-under main level garage that faces the front; Two garage spaces; Two total parking spaces; Garage with automatic door opener
- Utilities: Public water; Public sewer; Electric service with 110V and 220V (220V in laundry); Cable available; Natural gas available; Phone available; Underground utilities
- Home design: One-and-a-half story home; Resale property; Concrete perimeter foundation
- Construction: Frame construction with vinyl siding; Composition shingle roof
- Exterior features: Rain gutters; Covered deck/patio; Back yard fenced with chain link fencing; Finished walk-out basement with driveway access and interior entry
Interior
- Kitchen: Laminate countertops; Stained cabinets; Pantry; Dishwasher
- Bedrooms: Master bedroom on the main level; Three main-level bedrooms; One lower-level bedroom
- Flooring: Carpet; Vinyl; Wood
- Bathrooms: Three full bathrooms; Two full bathrooms on the main level; One full bathroom on the lower level; Master bathroom with double vanity
- Heating & cooling: Central heating (forced air); Central air conditioning; Electric cooling; Ceiling fans
- Interior features: Bookcases; Crown molding; Disappearing attic stairs; Entrance foyer with two-story height; Tray ceilings; Vaulted ceilings; Walk-in closets; Shutters on windows; One gas-log fireplace in the family room
- Laundry & utility: Laundry in basement with electric dryer hookup; Laundry closet; Basement interior entry
Neighborhood map
What this means for you Summary
Snapshot
- This is a 4-bed/3.0-bath single-family listed at $286k.
Deal economics
- At list price, monthly cash flow is $-31 ($-375/yr) — negative.
- To cash-flow at today's rent, offer at most $280k (1.9% below list).
- To meet the 1% rule (rent ≥ 1% of price), the offer needs to be $233k (18.5% below list).
- Recommended offer: $233k (18.5% below list) — sets the bar for 1% rule.
- Cap rate 6.2% vs local median 3.7% in Cartersville — top-decile yield for the area; either an underpriced asset or a hidden risk that comps aren't pricing in. Stress-test before assuming the spread holds.
Location & tenants
- Location reads 74/100 on livability (#43 in GA, #4,800 nationally) — a middle-class / working-renter tenant base. Strengths: housing A+, health & safety A+, amenities A; Watch: commute F.
- Paulding County (suburban): math 39% / reading 42% proficiency, ranked #33 of 174 in GA (top 19%) — families likely to look elsewhere, expect single-tenant / working-renter base with shorter leases.
- Zoned schools: Burnt Hickory Elementary School (math 69% / reading 54%, grade B, #114 of 1,228 statewide, top 9%, 1,044 students, 18% FRL); Sammy Mcclure Sr. Middle School (math 59% / reading 63%, grade B+, #36 of 470 statewide, top 8%, 1,536 students, 17% FRL); North Paulding High School (math 12% / reading 37%, grade F, #184 of 424 statewide, top 48%, 2,986 students, 21% FRL).
- Market conditions: Rents rising (+1.8%/yr); 652 active listings in the ZIP; 4 comparable units currently listed for rent nearby; rentals lingering (median 45d on market — plan ~5-8 weeks vacancy on turnover, expect pricing pressure); 75% of comp listings sitting > 30 days — soft ceiling on asking rent; solid renter incomes; 1,458 units permitted in Paulding County in 2024 (0 in 5+ unit buildings).
Forward outlook
- Local home prices are declining (-3.0%/yr); year-one equity from $2k of loan paydown is wiped out by about $9k of value loss. Plan a longer hold.
- Paulding County population projected at +24% by 2050 — long-run rental-demand tailwind backs the buy-and-hold thesis.
Negotiation context
- It's been on market 29 days — a 2% lower offer ($282k) is reasonable based on typical stale-listing flexibility.
- 6 sale attempts since 4y ago with the ask held roughly flat each time — persistent listings suggest the price (not the market) is what's stuck; bring a comps-based counter.
Risks & watch-outs
- Climate carrying-cost: moderate wildfire risk; extreme-heat days projected 7→18/yr by 2055 (HVAC capex compounding) — expect insurance premiums to compound above CPI over the hold.
Questions for the listing agent
- What do current leases actually rent for vs. the listed asking? Can we see a recent rent roll and the last 12 months of T-12 income?
- Is there a deadline driving the sale (1031 exchange, divorce, estate, relocation)? That informs how much negotiation room exists.
- Schools are D-rated, which usually means shorter tenancies and higher turnover. Who's the typical renter profile here, and what's been the actual vacancy rate?
- The area grade is low — what's the realistic commute time and amenity access for the typical tenant pool here? Any planned neighborhood developments (good or bad) we should know about?
- What's the average days-on-market for RENTAL listings here right now (not sales)? A rising rental-DOM trend means longer vacancies and softer asking-rent achievability than the comps imply.
- What's the recent tenant-quality profile in this submarket — average credit score on applications, eviction rate, late-payment / NSF rate, and stable-employment percentage? A property-management company in the area should have these aggregated.
- How much new for-sale + rental construction is in the pipeline within 1–3 miles? Heavy new supply typically softens prices + rents 12–24 months out; constrained supply supports both.
Investment metrics
- 1% rule
- 0.81% ✗
- Cap rate
- 6.16%
- Cash-on-cash
- -0.47%
- DSCR
- 0.98
- GRM
- 10.2
CMA / ARV
- ARV (on-the-fly)
- $301,600
- Comps found
- 5
Show comp detail 5 sales within ~0.75 mi
| Address | Dist | Beds/Ba | Sqft | Sold | Price | $/sf | Match |
|---|---|---|---|---|---|---|---|
| 68 Leann Trce | 0.14mi | 4/2.5 | 2,114 (+12%) | 1mo | $339,000 | $160 | 70 |
| 184 Pioneer Trl | 0.68mi | 4/3.0 | 2,142 (+14%) | 3mo | $352,000 | $164 | 43 |
| 68 Williams Rd | 0.65mi | 3/2.0 (-1) | 1,602 (-15%) | 4mo | $300,000 | $187 | 32 |
| 342 Williams Rd | 0.70mi | 4/2.0 | 2,045 (+8%) | 24mo | $325,000 | $159 | 29 |
| 9571 Cartersville Hwy | 0.71mi | 3/2.0 (-1) | 1,678 (-11%) | 18mo | $265,000 | $158 | 25 |
Match score weights: distance 35% · size 25% · config 20% · recency 20%. Top-matched comps best support the ARV.
Projected returns pro-forma
-3.0% appreciation · 1.84% rent growth · sell at horizon
- IRR
- -18.3%
- Equity multiple
- 0.36×
- Total profit
- $-51,055
- Equity at exit
- $42,644
- IRR
- -13.0%
- Equity multiple
- 0.28×
- Total profit
- $-57,921
- Equity at exit
- $24,728
Cash invested: $80,080 (down + closing). Projections, not guarantees.
Landlord ↔ Tenant lean methodology
- Overall (STATE)
- 90 Strongly Landlord-Friendly
- State Georgia
- 90 Strongly Landlord-Friendly · R+3
- County
- — inherits STATE
- City
- — inherits STATE
ZIP-level market 30132
- Home prices YoY
- -33.1%
- Rents YoY
- 1.8%
- Active inventory
- 652
- Price-to-rent
- 10.2×
Monthly cashflow live
- Estimated rent
- $2,331 medium interval (Pro) →
- Mortgage (P&I)
- −$1,500
- Tax from tax record
- −$254 /mo · $3,043/yr
- Insurance
- −$119
- HOA
- −$0
- Vacancy / Maint / Mgmt
- −$489
- Net cashflow
- $-31
Break-even live
Sensitivity live
| Price | -10% $131 | -5% $50 | +0% $-31 | +5% $-112 | +10% $-193 |
|---|---|---|---|---|---|
| Rent | -10% $-215 | -5% $-123 | +0% $-31 | +5% $61 | +10% $153 |
| Rate | -1.0pp $113 | -0.5pp $41 | base $-31 | +0.5pp $-105 | +1.0pp $-181 |
UW: 25.0% down · 7.5% · 30yr · 1.5% tax · 5.0% vac · 8.0% maint · 8.0% mgmt
Financing live
Cash to close
- Down payment
- $71,500
- Closing costs
- $8,580
- Reserves months
- —
- Total cash needed
- —
Loan-product check · same deal, 3 products live
Conventional
25% down · 7.5% · 30yr
- Down + closing
- —
- Monthly P&I
- —
- Monthly cashflow
- —
- DSCR
- —
- Eligible?
- —
Personal DTI + credit; lowest rate.
DSCR
20% down · 8.5% · 30yr
- Down + closing
- —
- Monthly P&I
- —
- Monthly cashflow
- —
- DSCR
- —
- Eligible?
- —
No personal income docs; deal must DSCR.
Hard money
10% down · 12.0% · 12mo
- Down + closing
- —
- Monthly P&I
- —
- Monthly cashflow
- —
- DSCR
- —
- Eligible?
- —
Short-term bridge; refi at stabilization.
Rent comps 4 comps
| Address | Beds | Baths | Sqft | Rent | $/sqft | DOM | Units | Dist |
|---|---|---|---|---|---|---|---|---|
| 15 Gregory Ln Dallas, GA | 3.0 | 2.0 | 1328 | $1,729 | $1.30 | 44d | 1 | 0.73mi |
| 28 Mindy Ct Dallas, GA | 4.0 | 2.0 | 1924 | $1,860 | $0.97 | 6d | 1 | 0.87mi |
| 50 Darden Ct Dallas, GA | 4.0 | 3.5 | 2184 | $2,126 | $0.97 | 44d | 1 | 0.98mi |
| 595 School Rd Dallas, GA | 3.0 | 2.0 | 1700 | $2,051 | $1.21 | 44d | 1 | 1.10mi |
Listing history 43 events
-
2026-06-18days on market $286,000 Active 29 DOM
-
2026-06-17days on market $286,000 Active 28 DOM
-
2026-06-16days on market $286,000 Active 27 DOM
-
2026-06-15days on market $286,000 Active 26 DOM
-
2026-06-13days on market $286,000 Active 24 DOM
-
2026-06-13days on market $286,000 Active 23 DOM
-
2026-06-09days on market $286,000 Active 20 DOM
-
2026-06-08days on market $286,000 Active 19 DOM
-
2026-06-07days on market $286,000 Active 18 DOM
-
2026-06-04days on market $286,000 Active 15 DOM
-
2026-06-03days on market $286,000 Active 14 DOM
-
2026-06-02days on market $286,000 Active 13 DOM
-
2026-06-02status $286,000 Active 12 DOM
-
2026-06-01days on market $286,000 Active Under Contract 12 DOM
-
2026-05-31days on market $286,000 Active Under Contract 11 DOM
-
2026-05-21status Active
-
2026-05-18$286,000 Active
-
2026-04-08historical
-
2026-04-08historical
-
2026-03-08price $316,000
-
2026-03-08price $316,000
-
2026-03-03price $321,000
-
2026-03-03price $321,000
-
2026-02-04price $331,000
-
2026-02-04price $331,000
-
2026-01-23price $341,000
-
2026-01-23price $341,000
-
2026-01-15$349,000 New
-
2026-01-15$349,000 Active
-
2023-02-14soldstatus $300,000
-
2023-02-07soldstatus $300,000 Sold
-
2023-02-07soldstatus $300,000 Closed
-
2023-01-13status Pending
-
2023-01-13status Under Contract
-
2023-01-12price $307,000
-
2023-01-12price $307,000
-
2022-11-03price $316,000
-
2022-11-03price $316,000
-
2022-10-24$320,000 New
-
2022-10-24$320,000 Active
-
2022-10-12soldstatus $269,300
-
2019-04-23soldstatus $166,000
-
2002-09-18soldstatus $32,000
ⓘ Source: listings_history table (triggers on properties + properties_extension) + one-shot
backfill from property_details.listing_events for pre-trigger history.
Tax reassessment forecast GA · Resets to sale price
- Current annual tax
- $3,043 · $254/mo
- Projected year-2 tax
- $3,043 · $254/mo
- Expected delta
- $0/yr ($0/mo · 0.0%)
ⓘ Screening estimate from a state-policy table — verify with the county assessor before closing.
Climate risk First Street
- Flood 1/10 Low FEMA zone X (unshaded) · 0% chance over 30 yrs
- Wildfire 5/10 Major
- Heat 5/10 Major 7 d/yr ≥104°F today · 18 d/yr by 30 yrs out
- Wind 4/10 Moderate 19% chance of damaging wind over 30 yrs
- Air quality 4/10 Moderate 4 unhealthy d/yr today · 5 by 30 yrs out
Nearby sold comps map
Loading sold comps map…
Walkable amenities ~0.75 mi
Loading nearby amenities…
Taxation est. · year 1
- Rental income
- $27,969
- − Mortgage interest
- −$16,020
- − Property taxes
- −$3,043
- − Insurance
- −$1,430
- − Repairs & maintenance
- −$2,237
- − Management
- −$2,237
- − Depreciation
- −$8,320
- Taxable loss
- −$5,320
- Est. tax savings @ 24.0%
- +$1,277
- After-tax cash flow
- $901/yr
For passive investors: Depreciation is non-cash, so a rental often shows a tax loss while cash-flowing — sheltering income. Rental losses are passive: they offset passive income freely, and up to $25,000/yr can offset ordinary (W-2) income if you actively participate and your MAGI is under $100k (phasing out to $0 by $150k); unused losses carry forward. On sale, claimed depreciation is recaptured at up to 25%, and gains may owe capital-gains tax (a 1031 exchange can defer both). Figures are a year-1 estimate at your 24.0% rate — not tax advice; consult a CPA.
Schools (NCES district)
- District
- Paulding County
- NCES district ID
- 1304020
- Math proficiency
- 39% ▼ -6.00%
- Reading proficiency
- 42% ▼ -7.00%
- Median HH income
- $61,447
- Composite
- 36.0/100
- National rank
- #4784
- State rank
- #33 of 174 in GA
Livability — Cartersville
- Score
- 74/100
- State rank
- #43
- US rank
- #4800
Category grades
Schools grade is shown separately in the Schools card above.
Census & demographics
- County
- Paulding County · 134,013 people
- City population
- 106,793
- Metro
- Atlanta-Sandy Springs-Alpharetta, GA
- Population (ZIP)
- 53,348
- Household income
- $109,914
- Rent vs Own
- Severe rent burden
- 593.0
Population outlook (Paulding County) Hauer SSP2
- Today (2025)
- 175,714 people
- By 2030
- 186,082 · +5.9%
- By 2040
- 204,414 · +16.3%
- By 2050
- 217,040 · +23.5%
- By 2075
- 236,980 · +34.9%
- By 2100
- 238,314 · +35.6%
Race, ethnicity, and origin ACS 2023
- Neighborhood character
- Majority White (64%)
- Race & ethnicity
- White 64% Black 19% Hispanic / Latino 9% Two or more races 8% Asian 2%
- Hispanic origin (detail)
- Mexican 3% Puerto Rican 2%
- Common ancestry
- Slovak 2% Romanian 2% Lithuanian 2%
- Foreign-born
- 8% · Canada, China
- Languages at home
- 91% English-only · Spanish 5% Other Indo-European 1% Tagalog/Filipino 1%
Political lean MEDSL · Paulding
- 2024 margin
- Strong R (+24.1) · D 37.6% · R 61.7%
- 2008→2024 swing
- +14.4pp toward D · 2008: -38.5pp · 2024: -24.1pp
- All cycles
- 2024: R+24.1 2020: R+29.1 2016: R+41.2 2012: R+43.6 2008: R+38.5
Not yet ingested
- Civics
- —
Market trends
- HPI YoY
- ▼ -92.85%
- Current HPI
- 187.6553
- Rent YoY
- ▲ 1.84%
- Metro
- Atlanta-Sandy Springs-Alpharetta, GA
- State GDP YoY
- ▲ 2.66%
- F500 in state
- 28
Industry mix (Fortune 500 HQ in GA)
| Industry | F500 HQs | Revenue |
|---|---|---|
| Paper / Packaging | 2 | $29B |
|
||
| Retail | 1 | $160B |
|
||
| Transportation / Logistics | 1 | $91B |
|
||
| Airlines | 1 | $62B |
|
||
| Consumer Goods | 1 | $47B |
|
||
| Utilities | 1 | $25B |
|
||
Price history
+793.8% since first listed28 events — show timeline
- 2026-05-21 Relisted — FMLS
- 2026-05-18 Listed $286,000 FMLS
- 2026-04-08 Listing Removed — FMLS
- 2026-04-08 Listing Removed — GAMLS
- 2026-03-08 Price Changed $316,000 FMLS
- 2026-03-08 Price Changed $316,000 GAMLS
- 2026-03-03 Price Changed $321,000 FMLS
- 2026-03-03 Price Changed $321,000 GAMLS
- 2026-02-04 Price Changed $331,000 FMLS
- 2026-02-04 Price Changed $331,000 GAMLS
- 2026-01-23 Price Changed $341,000 FMLS
- 2026-01-23 Price Changed $341,000 GAMLS
- 2026-01-15 Listed $349,000 FMLS
- 2026-01-15 Listed $349,000 GAMLS
- 2023-02-14 Sold (Public Records) $300,000 Public Records
- 2023-02-07 Sold (MLS) $300,000 FMLS
- 2023-02-07 Sold (MLS) $300,000 GAMLS
- 2023-01-13 Pending — FMLS
- 2023-01-13 Pending — GAMLS
- 2023-01-12 Price Changed $307,000 GAMLS
- 2023-01-12 Price Changed $307,000 FMLS
- 2022-11-03 Price Changed $316,000 GAMLS
- 2022-11-03 Price Changed $316,000 FMLS
- 2022-10-24 Listed $320,000 FMLS
- 2022-10-24 Listed $320,000 GAMLS
- 2022-10-12 Sold (Public Records) $269,300 Public Records
- 2019-04-23 Sold (Public Records) $166,000 Public Records
- 2002-09-18 Sold (Public Records) $32,000 Public Records
Property tax history
+3.5%/yrLatest (2025): $3,043 · +5.8% YoY. Source: county tax records.
Cash-flow waterfall
monthlySold comps — $/sqft
last 12 mo · ≤1 miLoading sold comps…