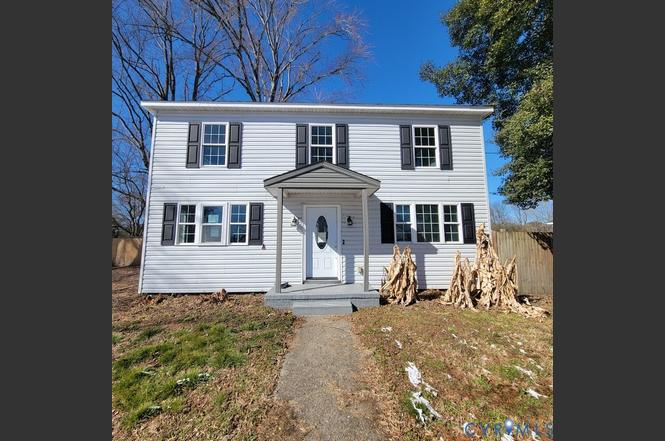
3411 Trenton St · Hopewell, VA
Flood risk 1/10 · Minimal
- FEMA flood zone
- X (unshaded)
- Chance of flooding over 30 yrs
- 0.0%
- Est. flood insurance / yr
- $507 – $1,088
Fire risk 1/10 · Minimal
- Est. fire insurance / yr
- $666 – $1,236
Heat risk 8/10 · Major
- Hot days now (above 108°F)
- 7 days/yr
- Hot days in 30 yrs
- 16 days/yr
Wind risk 6/10 · Moderate
- Chance of severe wind over 30 yrs
- 51.0%
Air-quality risk 2/10 · Minimal
- Unhealthy air days now
- 1 days/yr
- Unhealthy air days in 30 yrs
- 2 days/yr
Risk factors via First Street. Map © Google.
Why this score? — see what drove the C+ grade
The composite is a weighted blend of 9 inputs, each scored 0–100. Each bar is that input's sub-score; the figure is the points it added to the 100-point composite (weight × sub-score).
- Cash flow +21.2/30.0
- ARV discount +15.0/15.0
- DSCR +6.8/10.0
- 1% rule +5.5/10.0
- Rent growth +4.7/5.0
- Livability +3.5/5.0
- Schools +3.0/10.0
- Condition / age +2.5/5.0
- Appreciation +0.0/10.0
$189,900
🖨 Deal sheet 📄 Offer letter ✓ Due diligence
Listing remarks
Welcome to this specious five bedroom and two and a half bath home just minutes to Fort Lee/Fort Gregg-Adams. This home was fully renovated in 2014 which included new vinyl siding 2014, windows 2014, roof 2014, electrical 2014, plumbing 2014, central air/heating 2014, kitchen cabinets 2014, appliances 2014, LVP flooring! The home has a nice open floor plan. It has a first floor primary bedroom. Updated bathrooms. Bedrooms are very good size. Primary bedroom is large. Recessed lighting throughout the first floor. Rear privacy fence. Off street parking. Centrally located and near major shopping, highways, etc.
Key facts
- Fully renovated
- New plumbing
- New electrical
Tags
Neighborhood map
What this means for you Summary
Snapshot
- This is a 4-bed/2.0-bath single-family listed at $190k.
Deal economics
- At list price, monthly cash flow is $276 ($3k/yr) — positive.
- The deal already cash-flows at list — no discount required.
- Meets the 1% rule at list price ($2k rent vs $190k).
- Recommended offer: $184k (3.0% below list) — sets the bar for market timing.
- Cap rate 8.0% vs local median 4.2% in Hopewell — top-decile yield for the area; either an underpriced asset or a hidden risk that comps aren't pricing in. Stress-test before assuming the spread holds.
Location & tenants
- Location reads 70/100 on livability (#224 in VA) — a middle-class / working-renter tenant base. Strengths: cost of living A+, health & safety A+, schools A-; Watch: crime D+, amenities F, commute F.
- Hopewell City Public School District (suburban): math 23% / reading 49% proficiency, ranked #129 of 131 in VA (top 98%) — families likely to look elsewhere, expect single-tenant / working-renter base with shorter leases; 68% free/reduced lunch — lower-income household profile, screen leases tightly.
- Market conditions: Rents rising fast (+8.9%/yr); 228 active listings in the ZIP; 7 comparable units currently listed for rent nearby; rentals leasing fast (median 10d on market — plan ~1-2 weeks tenant-placement turnaround); 42 units permitted in Hopewell city in 2024 (0 in 5+ unit buildings).
- This rent runs 39% of the median local income ($62k/yr) — at the standard rent-burdened threshold; future hikes will face affordability resistance.
Forward outlook
- Local home prices are declining (-3.0%/yr); year-one equity from $1k of loan paydown is wiped out by about $6k of value loss. Plan a longer hold.
- Hopewell County population projected to shrink 7% by 2050 — rents likely to lag national; underwrite the cash flow, not the appreciation.
- At projected returns (-3.0% appreciation + 8.0% rent growth), your $53k cash investment doubles in ~9 years — after that, you're playing with house money.
Negotiation context
- It's been on market 37 days — a 3% lower offer ($184k) is reasonable based on typical stale-listing flexibility.
- 12 sale attempts since 20y ago with the ask held roughly flat each time — persistent listings suggest the price (not the market) is what's stuck; bring a comps-based counter.
- Current owner paid $26k; list at $190k implies a 623% gain — meaningful room to come down on a strong offer.
Risks & watch-outs
- Watch-outs: built in 1946 — expect roof / HVAC / electrical / plumbing capex.
- Climate carrying-cost: major wind risk, 51% chance of damaging wind over 30y; extreme-heat days projected 7→16/yr by 2055 (HVAC capex compounding) — expect insurance premiums to compound above CPI over the hold.
Questions for the listing agent
- It's been on market 37 days. Have you received any prior offers? Is the seller open to a 3% concession, seller financing, or rate buy-down credit?
- Built in 1946 — when were the roof, HVAC, electrical panel, plumbing, and water heater last replaced?
- Is there a deadline driving the sale (1031 exchange, divorce, estate, relocation)? That informs how much negotiation room exists.
- Schools are A-rated — typically a magnet for longer-tenancy family renters. What's the average tenant stay here, and is there a school-zone premium baked into asking?
- Crime grade is D in this area — have there been break-ins, vandalism, or insurance claims at this property in the last 3 years? What carrier currently insures it and at what premium?
- What's the average days-on-market for RENTAL listings here right now (not sales)? A rising rental-DOM trend means longer vacancies and softer asking-rent achievability than the comps imply.
- What's the recent tenant-quality profile in this submarket — average credit score on applications, eviction rate, late-payment / NSF rate, and stable-employment percentage? A property-management company in the area should have these aggregated.
- How much new for-sale + rental construction is in the pipeline within 1–3 miles? Heavy new supply typically softens prices + rents 12–24 months out; constrained supply supports both.
Investment metrics
- 1% rule
- 1.05% ✓
- Cap rate
- 8.04%
- Cash-on-cash
- 6.23%
- DSCR
- 1.28
- GRM
- 7.9
CMA / ARV
- ARV (on-the-fly)
- $339,456
- Comps found
- 12
Show comp detail 12 sales within ~0.75 mi
| Address | Dist | Beds/Ba | Sqft | Sold | Price | $/sf | Match |
|---|---|---|---|---|---|---|---|
| 3411 Trenton St | 0.00mi | 4/2.5 | 2,176 (0%) | 0mo | $188,000 | $86 | 98 |
| 1402 Davis Ln | 0.08mi | 4/2.5 | 2,140 (-2%) | 7mo | $345,000 | $161 | 86 |
| 3405 Clay St | 0.53mi | 4/2.0 | 2,136 (-2%) | 2mo | $329,950 | $154 | 71 |
| 3311 Jacobs Ave | 0.46mi | 5/2.0 (+1) | 2,112 (-3%) | 1mo | $329,000 | $156 | 68 |
| 3315 Virginia St | 0.22mi | 4/2.0 | 1,891 (-13%) | 3mo | $330,000 | $175 | 65 |
| 2915 Belmont Ave | 0.43mi | 4/2.0 | 1,937 (-11%) | 2mo | $225,000 | $116 | 60 |
| 3706 Paul Karnes Dr | 0.70mi | 4/2.5 | 2,172 (-0%) | 9mo | $365,000 | $168 | 58 |
| 802 Smithfield Ave | 0.62mi | 4/2.0 | 2,309 (+6%) | 7mo | $280,000 | $121 | 55 |
| 1900 Davis Ln | 0.53mi | 3/2.5 (-1) | 2,019 (-7%) | 9mo | $325,000 | $161 | 49 |
| 807 North Ave | 0.64mi | 4/2.5 | 2,358 (+8%) | 10mo | $350,000 | $148 | 46 |
| 1618 Old Iron Rd | 0.58mi | 4/2.0 | 1,928 (-11%) | 10mo | $262,500 | $136 | 46 |
| 3404 Wilmington Ave | 0.66mi | 4/2.5 | 1,930 (-11%) | 6mo | $337,500 | $175 | 43 |
Match score weights: distance 35% · size 25% · config 20% · recency 20%. Top-matched comps best support the ARV.
Projected returns pro-forma
-3.0% appreciation · 8.0% rent growth · sell at horizon
- IRR
- -1.2%
- Equity multiple
- 0.95×
- Total profit
- $-2,597
- Equity at exit
- $28,315
- IRR
- 13.1%
- Equity multiple
- 2.29×
- Total profit
- $68,536
- Equity at exit
- $16,419
Cash invested: $53,172 (down + closing). Projections, not guarantees.
Landlord ↔ Tenant lean methodology
- Overall (STATE)
- 55 Moderately Landlord-Leaning
- State Virginia
- 55 Moderately Landlord-Leaning · D+2
- County
- — inherits STATE
- City
- — inherits STATE
ZIP-level market 23860
- Home prices YoY
- -22.0%
- Rents YoY
- 8.9%
- Active inventory
- 228
- Price-to-rent
- 7.9×
Monthly cashflow live
- Estimated rent
- $1,997 high interval (Pro) →
- Mortgage (P&I)
- −$996
- Tax from tax record
- −$227 /mo · $2,721/yr
- Insurance
- −$79
- HOA
- −$0
- Vacancy / Maint / Mgmt
- −$419
- Net cashflow
- $276
Break-even live
UW: 25.0% down · 7.5% · 30yr · 1.5% tax · 5.0% vac · 8.0% maint · 8.0% mgmt
Financing live
Cash to close
- Down payment
- $47,475
- Closing costs
- $5,697
- Reserves months
- —
- Total cash needed
- —
Loan-product check · same deal, 3 products live
Conventional
25% down · 7.5% · 30yr
- Down + closing
- —
- Monthly P&I
- —
- Monthly cashflow
- —
- DSCR
- —
- Eligible?
- —
Personal DTI + credit; lowest rate.
DSCR
20% down · 8.5% · 30yr
- Down + closing
- —
- Monthly P&I
- —
- Monthly cashflow
- —
- DSCR
- —
- Eligible?
- —
No personal income docs; deal must DSCR.
Hard money
10% down · 12.0% · 12mo
- Down + closing
- —
- Monthly P&I
- —
- Monthly cashflow
- —
- DSCR
- —
- Eligible?
- —
Short-term bridge; refi at stabilization.
Rent comps 7 comps
| Address | Beds | Baths | Sqft | Rent | $/sqft | DOM | Units | Dist |
|---|---|---|---|---|---|---|---|---|
| 3314 Granby St Hopewell, VA | 3.0 | 1.0 | 1469 | $1,600 | $1.09 | 23d | 1 | 0.12mi |
| 1700 Dinwiddie Ave Hopewell, VA | 4.0 | 3.0 | 2334 | $2,895 | $1.24 | 43d | 1 | 0.42mi |
| 2958 Winston Churchill Dr Hopewell, VA | 3.0 | 2.0 | 1576 | $1,795 | $1.14 | 23d | 1 | 0.51mi |
| 4001 London Rd North Prince George, VA | 3.0 | 1.5 | 1414 | $2,300 | $1.63 | 10d | 1 | 1.04mi |
| 4001 London Rd North Prince George, VA | 3.0 | 1.5 | 1414 | $2,300 | $1.63 | 1d | 1 | 1.04mi |
| 3568 Perrins Hill Way Prince George, VA | 3.0 | 2.5 | 1500 | $2,200 | $1.47 | 1d | 1 | 1.31mi |
| 5000 Owens Way Prince George, VA | 1.0–4.0 | 1.0–4.0 | 1106 | $2,850 | $2.58 | 1d | 25 | 1.40mi |
Listing history 28 events
-
2026-03-16status Pending
-
2026-02-07$189,900 Active
-
2025-07-28$295,000 Active
-
2025-07-27status Active
-
2025-07-09historical
-
2025-07-07status Pending
-
2025-06-25price $285,000
-
2025-06-10price $294,950
-
2025-05-11$295,000 Active
-
2014-08-17historical
-
2014-06-27$150,000
-
2012-12-11soldstatus $26,250
-
2012-08-22historical
-
2012-02-28$36,900
-
2012-01-23soldstatus $58,500
-
2007-06-14soldstatus $124,900
-
2007-06-14soldstatus $124,900
-
2007-06-13soldstatus $124,900
-
2007-01-18$119,900
-
2007-01-18$119,900
-
2007-01-12historical
-
2007-01-12historical
-
2006-09-22$139,900
-
2006-09-22$139,900
-
2006-08-23soldstatus $86,000
-
2006-08-23soldstatus $86,000
-
2006-06-02$85,000
-
2006-06-02$85,000
ⓘ Source: listings_history table (triggers on properties + properties_extension) + one-shot
backfill from property_details.listing_events for pre-trigger history.
Tax reassessment forecast VA · Resets to sale price
- Current annual tax
- $2,721 · $227/mo
- Projected year-2 tax
- $2,721 · $227/mo
- Expected delta
- $0/yr ($0/mo · 0.0%)
ⓘ Screening estimate from a state-policy table — verify with the county assessor before closing.
Climate risk First Street
- Flood 1/10 Low FEMA zone X (unshaded) · 0% chance over 30 yrs
- Wildfire 1/10 Low
- Heat 8/10 Severe 7 d/yr ≥108°F today · 16 d/yr by 30 yrs out
- Wind 6/10 Major 51% chance of damaging wind over 30 yrs
- Air quality 2/10 Low 1 unhealthy d/yr today · 2 by 30 yrs out
Nearby sold comps map
Loading sold comps map…
Walkable amenities ~0.75 mi
Loading nearby amenities…
Taxation est. · year 1
- Rental income
- $23,970
- − Mortgage interest
- −$10,637
- − Property taxes
- −$2,721
- − Insurance
- −$950
- − Repairs & maintenance
- −$1,918
- − Management
- −$1,918
- − Depreciation
- −$5,524
- Taxable income
- $302
- Est. tax owed @ 24.0%
- −$72
- After-tax cash flow
- $3,243/yr
For passive investors: Depreciation is non-cash, so a rental often shows a tax loss while cash-flowing — sheltering income. Rental losses are passive: they offset passive income freely, and up to $25,000/yr can offset ordinary (W-2) income if you actively participate and your MAGI is under $100k (phasing out to $0 by $150k); unused losses carry forward. On sale, claimed depreciation is recaptured at up to 25%, and gains may owe capital-gains tax (a 1031 exchange can defer both). Figures are a year-1 estimate at your 24.0% rate — not tax advice; consult a CPA.
Schools (NCES district)
- District
- Hopewell City Public School District
- NCES district ID
- 5101980
- Math proficiency
- 23% ▼ -54.00%
- Reading proficiency
- 49% ▼ -18.00%
- Median HH income
- $38,234
- Composite
- 29.95/100
- National rank
- #6377
- State rank
- #129 of 131 in VA
Livability — Hopewell
- Score
- 70/100
- State rank
- #224
- US rank
- #7437
Category grades
Schools grade is shown separately in the Schools card above.
Census & demographics
- Census place
- Hopewell, VA
- County
- Hopewell City · 31,404 people
- City population
- 31,404
- Metro
- Richmond, VA
- Population (ZIP)
- 31,404
- Household income
- $62,141
- Rent vs Own
- Severe rent burden
- 1055.0
Population outlook (Hopewell County) Hauer SSP2
- Today (2025)
- 21,776 people
- By 2030
- 21,457 · -1.5%
- By 2040
- 20,882 · -4.1%
- By 2050
- 20,239 · -7.1%
- By 2075
- 18,905 · -13.2%
- By 2100
- 16,949 · -22.2%
Race, ethnicity, and origin ACS 2023
- Neighborhood character
- Diverse neighborhood (Simpson 0.64)
- Race & ethnicity
- White 43% Black 42% Two or more races 9% Hispanic / Latino 8% Asian 1%
- Hispanic origin (detail)
- Mexican 2% Puerto Rican 2%
- Common ancestry
- Slovak 1% Romanian 1% Serbian 1%
- Foreign-born
- 3% · Canada
- Languages at home
- 94% English-only · Spanish 4% German/W. Germanic 1%
Political lean MEDSL · Hopewell
- 2024 margin
- D (+13.8) · D 56.4% · R 42.6% · Other 1.0%
- 2008→2024 swing
- +1.8pp toward D · 2008: 11.9pp · 2024: 13.8pp
- All cycles
- 2024: D+13.8 2020: D+14.7 2016: D+9.3 2012: D+16.0 2008: D+11.9
Not yet ingested
- Civics
- —
Market trends
- HPI YoY
- ▼ -85.28%
- Current HPI
- 302.6343
- Rent YoY
- ▲ 8.86%
- Metro
- Richmond, VA
- State GDP YoY
- ▲ 2.40%
- F500 in state
- 50
Industry mix (Fortune 500 HQ in VA)
| Industry | F500 HQs | Revenue |
|---|---|---|
| Aerospace / Defense | 4 | $236B |
|
||
| Technology / Defense | 3 | $32B |
|
||
| Financial Services | 2 | $176B |
|
||
| Utilities | 2 | $27B |
|
||
| Insurance | 2 | $25B |
|
||
| Technology | 2 | $15B |
|
||
Price history
+123.4% since first listed28 events — show timeline
- 2026-03-16 Pending — CVRMLS
- 2026-02-07 Listed $189,900 CVRMLS
- 2025-07-28 Listed $295,000 CVRMLS
- 2025-07-27 Relisted — CVRMLS
- 2025-07-09 Listing Removed — CVRMLS
- 2025-07-07 Pending — CVRMLS
- 2025-06-25 Price Changed $285,000 CVRMLS
- 2025-06-10 Price Changed $294,950 CVRMLS
- 2025-05-11 Listed $295,000 CVRMLS
- 2014-08-17 Listing Removed — CVRMLS
- 2014-06-27 Listed $150,000 CVRMLS
- 2012-12-11 Sold (MLS) $26,250 CVRMLS
- 2012-08-22 Listing Removed — CVRMLS
- 2012-02-28 Listed $36,900 CVRMLS
- 2012-01-23 Sold (Public Records) $58,500 Public Records
- 2007-06-14 Sold (MLS) $124,900 CVRMLS
- 2007-06-14 Sold (MLS) $124,900 CVRMLS
- 2007-06-13 Sold (Public Records) $124,900 Public Records
- 2007-01-18 Listed $119,900 CVRMLS
- 2007-01-18 Listed $119,900 CVRMLS
- 2007-01-12 Listing Removed — CVRMLS
- 2007-01-12 Listing Removed — CVRMLS
- 2006-09-22 Listed $139,900 CVRMLS
- 2006-09-22 Listed $139,900 CVRMLS
- 2006-08-23 Sold (MLS) $86,000 CVRMLS
- 2006-08-23 Sold (MLS) $86,000 CVRMLS
- 2006-06-02 Listed $85,000 CVRMLS
- 2006-06-02 Listed $85,000 CVRMLS
Property tax history
+6.6%/yrLatest (2025): $2,721 · +13.4% YoY. Source: county tax records.
Cash-flow waterfall
monthlySold comps — $/sqft
last 12 mo · ≤1 miLoading sold comps…