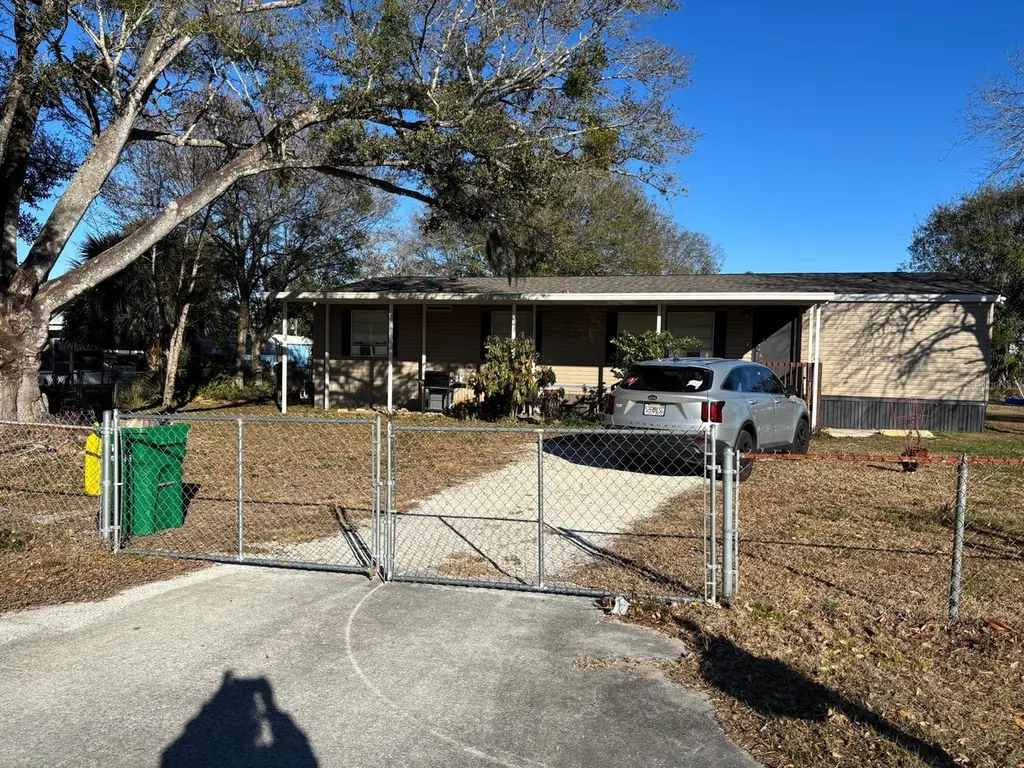
3303 Turnbull Rd · Mims, FL
Flood risk 1/10 · Minimal
- FEMA flood zone
- X (unshaded)
- Chance of flooding over 30 yrs
- 0.0%
- Est. flood insurance / yr
- $507 – $1,088
Fire risk 4/10 · Minor
- Est. fire insurance / yr
- $947 – $1,759
Heat risk 10/10 · Severe
- Hot days now (above 108°F)
- 7 days/yr
- Hot days in 30 yrs
- 21 days/yr
Wind risk 10/10 · Severe
- Chance of severe wind over 30 yrs
- 99.0%
Air-quality risk 1/10 · Minimal
- Unhealthy air days now
- 0 days/yr
- Unhealthy air days in 30 yrs
- 0 days/yr
Risk factors via First Street. Map © Google.
Why this score? — see what drove the B- grade
The composite is a weighted blend of 9 inputs, each scored 0–100. Each bar is that input's sub-score; the figure is the points it added to the 100-point composite (weight × sub-score).
- Cash flow +29.6/30.0
- DSCR +10.0/10.0
- 1% rule +8.0/10.0
- ARV discount +7.5/15.0
- Schools +4.7/10.0
- Livability +3.1/5.0
- Rent growth +2.5/5.0
- Condition / age +2.5/5.0
- Appreciation +0.0/10.0
$175,000
🖨 Deal sheet 📄 Offer letter ✓ Due diligence
Listing remarks MLS
Spacious 3 bed 2 bath home, just out of town with that in the county feel. Enjoy your corner lot, fully fenced and NO HOA. This split plan home is over 1800 sq ft, on . 31 of an acre and has a parking out back for all your toys. The building outback is likely a tear down, unless you are handy and can fix. Inside you have tons of room with a family and dining room, the master has its very own sitting room and huge walk in closet, the kitchen boast of a generous amount of cabinets and counter space, newer appliances and lovely natural light. Great property for 203K FHA loan, as the house needs some repair. Come make this house your home! HVAC 2013, W/ H 2010, Roof 2005.
Key facts
- 0.38 acre lot
- Built 2005
- Listed 64 days
Property features AI
Finance
- Other: Lot approximately 0.38 acres (97 x 170); Asphalt road access; Living area reported as 1,800 square feet; Property type: Residential; Property subtype: Manufactured Home; Zoning: TR-1; Furnished: Unfurnished
- HOA & community: No association indicated
Exterior
- Utilities: Public water; Septic tank; Electricity connected
- Home design: Manufactured home (Double wide); Single-story; Faces southwest; Homestead exempt
- Construction: Shingle roof; Constructed with other materials; Crawlspace foundation
- Exterior features: Other exterior features
Interior
- Kitchen: Dishwasher; Disposal; Microwave; Range; Refrigerator; Electric water heater
- Bedrooms: 3 bedrooms
- Flooring: Vinyl
- Bathrooms: 2 full bathrooms
- Heating & cooling: No heating system specified; Cooling: Other
- Interior features: Open floorplan; 3 total rooms
- Laundry & utility: Inside laundry
Neighborhood map
What this means for you Summary
Snapshot
- This is a 3-bed/2.0-bath manufactured listed at $175k.
Deal economics
- At list price, monthly cash flow is $630 ($8k/yr) — positive.
- The deal already cash-flows at list — no discount required.
- Meets the 1% rule at list price ($2k rent vs $175k).
- Recommended offer: $164k (6.0% below list) — sets the bar for market timing.
Location & tenants
- Location reads 62/100 on livability (#765 in FL) — a middle-class / working-renter tenant base. Strengths: cost of living A+, housing A+, crime B+; Watch: schools D+, amenities F, commute F.
- Brevard (suburban): math 53% / reading 57% proficiency, ranked #19 of 73 in FL (top 26%) — acceptable for families but not a draw, mixed tenant base, ~2y average lease.
- Market conditions: 184 active listings in the ZIP; 1 comparable units currently listed for rent nearby; 4,602 units permitted in Brevard County in 2024 (702 in 5+ unit buildings).
Forward outlook
- Local home prices are declining (-3.0%/yr); year-one equity from $1k of loan paydown is wiped out by about $5k of value loss. Plan a longer hold.
- Brevard County population projected at +15% by 2050 — modest demand growth; plan on rents tracking national, not racing it.
- At projected returns (-3.0% appreciation + 3.0% rent growth), your $49k cash investment doubles in ~8 years — after that, you're playing with house money.
Negotiation context
- It's been on market 64 days — a 6% lower offer ($164k) is reasonable based on typical stale-listing flexibility.
- 2 sale attempts since 3y ago with the ask held roughly flat each time — persistent listings suggest the price (not the market) is what's stuck; bring a comps-based counter.
Risks & watch-outs
- Climate carrying-cost: severe wind risk, 99% chance of damaging wind over 30y; extreme-heat days projected 7→21/yr by 2055 (HVAC capex compounding) — expect insurance premiums to compound above CPI over the hold.
Questions for the listing agent
- It's been on market 64 days. Have you received any prior offers? Is the seller open to a 6% concession, seller financing, or rate buy-down credit?
- Why hasn't it sold? Are there any deal-killer items the seller is aware of (foundation, flood, title, zoning, code violations)?
- Is there a deadline driving the sale (1031 exchange, divorce, estate, relocation)? That informs how much negotiation room exists.
- Schools are D-rated, which usually means shorter tenancies and higher turnover. Who's the typical renter profile here, and what's been the actual vacancy rate?
- What's the average days-on-market for RENTAL listings here right now (not sales)? A rising rental-DOM trend means longer vacancies and softer asking-rent achievability than the comps imply.
- What's the recent tenant-quality profile in this submarket — average credit score on applications, eviction rate, late-payment / NSF rate, and stable-employment percentage? A property-management company in the area should have these aggregated.
- How much new for-sale + rental construction is in the pipeline within 1–3 miles? Heavy new supply typically softens prices + rents 12–24 months out; constrained supply supports both.
Investment metrics
- 1% rule
- 1.30% ✓
- Cap rate
- 10.61%
- Cash-on-cash
- 15.42%
- DSCR
- 1.69
- GRM
- 6.4
CMA / ARV
No comps found within radius.
Projected returns pro-forma
-3.0% appreciation · 3.0% rent growth · sell at horizon
- IRR
- 6.2%
- Equity multiple
- 1.24×
- Total profit
- $11,747
- Equity at exit
- $26,093
- IRR
- 15.5%
- Equity multiple
- 2.26×
- Total profit
- $61,889
- Equity at exit
- $15,131
Cash invested: $49,000 (down + closing). Projections, not guarantees.
Landlord ↔ Tenant lean methodology
- Overall (STATE)
- 87 Strongly Landlord-Friendly
- State Florida
- 87 Strongly Landlord-Friendly · R+3
- County
- — inherits STATE
- City
- — inherits STATE
ZIP-level market 32754
- Home prices YoY
- -9.4%
- Active inventory
- 184
- Price-to-rent
- 6.4×
Monthly cashflow live
- Estimated rent
- $2,271 medium interval (Pro) →
- Mortgage (P&I)
- −$918
- Tax from tax record
- −$174 /mo · $2,087/yr
- Insurance
- −$73
- HOA
- −$0
- Vacancy / Maint / Mgmt
- −$477
- Net cashflow
- $630
Break-even live
UW: 25.0% down · 7.5% · 30yr · 1.5% tax · 5.0% vac · 8.0% maint · 8.0% mgmt
Financing live
Cash to close
- Down payment
- $43,750
- Closing costs
- $5,250
- Reserves months
- —
- Total cash needed
- —
Loan-product check · same deal, 3 products live
Conventional
25% down · 7.5% · 30yr
- Down + closing
- —
- Monthly P&I
- —
- Monthly cashflow
- —
- DSCR
- —
- Eligible?
- —
Personal DTI + credit; lowest rate.
DSCR
20% down · 8.5% · 30yr
- Down + closing
- —
- Monthly P&I
- —
- Monthly cashflow
- —
- DSCR
- —
- Eligible?
- —
No personal income docs; deal must DSCR.
Hard money
10% down · 12.0% · 12mo
- Down + closing
- —
- Monthly P&I
- —
- Monthly cashflow
- —
- DSCR
- —
- Eligible?
- —
Short-term bridge; refi at stabilization.
Rent comps 1 comps
| Address | Beds | Baths | Sqft | Rent | $/sqft | DOM | Units | Dist |
|---|---|---|---|---|---|---|---|---|
| 3738 Loggerhead Ln Mims, FL | 4.0 | 2.0 | 1918 | $2,271 | $1.18 | 14d | 1 | 0.72mi |
Listing history 19 events
-
2026-06-18days on market $175,000 Active 64 DOM
-
2026-06-17days on market $175,000 Active 63 DOM
-
2026-06-16days on market $175,000 Active 62 DOM
-
2026-06-15days on market $175,000 Active 61 DOM
-
2026-06-14days on market $175,000 Active 59 DOM
-
2026-06-10days on market $175,000 Active 56 DOM
-
2026-06-08days on market $175,000 Active 54 DOM
-
2026-06-07days on market $175,000 Active 53 DOM
-
2026-06-05days on market $175,000 Active 50 DOM
-
2026-06-03days on market $175,000 Active 49 DOM
-
2026-06-02days on market $175,000 Active 48 DOM
-
2026-06-01days on market $175,000 Active 47 DOM
-
2026-05-31days on market $175,000 Active 46 DOM
-
2026-05-31days on market $175,000 Active 45 DOM
-
2026-04-15$175,000 Active
-
2023-08-07soldstatus $220,000 Closed 676-char remark
Show marketing remark (676 chars)
Spacious 3 bed 2 bath home, just out of town with that in the county feel. Enjoy your corner lot, fully fenced and NO HOA. This split plan home is over 1800 sq ft, on . 31 of an acre and has a parking out back for all your toys. The building outback is likely a tear down, unless you are handy and can fix. Inside you have tons of room with a family and dining room, the master has its very own sitting room and huge walk in closet, the kitchen boast of a generous amount of cabinets and counter space, newer appliances and lovely natural light. Great property for 203K FHA loan, as the house needs some repair. Come make this house your home! HVAC 2013, W/ H 2010, Roof 2005.
-
2023-06-10historical Contingent 676-char remark
Show marketing remark (676 chars)
Spacious 3 bed 2 bath home, just out of town with that in the county feel. Enjoy your corner lot, fully fenced and NO HOA. This split plan home is over 1800 sq ft, on . 31 of an acre and has a parking out back for all your toys. The building outback is likely a tear down, unless you are handy and can fix. Inside you have tons of room with a family and dining room, the master has its very own sitting room and huge walk in closet, the kitchen boast of a generous amount of cabinets and counter space, newer appliances and lovely natural light. Great property for 203K FHA loan, as the house needs some repair. Come make this house your home! HVAC 2013, W/ H 2010, Roof 2005.
-
2023-05-30$230,000 Active 676-char remark
Show marketing remark (676 chars)
Spacious 3 bed 2 bath home, just out of town with that in the county feel. Enjoy your corner lot, fully fenced and NO HOA. This split plan home is over 1800 sq ft, on . 31 of an acre and has a parking out back for all your toys. The building outback is likely a tear down, unless you are handy and can fix. Inside you have tons of room with a family and dining room, the master has its very own sitting room and huge walk in closet, the kitchen boast of a generous amount of cabinets and counter space, newer appliances and lovely natural light. Great property for 203K FHA loan, as the house needs some repair. Come make this house your home! HVAC 2013, W/ H 2010, Roof 2005.
-
2019-03-01soldstatus $120,000
ⓘ Source: listings_history table (triggers on properties + properties_extension) + one-shot
backfill from property_details.listing_events for pre-trigger history.
Tax reassessment forecast FL · Resets to sale price
- Current annual tax
- $2,087 · $174/mo
- Projected year-2 tax
- $2,087 · $174/mo
- Expected delta
- $0/yr ($0/mo · 0.0%)
ⓘ Screening estimate from a state-policy table — verify with the county assessor before closing.
Climate risk First Street
- Flood 1/10 Low FEMA zone X (unshaded) · 0% chance over 30 yrs
- Wildfire 4/10 Moderate
- Heat 10/10 Extreme 7 d/yr ≥108°F today · 21 d/yr by 30 yrs out
- Wind 10/10 Extreme 99% chance of damaging wind over 30 yrs
- Air quality 1/10 Low 0 unhealthy d/yr today · 0 by 30 yrs out
Nearby sold comps map
Loading sold comps map…
Walkable amenities ~0.75 mi
Loading nearby amenities…
Taxation est. · year 1
- Rental income
- $27,252
- − Mortgage interest
- −$9,803
- − Property taxes
- −$2,087
- − Insurance
- −$875
- − Repairs & maintenance
- −$2,180
- − Management
- −$2,180
- − Depreciation
- −$5,091
- Taxable income
- $5,037
- Est. tax owed @ 24.0%
- −$1,209
- After-tax cash flow
- $6,346/yr
For passive investors: Depreciation is non-cash, so a rental often shows a tax loss while cash-flowing — sheltering income. Rental losses are passive: they offset passive income freely, and up to $25,000/yr can offset ordinary (W-2) income if you actively participate and your MAGI is under $100k (phasing out to $0 by $150k); unused losses carry forward. On sale, claimed depreciation is recaptured at up to 25%, and gains may owe capital-gains tax (a 1031 exchange can defer both). Figures are a year-1 estimate at your 24.0% rate — not tax advice; consult a CPA.
Schools (NCES district)
- District
- Brevard
- NCES district ID
- 1200150
- Math proficiency
- 53% ▼ -9.00%
- Reading proficiency
- 57% ▼ -4.00%
- Median HH income
- $49,426
- Composite
- 46.86/100
- National rank
- #2370
- State rank
- #19 of 73 in FL
Livability — Mims
- Score
- 62/100
- State rank
- #765
- US rank
- #17094
Category grades
Schools grade is shown separately in the Schools card above.
Census & demographics
- Census place
- Mims, FL
- Population (ZIP)
- 11,250
Population outlook (Brevard County) Hauer SSP2
- Today (2025)
- 623,254 people
- By 2030
- 648,420 · +4.0%
- By 2040
- 690,009 · +10.7%
- By 2050
- 715,669 · +14.8%
- By 2075
- 775,744 · +24.5%
- By 2100
- 776,687 · +24.6%
Race, ethnicity, and origin ACS 2023
- Neighborhood character
- Predominantly White (92%)
- Race & ethnicity
- White 92% Black 5% Two or more races 3% Hispanic / Latino 2%
- Common ancestry
- Lithuanian 4% Iranian 3% Italian 2%
- Foreign-born
- 2% · Canada
- Languages at home
- 97% English-only · Spanish 1% French/Haitian/Cajun 1%
Political lean MEDSL · Brevard
- 2024 margin
- Strong R (+20.8) · D 39.1% · R 59.9% · Other 1.0%
- 2008→2024 swing
- -10.4pp toward R · 2008: -10.4pp · 2024: -20.8pp
- All cycles
- 2024: R+20.8 2020: R+16.4 2016: R+19.8 2012: R+12.7 2008: R+10.4
Not yet ingested
- Civics
- —
Market trends
- HPI YoY
- ▼ -34.55%
- Current HPI
- 333.7709
- Rent YoY
- —
- Metro
- —
- State GDP YoY
- ▲ 3.28%
- F500 in state
- 36
Industry mix (Fortune 500 HQ in FL)
| Industry | F500 HQs | Revenue |
|---|---|---|
| Industrial Technology | 2 | $29B |
|
||
| Insurance | 2 | $17B |
|
||
| Retail | 1 | $60B |
|
||
| Technology Distribution | 1 | $58B |
|
||
| Homebuilding | 1 | $35B |
|
||
| Technology Manufacturing | 1 | $35B |
|
||
Price history
+45.8% since first listed5 events — show timeline
- 2026-04-15 Listed $175,000 Stellar MLS as Distributed by MLS Grid
- 2023-08-07 Sold (MLS) $220,000 SCMLS
- 2023-06-10 Contingent — SCMLS
- 2023-05-30 Listed $230,000 SCMLS
- 2019-03-01 Sold (Public Records) $120,000 Public Records
Property tax history
+8.7%/yrLatest (2025): $2,087 · +0.0% YoY. Source: county tax records.
Cash-flow waterfall
monthlySold comps — $/sqft
last 12 mo · ≤1 miLoading sold comps…