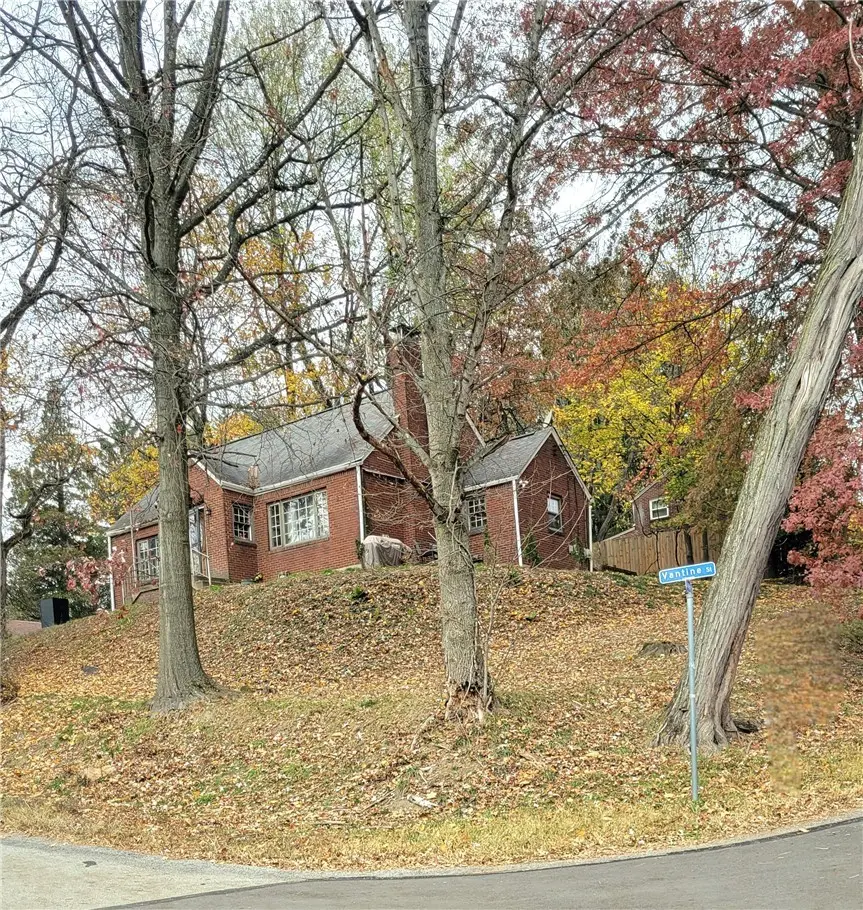
109 Lavern · Wilkinsburg, PA
Flood risk 1/10 · Minimal
- FEMA flood zone
- X (unshaded)
- Chance of flooding over 30 yrs
- 0.0%
- Est. flood insurance / yr
- $473 – $860
Fire risk 1/10 · Minimal
- Est. fire insurance / yr
- $511 – $949
Heat risk 3/10 · Minor
- Hot days now (above 96°F)
- 6 days/yr
- Hot days in 30 yrs
- 14 days/yr
Wind risk 2/10 · Minimal
- Chance of severe wind over 30 yrs
- —
Air-quality risk 4/10 · Minor
- Unhealthy air days now
- 5 days/yr
- Unhealthy air days in 30 yrs
- 7 days/yr
Risk factors via First Street. Map © Google.
Why this score? — see what drove the C+ grade
The composite is a weighted blend of 9 inputs, each scored 0–100. Each bar is that input's sub-score; the figure is the points it added to the 100-point composite (weight × sub-score).
- Cash flow +21.4/30.0
- ARV discount +15.0/15.0
- 1% rule +7.7/10.0
- DSCR +6.8/10.0
- Rent growth +4.4/5.0
- Livability +3.8/5.0
- Condition / age +2.5/5.0
- Schools +1.6/10.0
- Appreciation +0.0/10.0
$125,000
🖨 Deal sheet 📄 Offer letter ✓ Due diligence
Listing remarks MLS
BACK ON MARKET, don't miss out of this spectacular 4-bedroom brick investment property sitting atop a hill within a lovely and highly sought-after Pittsburgh community! With some TLC, this home has the space and flexibility to be an amazing dream home or a great income-generating rental property! Whether you're investing in your future home or in your real estate portfolio, this gem of a house is a perfect fit! Schedule a tour asap!
Key facts
- 0.3 acre lot
- Garage
- Built 1955
Neighborhood map
What this means for you Summary
Snapshot
- This is a 3-bed/1.0-bath single-family listed at $125k.
Deal economics
- At list price, monthly cash flow is $184 ($2k/yr) — positive.
- The deal already cash-flows at list — no discount required.
- Meets the 1% rule at list price ($2k rent vs $125k).
- Recommended offer: $114k (9.0% below list) — sets the bar for market timing.
- Cap rate 8.1% vs local median 11.3% in Wilkinsburg — below-typical yield; the buyer is paying a premium for something (appreciation thesis, condition, location) that the cap rate doesn't capture.
Location & tenants
- Location reads 76/100 on livability (#411 in PA, #3,754 nationally) — a middle-class / working-renter tenant base. Strengths: commute A+, cost of living A+, housing A+; Watch: schools D+, health & safety D+, crime F.
- Penn Hills SD (suburban): math 13% / reading 24% proficiency, ranked #496 of 539 in PA (top 92%) — low school quality limits family demand, transient renter base, plan for 1-2y turnover.
- Market conditions: Rents rising fast (+7.6%/yr); 129 active listings in the ZIP; 24 comparable units currently listed for rent nearby; rentals at typical pace (median 15d on market — plan ~3-4 weeks tenant-placement turnaround); 2,996 units permitted in Allegheny County in 2024 (1,588 in 5+ unit buildings).
Forward outlook
- Local home prices are declining (-3.0%/yr); year-one equity from $864 of loan paydown is wiped out by about $4k of value loss. Plan a longer hold.
- At projected returns (-3.0% appreciation + 7.6% rent growth), your $35k cash investment doubles in ~9 years — after that, you're playing with house money.
Negotiation context
- It's been on market 114 days — a 9% lower offer ($114k) is reasonable based on typical stale-listing flexibility.
- 4 sale attempts since 28y ago with the ask held roughly flat each time — persistent listings suggest the price (not the market) is what's stuck; bring a comps-based counter.
- Current owner paid $37k; list at $125k implies a 238% gain — meaningful room to come down on a strong offer.
Risks & watch-outs
- Watch-outs: property tax is 3.5% of price; built in 1955 — expect roof / HVAC / electrical / plumbing capex.
Questions for the listing agent
- It's been on market 114 days. Have you received any prior offers? Is the seller open to a 9% concession, seller financing, or rate buy-down credit?
- Built in 1955 — when were the roof, HVAC, electrical panel, plumbing, and water heater last replaced?
- Property tax is high relative to price — has the assessment been appealed recently, and will the sale trigger a re-assessment?
- Why hasn't it sold? Are there any deal-killer items the seller is aware of (foundation, flood, title, zoning, code violations)?
- Is there a deadline driving the sale (1031 exchange, divorce, estate, relocation)? That informs how much negotiation room exists.
- Schools are D-rated, which usually means shorter tenancies and higher turnover. Who's the typical renter profile here, and what's been the actual vacancy rate?
- Crime grade is F in this area — have there been break-ins, vandalism, or insurance claims at this property in the last 3 years? What carrier currently insures it and at what premium?
- What's the average days-on-market for RENTAL listings here right now (not sales)? A rising rental-DOM trend means longer vacancies and softer asking-rent achievability than the comps imply.
- What's the recent tenant-quality profile in this submarket — average credit score on applications, eviction rate, late-payment / NSF rate, and stable-employment percentage? A property-management company in the area should have these aggregated.
- How much new for-sale + rental construction is in the pipeline within 1–3 miles? Heavy new supply typically softens prices + rents 12–24 months out; constrained supply supports both.
Investment metrics
- 1% rule
- 1.27% ✓
- Cap rate
- 8.06%
- Cash-on-cash
- 6.32%
- DSCR
- 1.28
- GRM
- 6.5
CMA / ARV
- ARV (median comp)
- $167,650
- List price
- $125,000
- Delta
- -25.44%
- Verdict
- UNDERPRICED
- Comps
- 20 within 1.0 mi
Show comp detail 12 sales within ~0.75 mi
| Address | Dist | Beds/Ba | Sqft | Sold | Price | $/sf | Match |
|---|---|---|---|---|---|---|---|
| 2173 Sampson St | 0.09mi | 3/1.0 | 1,714 (+2%) | 3mo | $160,000 | $93 | 89 |
| 2534 Graham Blvd | 0.25mi | 3/2.5 | 1,680 (+0%) | 1mo | $340,000 | $202 | 81 |
| 1871 Atkinson Pl | 0.41mi | 3/1.0 | 1,700 (+2%) | 1mo | $240,000 | $141 | 77 |
| 200 Champa St | 0.15mi | 3/3.0 | 1,756 (+5%) | 4mo | $130,000 | $74 | 73 |
| 1842 Graham Blvd | 0.44mi | 3/2.5 | 1,628 (-3%) | 3mo | $243,500 | $150 | 66 |
| 8952 Eastwood Rd | 0.58mi | 3/2.0 | 1,714 (+2%) | 2mo | $245,000 | $143 | 63 |
| 2233 Laketon Rd | 0.55mi | 3/1.0 | 1,536 (-8%) | 4mo | $25,000 | $16 | 58 |
| 162 Conestoga Rd | 0.28mi | 3/2.0 | 1,435 (-14%) | 4mo | $185,500 | $129 | 56 |
| 10207 Pearl Rd | 0.69mi | 3/2.5 | 1,740 (+4%) | 3mo | $242,000 | $139 | 53 |
| 1730 Graham Blvd | 0.55mi | 2/2.0 (-1) | 1,850 (+10%) | 2mo | $120,000 | $65 | 46 |
| 2339 Collins Rd | 0.69mi | 3/2.0 | 1,468 (-12%) | 3mo | $257,000 | $175 | 41 |
| 1541 Graham Blvd | 0.71mi | 3/2.5 | 1,873 (+12%) | 3mo | $280,000 | $149 | 39 |
Match score weights: distance 35% · size 25% · config 20% · recency 20%. Top-matched comps best support the ARV.
Projected returns pro-forma
-3.0% appreciation · 7.63% rent growth · sell at horizon
- IRR
- -0.4%
- Equity multiple
- 0.98×
- Total profit
- $-590
- Equity at exit
- $18,638
- IRR
- 14.2%
- Equity multiple
- 2.44×
- Total profit
- $50,318
- Equity at exit
- $10,808
Cash invested: $35,000 (down + closing). Projections, not guarantees.
Landlord ↔ Tenant lean methodology
- Overall (STATE)
- 62 Landlord-Friendly
- State Pennsylvania
- 62 Landlord-Friendly · EVEN
- County
- — inherits STATE
- City
- — inherits STATE
ZIP-level market 15235
- Home prices YoY
- -34.1%
- Rents YoY
- 7.6%
- Active inventory
- 129
- Price-to-rent
- 6.5×
Monthly cashflow live
- Estimated rent
- $1,593 high interval (Pro) →
- Mortgage (P&I)
- −$656
- Tax from tax record
- −$367 /mo · $4,403/yr
- Insurance
- −$52
- HOA
- −$0
- Vacancy / Maint / Mgmt
- −$335
- Net cashflow
- $184
Break-even live
UW: 25.0% down · 7.5% · 30yr · 1.5% tax · 5.0% vac · 8.0% maint · 8.0% mgmt
Financing live
Cash to close
- Down payment
- $31,250
- Closing costs
- $3,750
- Reserves months
- —
- Total cash needed
- —
Loan-product check · same deal, 3 products live
Conventional
25% down · 7.5% · 30yr
- Down + closing
- —
- Monthly P&I
- —
- Monthly cashflow
- —
- DSCR
- —
- Eligible?
- —
Personal DTI + credit; lowest rate.
DSCR
20% down · 8.5% · 30yr
- Down + closing
- —
- Monthly P&I
- —
- Monthly cashflow
- —
- DSCR
- —
- Eligible?
- —
No personal income docs; deal must DSCR.
Hard money
10% down · 12.0% · 12mo
- Down + closing
- —
- Monthly P&I
- —
- Monthly cashflow
- —
- DSCR
- —
- Eligible?
- —
Short-term bridge; refi at stabilization.
Rent comps 24 comps
| Address | Beds | Baths | Sqft | Rent | $/sqft | DOM | Units | Dist |
|---|---|---|---|---|---|---|---|---|
| 3005 Laketon Rd Pittsburgh, PA | 3.0 | 1.0 | 1100 | $1,295 | $1.18 | 14d | 1 | 0.45mi |
| 648 Southern Ave Penn Hills, PA | 3.0 | 1.0 | 1100 | $1,600 | $1.45 | 7d | 1 | 0.51mi |
| 8918 Frankstown Rd Pittsburgh, PA | 3.0 | 1.0 | 1400 | $1,907 | $1.36 | 14d | 1 | 0.52mi |
| 610 Churchill Ave Pittsburgh, PA | 3.0 | 1.0 | 1100 | $1,395 | $1.27 | 2d | 1 | 0.54mi |
| 10135 Pearl Rd Pittsburgh, PA | 3.0 | 2.0 | 1163 | $1,450 | $1.25 | 23d | 1 | 0.61mi |
| 103 Grove Rd Verona, PA | 3.0 | 1.5 | 1460 | $1,450 | $0.99 | 12d | 1 | 0.62mi |
| 216 Grove Rd Verona, PA | 3.0 | 1.0 | 1165 | $1,550 | $1.33 | 43d | 1 | 0.69mi |
| 8606 Westwood Rd Pittsburgh, PA | 4.0 | 1.0 | 1596 | $1,425 | $0.89 | 43d | 1 | 0.78mi |
| 2031 Chalfant St Pittsburgh, PA | 3.0 | 1.5 | 1150 | $1,950 | $1.70 | 43d | 1 | 0.78mi |
| 8612 Oakcrest Rd Pittsburgh, PA | 2.0 | 1.0 | 1218 | $1,450 | $1.19 | 23d | 1 | 0.82mi |
| 314 Penn Vista Dr Pittsburgh, PA | 2.0 | 1.0 | 1150 | $1,250 | $1.09 | 43d | 1 | 0.96mi |
| 1962 McNary Blvd Pittsburgh, PA | 3.0 | 1.0 | 1517 | $1,545 | $1.02 | 7d | 1 | 0.97mi |
| 251 Selvin Dr Verona, PA | 3.0 | 1.0 | 1320 | $1,295 | $0.98 | 3d | 1 | 1.04mi |
| 641 Penny Dr Pittsburgh, PA | 3.0 | 1.5 | 1199 | $1,525 | $1.27 | 14d | 1 | 1.06mi |
| 131 Jacob Dr Pittsburgh, PA | 3.0 | 1.0 | 1144 | $2,300 | $2.01 | 1d | 1 | 1.08mi |
| 273 Bramble St Verona, PA | 3.0 | 1.5 | 1076 | $1,720 | $1.60 | 4d | 1 | 1.10mi |
| 124 Dauntless Dr Pittsburgh, PA | 3.0 | 1.0 | 1100 | $1,395 | $1.27 | 23d | 1 | 1.13mi |
| 8075 Chaske St Verona, PA | 3.0 | 1.5 | 1092 | $1,425 | $1.30 | 7d | 1 | 1.17mi |
| 7534 Penn Bridge Ct Pittsburgh, PA | 2.0 | 2.0 | 1259 | $1,750 | $1.39 | 43d | 1 | 1.23mi |
| 1250 Blackadore Ave Pittsburgh, PA | 3.0 | 1.0 | 1440 | $1,750 | $1.22 | 23d | 1 | 1.28mi |
| 7215 Beacon Hill Dr Pittsburgh, PA | 2.0 | 2.0 | 1259 | $1,795 | $1.43 | 4d | 1 | 1.38mi |
| 11843 Joan Dr Pittsburgh, PA | 3.0 | 1.0 | 1144 | $1,500 | $1.31 | 4d | 1 | 1.45mi |
| 209 Briarwood Dr Pittsburgh, PA | 3.0 | 2.0 | 1080 | $1,500 | $1.39 | 23d | 1 | 1.46mi |
| 1526 Edwards St Verona, PA | 3.0 | 1.0 | 1296 | $1,730 | $1.33 | 43d | 1 | 1.46mi |
Listing history 21 events
-
2026-06-15days on market $125,000 Active 114 DOM
-
2026-06-13days on market $125,000 Active 112 DOM
-
2026-06-13days on market $125,000 Active 111 DOM
-
2026-06-09days on market $125,000 Active 108 DOM
-
2026-06-08days on market $125,000 Active 107 DOM
-
2026-06-07days on market $125,000 Active 106 DOM
-
2026-06-05days on market $125,000 Active 103 DOM
-
2026-06-03days on market $125,000 Active 102 DOM
-
2026-06-02days on market $125,000 Active 101 DOM
-
2026-06-01days on market $125,000 Active 100 DOM
-
2026-05-31days on market $125,000 Active 99 DOM
-
2026-04-28status Active 442-char remark
Show marketing remark (442 chars)
BACK ON MARKET, don't miss out of this spectacular 4-bedroom brick investment property sitting atop a hill within a lovely and highly sought-after Pittsburgh community! With some TLC, this home has the space and flexibility to be an amazing dream home or a great income-generating rental property! Whether you're investing in your future home or in your real estate portfolio, this gem of a house is a perfect fit! Schedule a tour asap!
-
2026-01-21status Pending 442-char remark
Show marketing remark (442 chars)
BACK ON MARKET, don't miss out of this spectacular 4-bedroom brick investment property sitting atop a hill within a lovely and highly sought-after Pittsburgh community! With some TLC, this home has the space and flexibility to be an amazing dream home or a great income-generating rental property! Whether you're investing in your future home or in your real estate portfolio, this gem of a house is a perfect fit! Schedule a tour asap!
-
2025-11-16$125,000 Active 442-char remark
Show marketing remark (442 chars)
BACK ON MARKET, don't miss out of this spectacular 4-bedroom brick investment property sitting atop a hill within a lovely and highly sought-after Pittsburgh community! With some TLC, this home has the space and flexibility to be an amazing dream home or a great income-generating rental property! Whether you're investing in your future home or in your real estate portfolio, this gem of a house is a perfect fit! Schedule a tour asap!
-
2011-08-11price $39,600 290-char remark
Show marketing remark (290 chars)
HUD owned property. AS-IS. Up to 3% buyer's agent commission. Case #442-203976. Offers submitted to www. hudhomestore.com. Managed by www. MMREM.com. Utilities are off. Nice corner lot. Integral + detached garages. Hardwood floors. Large attic room, could be 4th bedroom. Exclusive Agency.
-
2011-08-11soldstatus $37,001 290-char remark
Show marketing remark (290 chars)
HUD owned property. AS-IS. Up to 3% buyer's agent commission. Case #442-203976. Offers submitted to www. hudhomestore.com. Managed by www. MMREM.com. Utilities are off. Nice corner lot. Integral + detached garages. Hardwood floors. Large attic room, could be 4th bedroom. Exclusive Agency.
-
2010-11-03$37,001 290-char remark
Show marketing remark (290 chars)
HUD owned property. AS-IS. Up to 3% buyer's agent commission. Case #442-203976. Offers submitted to www. hudhomestore.com. Managed by www. MMREM.com. Utilities are off. Nice corner lot. Integral + detached garages. Hardwood floors. Large attic room, could be 4th bedroom. Exclusive Agency.
-
1999-08-18soldstatus $66,500
-
1999-07-23soldstatus $65,000
-
1998-10-07$69,500
-
1993-06-30soldstatus $55,000
ⓘ Source: listings_history table (triggers on properties + properties_extension) + one-shot
backfill from property_details.listing_events for pre-trigger history.
Tax reassessment forecast PA · Partial reset (capped growth)
- Current annual tax
- $4,403 · $367/mo
- Projected year-2 tax
- $4,403 · $367/mo
- Expected delta
- $0/yr ($0/mo · 0.0%)
ⓘ Screening estimate from a state-policy table — verify with the county assessor before closing.
Climate risk First Street
- Flood 1/10 Low FEMA zone X (unshaded) · 0% chance over 30 yrs
- Wildfire 1/10 Low
- Heat 3/10 Moderate 6 d/yr ≥96°F today · 14 d/yr by 30 yrs out
- Wind 2/10 Low
- Air quality 4/10 Moderate 5 unhealthy d/yr today · 7 by 30 yrs out
Nearby sold comps map
Loading sold comps map…
Walkable amenities ~0.75 mi
Loading nearby amenities…
Taxation est. · year 1
- Rental income
- $19,122
- − Mortgage interest
- −$7,002
- − Property taxes
- −$4,403
- − Insurance
- −$625
- − Repairs & maintenance
- −$1,530
- − Management
- −$1,530
- − Depreciation
- −$3,636
- Taxable income
- $396
- Est. tax owed @ 24.0%
- −$95
- After-tax cash flow
- $2,117/yr
For passive investors: Depreciation is non-cash, so a rental often shows a tax loss while cash-flowing — sheltering income. Rental losses are passive: they offset passive income freely, and up to $25,000/yr can offset ordinary (W-2) income if you actively participate and your MAGI is under $100k (phasing out to $0 by $150k); unused losses carry forward. On sale, claimed depreciation is recaptured at up to 25%, and gains may owe capital-gains tax (a 1031 exchange can defer both). Figures are a year-1 estimate at your 24.0% rate — not tax advice; consult a CPA.
Schools (NCES district)
- District
- Penn Hills SD
- NCES district ID
- 4218590
- Math proficiency
- 13% ▼ -6.00%
- Reading proficiency
- 24% ▼ -14.00%
- Median HH income
- $47,794
- Composite
- 16.42/100
- National rank
- #9192
- State rank
- #496 of 539 in PA
Livability — Wilkinsburg
- Score
- 76/100
- State rank
- #411
- US rank
- #3754
Category grades
Schools grade is shown separately in the Schools card above.
Census & demographics
- County
- Allegheny County · 1,022,028 people
- City population
- 29,513
- Metro
- Pittsburgh, PA
- Population (ZIP)
- 33,951
- Household income
- $67,240
- Rent vs Own
- Severe rent burden
- 955.0
Population outlook (Allegheny County) Hauer SSP2
- Today (2025)
- 1,250,282 people
- By 2030
- 1,256,482 · +0.5%
- By 2040
- 1,256,318 · +0.5%
- By 2050
- 1,244,169 · -0.5%
- By 2075
- 1,197,693 · -4.2%
- By 2100
- 1,093,187 · -12.6%
Race, ethnicity, and origin ACS 2023
- Neighborhood character
- Diverse neighborhood (Simpson 0.58)
- Race & ethnicity
- White 51% Black 40% Two or more races 7% Hispanic / Latino 2%
- Common ancestry
- Romanian 5% Serbian 2% Slovak 1%
- Foreign-born
- 4% · Canada
- Languages at home
- 97% English-only · Other Indo-European 1% Spanish 1%
Political lean MEDSL · Allegheny
- 2024 margin
- Strong D (+20.3) · D 59.7% · R 39.4%
- 2008→2024 swing
- +4.8pp toward D · 2008: 15.5pp · 2024: 20.3pp
- All cycles
- 2024: D+20.3 2020: D+20.4 2016: D+16.4 2012: D+14.4 2008: D+15.5
Not yet ingested
- Civics
- —
Market trends
- HPI YoY
- ▼ -121.68%
- Current HPI
- 235.4861
- Rent YoY
- ▲ 7.63%
- Metro
- Pittsburgh, PA
- State GDP YoY
- ▲ 1.68%
- F500 in state
- 34
Industry mix (Fortune 500 HQ in PA)
| Industry | F500 HQs | Revenue |
|---|---|---|
| Healthcare | 2 | $309B |
|
||
| Insurance | 2 | $27B |
|
||
| Telecommunications / Media | 1 | $124B |
|
||
| Industrial Distribution | 1 | $22B |
|
||
| Financial Services | 1 | $20B |
|
||
| Chemicals / Materials | 1 | $18B |
|
||
Price history
+127.3% since first listed10 events — show timeline
- 2026-04-28 Relisted — West Penn MLS
- 2026-01-21 Pending — West Penn MLS
- 2025-11-16 Listed $125,000 West Penn MLS
- 2011-08-11 Sold (MLS) $37,001 West Penn MLS
- 2011-08-11 Price Changed $39,600 West Penn MLS
- 2010-11-03 Listed $37,001 West Penn MLS
- 1999-08-18 Sold (Public Records) $66,500 Public Records
- 1999-07-23 Sold (MLS) $65,000 West Penn MLS
- 1998-10-07 Listed $69,500 West Penn MLS
- 1993-06-30 Sold (Public Records) $55,000 Public Records
Property tax history
+2.5%/yrLatest (2026): $4,403 · +0.0% YoY. Source: county tax records.
Cash-flow waterfall
monthlySold comps — $/sqft
last 12 mo · ≤1 miLoading sold comps…