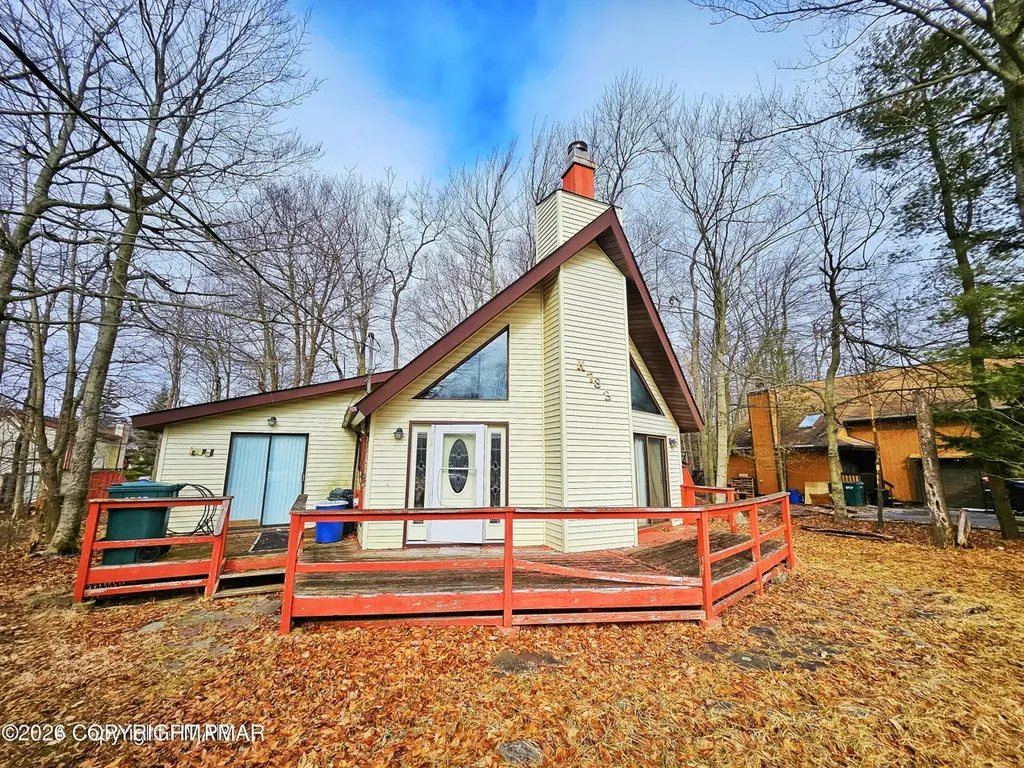
1769 Rolling Hills Dr · Pocono Springs, PA
Flood risk 1/10 · Minimal
- FEMA flood zone
- X (unshaded)
- Chance of flooding over 30 yrs
- 0.0%
- Est. flood insurance / yr
- $507 – $1,088
Fire risk 3/10 · Minor
- Est. fire insurance / yr
- $511 – $949
Heat risk 1/10 · Minimal
- Hot days now (above 89°F)
- 7 days/yr
- Hot days in 30 yrs
- 15 days/yr
Wind risk 4/10 · Minor
- Chance of severe wind over 30 yrs
- 8.0%
Air-quality risk 2/10 · Minimal
- Unhealthy air days now
- 1 days/yr
- Unhealthy air days in 30 yrs
- 2 days/yr
Risk factors via First Street. Map © Google.
Why this score? — see what drove the B grade
The composite is a weighted blend of 9 inputs, each scored 0–100. Each bar is that input's sub-score; the figure is the points it added to the 100-point composite (weight × sub-score).
- Cash flow +25.0/30.0
- ARV discount +15.0/15.0
- DSCR +8.2/10.0
- 1% rule +6.9/10.0
- Appreciation +6.2/10.0
- Schools +4.0/10.0
- Livability +3.7/5.0
- Rent growth +2.5/5.0
- Condition / age +2.5/5.0
$159,900
🖨 Deal sheet (PDF) 📄 Offer letter ✓ Due diligence
Listing remarks
Attention investors and savvy buyers! This 3-bedroom, 1.5-bath chalet-style single family home in the sought-after A Pocono Country Place community is your next value-add opportunity. At 1,267 sq ft on a level 0.22-acre lot, this property offers solid bones with cathedral ceilings, a fireplace, a deck, and a porch. The kind of charm that short-term rental buyers and vacation home seekers love in the Poconos. Bring your vision and your contractor. With the right updates, this home has strong upside potential in a community that offers amenities including an outdoor pool, clubhouse, security, and trash service
Key facts
- Outdoor pool
- Porch
- Cathedral ceilings
Tags
Property features AI
Finance
- Other: Subdivision: A Pocono Country Place
- Financial info: Property taxes listed (amount not included per instructions)
- HOA & community: Homeowners association with annual fee (includes trash); Community amenities: security, clubhouse, pool
Exterior
- Parking: Driveway with 2 open parking spaces
- Security: Community security (HOA amenity)
- Utilities: Public water; Sewer: Other; Electric with circuit breakers; Cable available
- Home design: Single family residential; No shared/common walls
- Construction: Brick construction; Asphalt roof; Crawl space basement; Built area above grade recorded
- Exterior features: Porch; Deck; Shed(s); Level lot; City street frontage; Public maintained road; Gravel and dirt road surface
Interior
- Kitchen: Electric range; Refrigerator; Water heater
- Bedrooms: 6 total rooms (bedroom count not specified)
- Flooring: Carpet; Vinyl
- Bathrooms: 1 full bathroom; 1 half bathroom
- Heating & cooling: Baseboard heating; Electric heating; Wall/window air conditioning unit(s)
- Interior features: Cathedral ceilings; Fireplace (1)
- Laundry & utility: No laundry appliance details provided
Neighborhood map
What this means for you Summary
Snapshot
- This is a 3-bed/1.5-bath single-family listed at $160k.
Deal economics
- At list price, monthly cash flow is $350 ($4k/yr) — positive.
- The deal already cash-flows at list — no discount required.
- Meets the 1% rule at list price ($2k rent vs $160k).
- Cap rate 8.9% vs local median 4.9% in Pocono Springs — top-decile yield for the area; either an underpriced asset or a hidden risk that comps aren't pricing in. Stress-test before assuming the spread holds.
Location & tenants
- Location reads 73/100 on livability (#560 in PA) — a middle-class / working-renter tenant base. Strengths: crime A+, employment A+, cost of living A+; Watch: schools F, amenities F, commute F.
- Pocono Mountain SD (rural): math 37% / reading 55% proficiency, ranked #245 of 539 in PA (top 46%) — families likely to look elsewhere, expect single-tenant / working-renter base with shorter leases.
- Market conditions: 355 active listings in the ZIP; 5 comparable units currently listed for rent nearby; rentals at typical pace (median 14d on market — plan ~3-4 weeks tenant-placement turnaround); 278 units permitted in Monroe County in 2024 (52 in 5+ unit buildings).
Forward outlook
- In year one you build about $5k of equity ($1k loan paydown + $4k appreciation (2.4% local appreciation)).
- Monroe County population projected at -11% by 2050 — secular population decline; favor cash flow + early exit over multi-decade hold.
- At projected returns (2.4% appreciation + 3.0% rent growth), your $45k cash investment doubles in ~5 years — after that, you're playing with house money.
- By year 7, paydown + projected appreciation supports a ~$31k cash-out refi (75% LTV) — recoverable capital for the next deal without selling this one.
Negotiation context
- Only 1 days on market — expect competitive offers; lowballing is unlikely to land.
- 3 sale attempts since 2y ago with the ask held roughly flat each time — persistent listings suggest the price (not the market) is what's stuck; bring a comps-based counter.
- Current owner paid $75k; list at $160k implies a 113% gain — meaningful room to come down on a strong offer.
Questions for the listing agent
- Built in 1977 — when were the roof, HVAC, electrical panel, plumbing, and water heater last replaced?
- What does the HOA fee cover, when was the last increase, and are there any pending special assessments or reserve-fund shortfalls?
- Is there a deadline driving the sale (1031 exchange, divorce, estate, relocation)? That informs how much negotiation room exists.
- Schools are F-rated, which usually means shorter tenancies and higher turnover. Who's the typical renter profile here, and what's been the actual vacancy rate?
- What's the average days-on-market for RENTAL listings here right now (not sales)? A rising rental-DOM trend means longer vacancies and softer asking-rent achievability than the comps imply.
- What's the recent tenant-quality profile in this submarket — average credit score on applications, eviction rate, late-payment / NSF rate, and stable-employment percentage? A property-management company in the area should have these aggregated.
- How much new for-sale + rental construction is in the pipeline within 1–3 miles? Heavy new supply typically softens prices + rents 12–24 months out; constrained supply supports both.
Investment metrics
- 1% rule
- 1.19% ✓
- Cap rate
- 8.92%
- Cash-on-cash
- 9.39%
- DSCR
- 1.42
- GRM
- 7.0
CMA / ARV
- ARV (on-the-fly)
- $250,866
- Comps found
- 12
Show comp detail 12 sales within ~0.75 mi
| Address | Dist | Beds/Ba | Sqft | Sold | Price | $/sf | Match |
|---|---|---|---|---|---|---|---|
| 1781 Rolling Hills Dr | 0.08mi | 4/2.0 (+1) | 1,224 (-3%) | 2mo | $306,500 | $250 | 82 |
| 1789 Rolling Hills Dr | 0.14mi | 3/2.0 | 1,200 (-5%) | 6mo | $285,000 | $238 | 78 |
| 1654 Sunnyside Dr | 0.31mi | 3/2.0 | 1,232 (-3%) | 6mo | $170,000 | $138 | 74 |
| 1905 Horseshoe Bnd | 0.25mi | 3/2.0 | 1,222 (-4%) | 10mo | $230,000 | $188 | 72 |
| 1900 Horseshoe Bnd | 0.21mi | 3/1.5 | 1,149 (-9%) | 9mo | $225,000 | $196 | 68 |
| 1066 Knollwood Dr | 0.34mi | 3/2.0 | 1,350 (+7%) | 6mo | $335,000 | $248 | 66 |
| 1452 Waterfront Dr | 0.23mi | 3/2.0 | 1,362 (+8%) | 10mo | $228,000 | $167 | 66 |
| 1125 Knollwood Dr | 0.12mi | 3/1.0 | 1,124 (-11%) | 9mo | $223,000 | $198 | 66 |
| 2834 Fairhaven Dr | 0.30mi | 3/2.0 | 1,416 (+12%) | 3mo | $255,000 | $180 | 62 |
| 2714 Starlight Ter | 0.54mi | 3/2.0 | 1,400 (+10%) | 7mo | $290,000 | $207 | 49 |
| 1517 Black Birch Way | 0.61mi | 2/2.0 (-1) | 1,176 (-7%) | 11mo | $245,000 | $208 | 43 |
| 1031 Knollwood Dr | 0.56mi | 3/2.0 | 1,100 (-13%) | 9mo | $146,000 | $133 | 43 |
Match score weights: distance 35% · size 25% · config 20% · recency 20%. Top-matched comps best support the ARV.
Projected returns pro-forma
2.36% appreciation · 3.0% rent growth · sell at horizon
- IRR
- 14.7%
- Equity multiple
- 1.81×
- Total profit
- $36,266
- Equity at exit
- $66,178
- IRR
- 17.0%
- Equity multiple
- 3.34×
- Total profit
- $104,801
- Equity at exit
- $97,745
Cash invested: $44,772 (down + closing). Projections, not guarantees.
Landlord ↔ Tenant lean methodology
- Overall (STATE)
- 62 Landlord-Friendly
- State Pennsylvania
- 62 Landlord-Friendly · EVEN
- County
- — inherits STATE
- City
- — inherits STATE
ZIP-level market 18466
- Home prices YoY
- 1.2%
- Active inventory
- 355
- Price-to-rent
- 7.0×
Monthly cashflow live
- Estimated rent
- $1,911 high interval (Pro) →
- Mortgage (P&I)
- −$839
- Tax from tax record
- −$121 /mo · $1,450/yr
- Insurance
- −$67
- HOA
- −$133
- Vacancy / Maint / Mgmt
- −$401
- Net cashflow
- $350
Break-even live
Sensitivity live
| Price | -10% $441 | -5% $396 | +0% $350 | +5% $305 | +10% $260 |
|---|---|---|---|---|---|
| Rent | -10% $199 | -5% $275 | +0% $350 | +5% $426 | +10% $501 |
| Rate | -1.0pp $431 | -0.5pp $391 | base $350 | +0.5pp $309 | +1.0pp $267 |
UW: 25.0% down · 7.5% · 30yr · 1.5% tax · 5.0% vac · 8.0% maint · 8.0% mgmt
Financing live
Cash to close
- Down payment
- $39,975
- Closing costs
- $4,797
- Reserves months
- —
- Total cash needed
- —
Loan-product check · same deal, 3 products live
Conventional
25% down · 7.5% · 30yr
- Down + closing
- —
- Monthly P&I
- —
- Monthly cashflow
- —
- DSCR
- —
- Eligible?
- —
Personal DTI + credit; lowest rate.
DSCR
20% down · 8.5% · 30yr
- Down + closing
- —
- Monthly P&I
- —
- Monthly cashflow
- —
- DSCR
- —
- Eligible?
- —
No personal income docs; deal must DSCR.
Hard money
10% down · 12.0% · 12mo
- Down + closing
- —
- Monthly P&I
- —
- Monthly cashflow
- —
- DSCR
- —
- Eligible?
- —
Short-term bridge; refi at stabilization.
Rent comps 5 comps
| Address | Beds | Baths | Sqft | Rent | $/sqft | DOM | Units | Dist |
|---|---|---|---|---|---|---|---|---|
| 1763 Rolling Hills Dr Tobyhanna, PA | 3.0 | 1.5 | 1008 | $1,800 | $1.79 | 8d | 1 | 0.07mi |
| 2846 Fairhaven Dr Tobyhanna, PA | 3.0 | 2.0 | 1024 | $1,950 | $1.90 | 14d | 1 | 0.35mi |
| 1354 Winding Way Coolbaugh Township, PA | 4.0 | 3.0 | 1870 | $2,100 | $1.12 | 21d | 1 | 0.44mi |
| 9149 Brandywine Dr Tobyhanna, PA | 4.0 | 3.0 | 1870 | $2,100 | $1.12 | 21d | 1 | 0.79mi |
| 9026 Idlewild Dr Tobyhanna, PA | 3.0 | 2.0 | 1068 | $2,300 | $2.15 | 14d | 1 | 0.97mi |
HOA detail
- Monthly dues
- $133 · $1,596/yr
- Likely covers
- trashpoolsecurity
Listing history 2 events
-
2026-06-18remarks 615-char remark
-
2026-06-18$159,900 Active 1 DOM
ⓘ Source: listings_history table (triggers on properties + properties_extension) + one-shot
backfill from property_details.listing_events for pre-trigger history.
Tax reassessment forecast PA · Partial reset (capped growth)
- Current annual tax
- $1,450 · $121/mo
- Projected year-2 tax
- $1,988 · $166/mo
- Expected delta
- +$538/yr (+$45/mo · 37.1%)
ⓘ Screening estimate from a state-policy table — verify with the county assessor before closing.
Climate risk First Street
- Flood 1/10 Low FEMA zone X (unshaded) · 0% chance over 30 yrs
- Wildfire 3/10 Moderate
- Heat 1/10 Low 7 d/yr ≥89°F today · 15 d/yr by 30 yrs out
- Wind 4/10 Moderate 8% chance of damaging wind over 30 yrs
- Air quality 2/10 Low 1 unhealthy d/yr today · 2 by 30 yrs out
Nearby sold comps map
Loading sold comps map…
Walkable amenities ~0.75 mi
Loading nearby amenities…
Taxation est. · year 1
- Rental income
- $22,928
- − Mortgage interest
- −$8,957
- − Property taxes
- −$1,450
- − Insurance
- −$800
- − Repairs & maintenance
- −$1,834
- − Management
- −$1,834
- − HOA
- −$1,596
- − Depreciation
- −$4,652
- Taxable income
- $1,805
- Est. tax owed @ 24.0%
- −$433
- After-tax cash flow
- $3,772/yr
For passive investors: Depreciation is non-cash, so a rental often shows a tax loss while cash-flowing — sheltering income. Rental losses are passive: they offset passive income freely, and up to $25,000/yr can offset ordinary (W-2) income if you actively participate and your MAGI is under $100k (phasing out to $0 by $150k); unused losses carry forward. On sale, claimed depreciation is recaptured at up to 25%, and gains may owe capital-gains tax (a 1031 exchange can defer both). Figures are a year-1 estimate at your 24.0% rate — not tax advice; consult a CPA.
Schools (NCES district)
- District
- Pocono Mountain SD
- NCES district ID
- 4219500
- Math proficiency
- 37% ▼ -5.00%
- Reading proficiency
- 55% ▲ 1.00%
- Median HH income
- $55,317
- Composite
- 39.91/100
- National rank
- #3856
- State rank
- #245 of 539 in PA
Livability — Pocono Springs
- Score
- 73/100
- State rank
- #560
- US rank
- #5263
Category grades
Schools grade is shown separately in the Schools card above.
Census & demographics
- Population (ZIP)
- 17,997
Population outlook (Monroe County) Hauer SSP2
- Today (2025)
- 164,099 people
- By 2030
- 161,412 · -1.6%
- By 2040
- 154,616 · -5.8%
- By 2050
- 146,710 · -10.6%
- By 2075
- 140,830 · -14.2%
- By 2100
- 138,472 · -15.6%
Race, ethnicity, and origin ACS 2023
- Neighborhood character
- Highly diverse neighborhood (Simpson 0.72)
- Race & ethnicity
- White 38% Hispanic / Latino 27% Black 24% Two or more races 17% Asian 4%
- Hispanic origin (detail)
- Puerto Rican 12% Dominican 6%
- Common ancestry
- Romanian 2% Portuguese 1% German 1%
- Foreign-born
- 16% · Canada
- Languages at home
- 77% English-only · Spanish 17% Other Indo-European 2% Russian/Polish/Slavic 1%
Political lean MEDSL · Monroe
- 2024 margin
- Toss-up / Even · D 49.1% · R 49.9%
- 2008→2024 swing
- -17.1pp toward R · 2008: 16.3pp · 2024: -0.8pp
- All cycles
- 2024: R+0.8 2020: D+6.4 2016: D+0.3 2012: D+14.0 2008: D+16.3
Not yet ingested
- Civics
- —
Market trends
- HPI YoY
- ▲ 2.36%
- Current HPI
- 202.4134
- Rent YoY
- —
- Metro
- —
- State GDP YoY
- ▲ 1.68%
- F500 in state
- 34
Industry mix (Fortune 500 HQ in PA)
| Industry | F500 HQs | Revenue |
|---|---|---|
| Healthcare | 2 | $309B |
|
||
| Insurance | 2 | $27B |
|
||
| Telecommunications / Media | 1 | $124B |
|
||
| Industrial Distribution | 1 | $22B |
|
||
| Financial Services | 1 | $20B |
|
||
| Chemicals / Materials | 1 | $18B |
|
||
Price history
+162.1% since first listed9 events — show timeline
- 2026-06-18 Listed $159,900 PMAR
- 2025-06-06 Pending — GLVRMLS
- 2024-11-18 Pending — PMAR
- 2024-06-11 Pending — GLVRMLS
- 2024-05-05 Listing Removed — GLVRMLS
- 2024-02-12 Listed $159,900 PMAR
- 2024-02-12 Listed $159,900 GLVRMLS
- 2002-12-12 Sold (Public Records) $74,900 Public Records
- 2001-09-28 Sold (Public Records) $61,000 Public Records
Property tax history
-7.1%/yrLatest (2026): $1,450 · +3.2% YoY. Source: county tax records.
Cash-flow waterfall
monthlySold comps — $/sqft
last 12 mo · ≤1 miLoading sold comps…