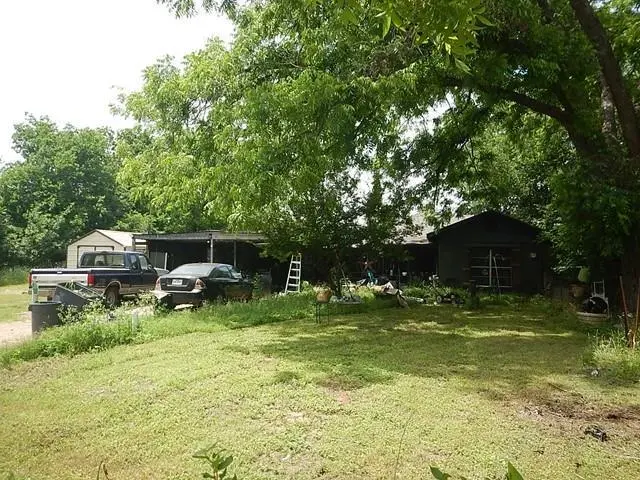
319 Church Ave · Waco, TX
Flood risk 1/10 · Minimal
- FEMA flood zone
- X (unshaded)
- Chance of flooding over 30 yrs
- 0.0%
- Est. flood insurance / yr
- $507 – $1,088
Fire risk 5/10 · Moderate
- Est. fire insurance / yr
- $1,222 – $2,270
Heat risk 8/10 · Major
- Hot days now (above 109°F)
- 7 days/yr
- Hot days in 30 yrs
- 25 days/yr
Wind risk 6/10 · Moderate
- Chance of severe wind over 30 yrs
- 61.0%
Air-quality risk 1/10 · Minimal
- Unhealthy air days now
- 0 days/yr
- Unhealthy air days in 30 yrs
- 0 days/yr
Risk factors via First Street. Map © Google.
Why this score? — see what drove the B- grade
The composite is a weighted blend of 9 inputs, each scored 0–100. Each bar is that input's sub-score; the figure is the points it added to the 100-point composite (weight × sub-score).
- Cash flow +29.4/30.0
- DSCR +10.0/10.0
- 1% rule +8.3/10.0
- ARV discount +7.5/15.0
- Livability +3.7/5.0
- Rent growth +3.0/5.0
- Condition / age +2.5/5.0
- Schools +1.8/10.0
- Appreciation +0.0/10.0
$139,900
🖨 Deal sheet (PDF) 📄 Offer letter ✓ Due diligence
Listing remarks
All investors welcome, come see this home today. It's a 3 bedroom 2 full bathrooms just over 1600 sqft and is located by S 4th and Church St.
Key facts
- 0.34 acre lot
- Garage
- Built 1950
Property features AI
Finance
- Other: Parcel number: 175532
- Financial info: Loan type marked 'Treat As Clear'; No second mortgage
- HOA & community: No association
Exterior
- Parking: 2 covered/carport spaces (gravel surface); Has garage (attached) — listed garage spaces: 0
- Utilities: Municipal utility district: No
- Home design: Single-family residence; Residential property; Attached property; One story
- Construction: Built in 1950
- Exterior features: Asphalt utilities/drive surface; Lot under 0.5 acre (approximately 0.3444 acre); Subdivision: GURLEY D R TR
Interior
- Kitchen: No appliances listed
- Bedrooms: 3 bedrooms (primary bedroom on level 1)
- Bathrooms: 2 full bathrooms
- Interior features: Cable TV available; One living area; One dining area; Total rooms: 3
- Laundry & utility: No laundry/utility appliances listed
Neighborhood map
What this means for you Summary
Snapshot
- This is a 3-bed/2.0-bath single-family listed at $140k.
Deal economics
- At list price, monthly cash flow is $494 ($6k/yr) — positive.
- The deal already cash-flows at list — no discount required.
- Meets the 1% rule at list price ($2k rent vs $140k).
- Cap rate 10.5% vs local median 3.9% in Waco — top-decile yield for the area; either an underpriced asset or a hidden risk that comps aren't pricing in. Stress-test before assuming the spread holds.
Location & tenants
- Location reads 74/100 on livability (#166 in TX, #4,378 nationally) — a middle-class / working-renter tenant base. Strengths: cost of living A+, housing A+, health & safety A+; Watch: crime D, commute F, employment D-.
- Waco ISD (urban): math 20% / reading 24% proficiency, ranked #773 of 826 in TX (top 94%) — low school quality limits family demand, transient renter base, plan for 1-2y turnover; 81% free/reduced lunch — lower-income household profile, screen leases tightly.
- Zoned schools: South Waco El (math 8% / reading 22%, grade F, #4,021 of 4,322 statewide, top 94%, 462 students, 96% FRL); Cesar Chavez Middle (math 16% / reading 24%, grade F, #1,428 of 1,662 statewide, top 87%, 840 students, 94% FRL); University H S (math 39% / reading 31%, grade F, #954 of 1,632 statewide, top 59%, 1,678 students, 89% FRL).
- Market conditions: Rents rising (+1.9%/yr); 318 active listings in the ZIP; 36 comparable units currently listed for rent nearby; rentals at typical pace (median 24d on market — plan ~3-4 weeks tenant-placement turnaround); lower-income renter base — watch delinquency; 1,014 units permitted in McLennan County in 2024 (200 in 5+ unit buildings).
- At $1,858/mo this rent would consume 54% of the median local household income ($42k/yr) (locally 3883% of renters already pay >50% of income on rent) — very limited rent-growth headroom before tenants either downsize or default.
Forward outlook
- Local home prices are declining (-3.0%/yr); year-one equity from $967 of loan paydown is wiped out by about $4k of value loss. Plan a longer hold.
- McLennan County population projected at +17% by 2050 — long-run rental-demand tailwind backs the buy-and-hold thesis.
- At projected returns (-3.0% appreciation + 1.9% rent growth), your $39k cash investment doubles in ~9 years — after that, you're playing with house money.
Negotiation context
- Only 11 days on market — expect competitive offers; lowballing is unlikely to land.
Risks & watch-outs
- Watch-outs: built in 1950 — expect roof / HVAC / electrical / plumbing capex.
- Climate carrying-cost: major wind risk, 61% chance of damaging wind over 30y; moderate wildfire risk; extreme-heat days projected 7→25/yr by 2055 (HVAC capex compounding) — expect insurance premiums to compound above CPI over the hold.
Questions for the listing agent
- Built in 1950 — when were the roof, HVAC, electrical panel, plumbing, and water heater last replaced?
- Is there a deadline driving the sale (1031 exchange, divorce, estate, relocation)? That informs how much negotiation room exists.
- Schools are D-rated, which usually means shorter tenancies and higher turnover. Who's the typical renter profile here, and what's been the actual vacancy rate?
- Crime grade is D in this area — have there been break-ins, vandalism, or insurance claims at this property in the last 3 years? What carrier currently insures it and at what premium?
- What's the average days-on-market for RENTAL listings here right now (not sales)? A rising rental-DOM trend means longer vacancies and softer asking-rent achievability than the comps imply.
- What's the recent tenant-quality profile in this submarket — average credit score on applications, eviction rate, late-payment / NSF rate, and stable-employment percentage? A property-management company in the area should have these aggregated.
- How much new for-sale + rental construction is in the pipeline within 1–3 miles? Heavy new supply typically softens prices + rents 12–24 months out; constrained supply supports both.
Investment metrics
- 1% rule
- 1.33% ✓
- Cap rate
- 10.53%
- Cash-on-cash
- 15.14%
- DSCR
- 1.67
- GRM
- 6.3
CMA / ARV
- ARV (on-the-fly)
- $409,356
- Comps found
- 12
Show comp detail 12 sales within ~0.75 mi
| Address | Dist | Beds/Ba | Sqft | Sold | Price | $/sf | Match |
|---|---|---|---|---|---|---|---|
| 916 Church Ave | 0.39mi | 3/2.0 | 1,478 (-10%) | 1mo | $254,900 | $172 | 64 |
| 912 Church Ave | 0.38mi | 3/2.0 | 1,448 (-12%) | 1mo | $254,900 | $176 | 62 |
| 908 Church Ave | 0.37mi | 3/2.0 | 1,448 (-12%) | 1mo | $254,900 | $176 | 62 |
| 904 Gurley Ln | 0.41mi | 3/2.0 | 1,448 (-12%) | 3mo | $187,000 | $129 | 59 |
| 945 Holt Ave | 0.47mi | 3/2.0 | 1,448 (-12%) | 5mo | $254,900 | $176 | 54 |
| 2916 S 3rd St | 0.14mi | 4/4.5 (+1) | 1,747 (+6%) | 17mo | $465,000 | $266 | 54 |
| 2103 S 7th St | 0.73mi | 4/2.0 (+1) | 1,622 (-1%) | 6mo | $445,000 | $274 | 53 |
| 2304 S 2nd St | 0.47mi | 4/4.0 (+1) | 1,728 (+5%) | 8mo | $435,000 | $252 | 50 |
| 2228 S 2nd St | 0.49mi | 4/4.0 (+1) | 1,728 (+5%) | 8mo | $429,900 | $249 | 49 |
| 2124 S 4th St | 0.54mi | 4/2.0 (+1) | 1,763 (+7%) | 11mo | $325,000 | $184 | 49 |
| 2300 S 2nd St | 0.47mi | 4/4.0 (+1) | 1,728 (+5%) | 17mo | $445,000 | $258 | 42 |
| 2225 S 2nd St | 0.46mi | 4/4.5 (+1) | 1,858 (+13%) | 1mo | $510,000 | $274 | 41 |
Match score weights: distance 35% · size 25% · config 20% · recency 20%. Top-matched comps best support the ARV.
Projected returns pro-forma
-3.0% appreciation · 1.86% rent growth · sell at horizon
- IRR
- 4.5%
- Equity multiple
- 1.17×
- Total profit
- $6,733
- Equity at exit
- $20,860
- IRR
- 12.9%
- Equity multiple
- 1.97×
- Total profit
- $38,076
- Equity at exit
- $12,096
Cash invested: $39,172 (down + closing). Projections, not guarantees.
Landlord ↔ Tenant lean methodology
- Overall (STATE)
- 87 Strongly Landlord-Friendly
- State Texas
- 87 Strongly Landlord-Friendly · R+5
- County
- — inherits STATE
- City
- — inherits STATE
ZIP-level market 76706
- Home prices YoY
- -29.1%
- Rents YoY
- 1.9%
- Active inventory
- 318
- Price-to-rent
- 6.3×
Monthly cashflow live
- Estimated rent
- $1,858 high interval (Pro) →
- Mortgage (P&I)
- −$734
- Tax from tax record
- −$182 /mo · $2,179/yr
- Insurance
- −$58
- HOA
- −$0
- Lot rent
- −$0
- Vacancy / Maint / Mgmt
- −$390
- Net cashflow
- $494
Break-even live
Sensitivity live
| Price | -10% $573 | -5% $534 | +0% $494 | +5% $455 | +10% $415 |
|---|---|---|---|---|---|
| Rent | -10% $347 | -5% $421 | +0% $494 | +5% $568 | +10% $641 |
| Rate | -1.0pp $565 | -0.5pp $530 | base $494 | +0.5pp $458 | +1.0pp $421 |
UW: 25.0% down · 7.5% · 30yr · 1.5% tax · 5.0% vac · 8.0% maint · 8.0% mgmt
Financing live
Cash to close
- Down payment
- $34,975
- Closing costs
- $4,197
- Reserves months
- —
- Total cash needed
- —
Loan-product check · same deal, 3 products live
Conventional
25% down · 7.5% · 30yr
- Down + closing
- —
- Monthly P&I
- —
- Monthly cashflow
- —
- DSCR
- —
- Eligible?
- —
Personal DTI + credit; lowest rate.
DSCR
20% down · 8.5% · 30yr
- Down + closing
- —
- Monthly P&I
- —
- Monthly cashflow
- —
- DSCR
- —
- Eligible?
- —
No personal income docs; deal must DSCR.
Hard money
10% down · 12.0% · 12mo
- Down + closing
- —
- Monthly P&I
- —
- Monthly cashflow
- —
- DSCR
- —
- Eligible?
- —
Short-term bridge; refi at stabilization.
Rent comps 36 comps
| Address | Beds | Baths | Sqft | Rent | $/sqft | DOM | Units | Dist |
|---|---|---|---|---|---|---|---|---|
| 2539 Pascal Ct Unit B Waco, TX | 3.0 | 3.5 | 1350 | $1,950 | $1.44 | 23d | 1 | 0.14mi |
| 2430 S 2nd St Waco, TX | 1.0–5.0 | 1.0–5.5 | 1400 | $1,625 | $1.16 | 15d | 1 | 0.31mi |
| 2825 S University Parks Dr Waco, TX | 1.0–4.0 | 1.0–4.0 | 1121 | $1,228 | $1.10 | 15d | 8 | 0.38mi |
| 2410 S 2nd St Waco, TX | 2.0–5.0 | 2.0–5.5 | 1552 | $2,008 | $1.29 | 23d | 4 | 0.39mi |
| 2308 S 3rd St Unit B Waco, TX | 2.0 | 2.0 | 1130 | $1,350 | $1.19 | 15d | 1 | 0.40mi |
| 2415 S University Parks Dr Waco, TX | 1.0–4.0 | 1.0–4.0 | 1095 | $2,120 | $1.94 | 15d | 27 | 0.46mi |
| 331 French Ave Waco, TX | 4.0 | 4.0 | 1776 | $2,600 | $1.46 | 23d | 1 | 0.63mi |
| 323 French Ave Waco, TX | 4.0 | 4.0 | 1770 | $1,900 | $1.07 | 46d | 1 | 0.63mi |
| 416 Daughtrey Ave Waco, TX | 4.0 | 4.0 | 1680 | $2,500 | $1.49 | 23d | 1 | 0.73mi |
| 2000 S 1st St Waco, TX | 2.0–5.0 | 1.0–3.0 | 1318 | $1,465 | $1.11 | 15d | 19 | 0.73mi |
| 2011 S 7th St Unit 6B Waco, TX | 3.0 | 3.0 | 1478 | $2,150 | $1.45 | 46d | 1 | 0.73mi |
| 2011 S 7th St Waco, TX | 3.0 | 3.0 | 1484 | $1,800 | $1.21 | 23d | 1 | 0.74mi |
| 66 Daughtrey Ave Waco, TX | 1.0–2.0 | 1.0–2.0 | 825 | $1,715 | $2.08 | 15d | 1 | 0.82mi |
| 1918 S 8th St Waco, TX | 3.0 | 2.0 | 1061 | $1,200 | $1.13 | 23d | 1 | 0.82mi |
| 600 Bagby Ave Waco, TX | 2.0 | 2.0–2.5 | 1102 | $1,496 | $1.36 | 23d | 2 | 0.89mi |
| 600 Bagby Ave Waco, TX | 2.0–3.0 | 2.5 | 1206 | $1,795 | $1.49 | 46d | 3 | 0.89mi |
| 1628 Ewing Ave Waco, TX | 3.0 | 2.0 | 1472 | $2,400 | $1.63 | 15d | 1 | 0.96mi |
| 1304 Elise Ave Waco, TX | 3.0 | 2.0 | 1434 | $2,295 | $1.60 | 23d | 1 | 1.03mi |
| 909 Placid Cir Waco, TX | 3.0 | 2.0 | 1415 | $3,150 | $2.23 | 23d | 1 | 1.08mi |
| 1909 S 14th St Waco, TX | 4.0 | 4.0 | 1680 | $1,600 | $0.95 | 23d | 1 | 1.10mi |
| 1226 Bagby Ave Waco, TX | 4.0 | 2.0 | 2240 | $1,875 | $0.84 | 23d | 1 | 1.10mi |
| 1916 S 15th St Waco, TX | 4.0 | 4.0 | 1744 | $1,800 | $1.03 | 15d | 1 | 1.10mi |
| 1916 S 15th St Unit A Waco, TX | 4.0 | 4.0 | 1744 | $1,800 | $1.03 | 23d | 1 | 1.10mi |
| 1909 S 14th St Unit B Waco, TX | 4.0 | 4.0 | 1680 | $1,650 | $0.98 | 46d | 1 | 1.10mi |
| 1905 S 14th St Unit B Waco, TX | 4.0 | 4.0 | 1200 | $550 | $0.46 | 23d | 1 | 1.11mi |
| 1905 S 14th St Waco, TX | 4.0 | 4.0 | 1500 | $3,000 | $2.00 | 23d | 1 | 1.11mi |
| 1912 S 15th St Unit A Waco, TX | 4.0 | 2.0 | 1400 | $1,850 | $1.32 | 23d | 1 | 1.12mi |
| 1800 Primrose Dr Waco, TX | 1.0–4.0 | 1.0–2.0 | 942 | $1,133 | $1.20 | 15d | 33 | 1.19mi |
| 1925 S 17th St Unit 1 Waco, TX | 4.0 | 4.0 | 1856 | $2,100 | $1.13 | 23d | 1 | 1.25mi |
| 1606 Bagby Ave Waco, TX | 4.0 | 2.0 | 1900 | $2,400 | $1.26 | 23d | 1 | 1.27mi |
| 1311 Speight Ave #1311 Waco, TX | 2.0 | 2.5 | 1143 | $1,500 | $1.31 | 23d | 1 | 1.27mi |
| 1311 Speight Ave Waco, TX | 2.0 | 2.5 | 1143 | $1,195 | $1.05 | 15d | 1 | 1.28mi |
| 1326 Park Ave Waco, TX | 2.0 | 2.5 | 1143 | $1,400 | $1.22 | 23d | 1 | 1.32mi |
| 1326 Park Ave Waco, TX | 2.0 | 2.5 | 1143 | $1,400 | $1.22 | 15d | 1 | 1.32mi |
| 1342 Park Ave Waco, TX | 2.0 | 2.5 | 1143 | $1,400 | $1.22 | 15d | 1 | 1.32mi |
| 1300 S 11th St Waco, TX | 2.0 | 2.5 | 1083 | $1,209 | $1.12 | 15d | 14 | 1.33mi |
Listing history 8 events
-
2026-06-21days on market $139,900 Active 11 DOM
-
2026-06-18days on market $139,900 Active 8 DOM
-
2026-06-17days on market $139,900 Active 7 DOM
-
2026-06-16days on market $139,900 Active 6 DOM
-
2026-06-15days on market $139,900 Active 5 DOM
-
2026-06-14days on market $139,900 Active 3 DOM
-
2026-06-13remarks 141-char remark
-
2026-06-13$139,900 Active 2 DOM
ⓘ Source: listings_history table (triggers on properties + properties_extension) + one-shot
backfill from property_details.listing_events for pre-trigger history.
Tax reassessment forecast TX · Resets to sale price
- Current annual tax
- $2,179 · $182/mo
- Projected year-2 tax
- $2,560 · $213/mo
- Expected delta
- +$381/yr (+$32/mo · 17.5%)
ⓘ Screening estimate from a state-policy table — verify with the county assessor before closing.
Climate risk First Street
- Flood 1/10 Low FEMA zone X (unshaded) · 0% chance over 30 yrs
- Wildfire 5/10 Major
- Heat 8/10 Severe 7 d/yr ≥109°F today · 25 d/yr by 30 yrs out
- Wind 6/10 Major 61% chance of damaging wind over 30 yrs
- Air quality 1/10 Low 0 unhealthy d/yr today · 0 by 30 yrs out
Nearby sold comps map
Loading sold comps map…
Walkable amenities ~0.75 mi
Loading nearby amenities…
Taxation est. · year 1
- Rental income
- $22,295
- − Mortgage interest
- −$7,837
- − Property taxes
- −$2,179
- − Insurance
- −$700
- − Repairs & maintenance
- −$1,784
- − Management
- −$1,784
- − Depreciation
- −$4,070
- Taxable income
- $3,943
- Est. tax owed @ 24.0%
- −$946
- After-tax cash flow
- $4,985/yr
For passive investors: Depreciation is non-cash, so a rental often shows a tax loss while cash-flowing — sheltering income. Rental losses are passive: they offset passive income freely, and up to $25,000/yr can offset ordinary (W-2) income if you actively participate and your MAGI is under $100k (phasing out to $0 by $150k); unused losses carry forward. On sale, claimed depreciation is recaptured at up to 25%, and gains may owe capital-gains tax (a 1031 exchange can defer both). Figures are a year-1 estimate at your 24.0% rate — not tax advice; consult a CPA.
Schools (NCES district)
- District
- Waco ISD
- NCES district ID
- 4844280
- Math proficiency
- 20% ▼ -14.00%
- Reading proficiency
- 24% ▼ -6.00%
- Median HH income
- $29,208
- Composite
- 17.57/100
- National rank
- #9043
- State rank
- #773 of 826 in TX
Livability — Waco
- Score
- 74/100
- State rank
- #166
- US rank
- #4378
Category grades
Schools grade is shown separately in the Schools card above.
Census & demographics
- Census place
- Waco, TX
- County
- McLennan County · 213,088 people
- City population
- 125,319
- Metro
- Waco, TX
- Population (ZIP)
- 41,627
- Household income
- $41,656
- Rent vs Own
- Severe rent burden
- 3883.0
Population outlook (McLennan County) Hauer SSP2
- Today (2025)
- 264,191 people
- By 2030
- 273,578 · +3.6%
- By 2040
- 291,506 · +10.3%
- By 2050
- 308,044 · +16.6%
- By 2075
- 349,648 · +32.3%
- By 2100
- 364,779 · +38.1%
Race, ethnicity, and origin ACS 2023
- Neighborhood character
- Diverse neighborhood (Simpson 0.64)
- Race & ethnicity
- White 49% Hispanic / Latino 31% Two or more races 17% Black 15% Asian 3%
- Hispanic origin (detail)
- Mexican 29%
- Common ancestry
- Lithuanian 1% Iranian 1% Romanian 1%
- Foreign-born
- 9% · Canada, Vietnam, China
- Languages at home
- 78% English-only · Spanish 19% Other Indo-European 1%
Political lean MEDSL · McLennan
- 2024 margin
- Solid R (+30.9) · D 34.0% · R 64.9% · Other 1.0%
- 2008→2024 swing
- -7.0pp toward R · 2008: -23.9pp · 2024: -30.9pp
- All cycles
- 2024: R+30.9 2020: R+23.4 2016: R+27.1 2012: R+29.8 2008: R+23.9
Not yet ingested
- Civics
- —
Market trends
- HPI YoY
- ▼ -94.31%
- Current HPI
- 230.2557
- Rent YoY
- ▲ 1.86%
- Metro
- Waco, TX
- State GDP YoY
- ▲ 3.95%
- F500 in state
- 110
Industry mix (Fortune 500 HQ in TX)
| Industry | F500 HQs | Revenue |
|---|---|---|
| Energy | 16 | $1,198B |
|
||
| Technology | 5 | $198B |
|
||
| Engineering / Construction | 4 | $72B |
|
||
| Energy Services | 3 | $60B |
|
||
| Utilities | 3 | $41B |
|
||
| Healthcare | 2 | $330B |
|
||
Price history
2 events — show timeline
- 2026-06-11 Listed $139,900 NTREIS
- 1992-05-20 Sold (Public Records) — Public Records
Property tax history
+7.8%/yrLatest (2025): $2,179 · +9.6% YoY. Source: county tax records.
Cash-flow waterfall
monthlySold comps — $/sqft
last 12 mo · ≤1 miLoading sold comps…