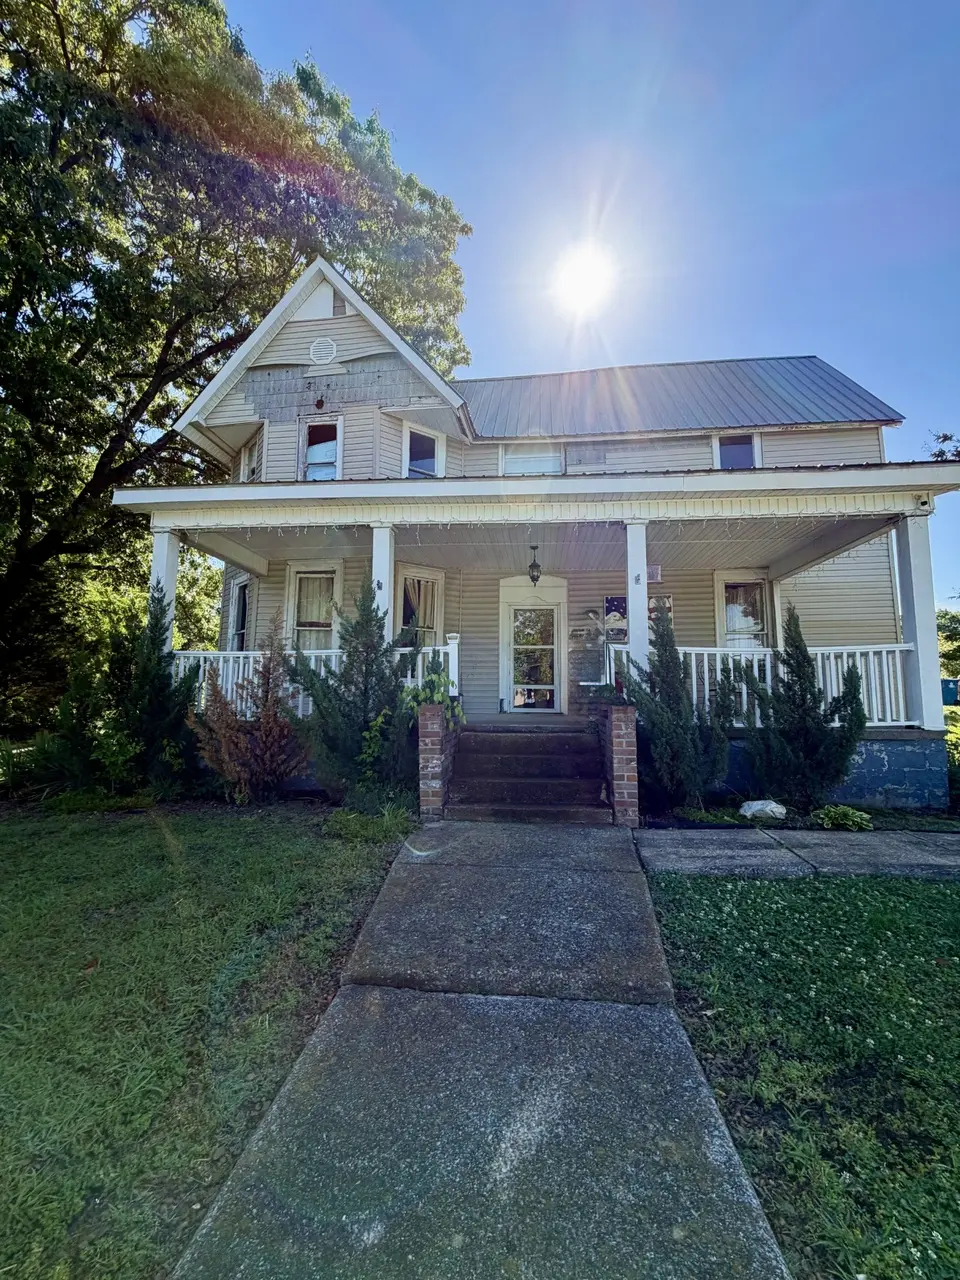
115 Cherry St · Camden, TN
Flood risk 1/10 · Minimal
- FEMA flood zone
- X (unshaded)
- Chance of flooding over 30 yrs
- 0.0%
- Est. flood insurance / yr
- $507 – $1,088
Fire risk 5/10 · Moderate
- Est. fire insurance / yr
- $949 – $1,763
Heat risk 5/10 · Moderate
- Hot days now (above 108°F)
- 7 days/yr
- Hot days in 30 yrs
- 20 days/yr
Wind risk 4/10 · Minor
- Chance of severe wind over 30 yrs
- 11.0%
Air-quality risk 2/10 · Minimal
- Unhealthy air days now
- 0 days/yr
- Unhealthy air days in 30 yrs
- 1 days/yr
Risk factors via First Street. Map © Google.
Why this score? — see what drove the B- grade
The composite is a weighted blend of 9 inputs, each scored 0–100. Each bar is that input's sub-score; the figure is the points it added to the 100-point composite (weight × sub-score).
- Cash flow +30.0/30.0
- 1% rule +10.0/10.0
- DSCR +10.0/10.0
- ARV discount +7.5/15.0
- Livability +3.3/5.0
- Rent growth +2.5/5.0
- Condition / age +2.5/5.0
- Schools +2.4/10.0
- Appreciation +0.0/10.0
$85,000
🖨 Deal sheet (PDF) 📄 Offer letter ✓ Due diligence
Listing remarks
Step back in time with this spacious 1900-built historic 2-story home full of character and endless potential! Offering 3,644 square feet, this investor special is ready for someone with vision to bring it back to life. The home features updated plumbing and new electrical work downstairs, a remodeled bathroom with tile shower/tub combo and tile flooring, plus some rooms with new flooring already installed. Major updates include a roof and HVAC system that are both only 5 years old. High-speed fiber internet is available, combining modern convenience with historic charm. From the large rooms to the original character throughout, this property has the bones and charm to become something trul
Key facts
- Remodeled bathroom
- New flooring
- New electrical work
Tags
Property features AI
Exterior
- Parking: Detached 1-car garage; 1 covered parking space; 1 total parking space
- Utilities: Public water; Public sewer; Water available
- Home design: Single-family residence; Residential property; Two levels; Historic construction
- Construction: Vinyl siding; Metal roof; Brick/mortar foundation; Historic year built
- Exterior features: Porch; Covered porch; Deck; Storage building / structure
Interior
- Kitchen: Double oven; Gas range; Dishwasher; Microwave
- Bedrooms: 5 bedrooms total; 2 main-level bedrooms
- Flooring: Carpet; Wood; Tile
- Bathrooms: 1 full bathroom
- Heating & cooling: Central heating; Central air conditioning
- Interior features: Double oven; Gas range; Dishwasher; Microwave
Neighborhood map
What this means for you Summary
Snapshot
- This is a 5-bed/1.0-bath single-family listed at $85k.
Deal economics
- At list price, monthly cash flow is $920 ($11k/yr) — positive.
- The deal already cash-flows at list — no discount required.
- Meets the 1% rule at list price ($2k rent vs $85k).
- Recommended offer: $82k (3.0% below list) — sets the bar for market timing.
Location & tenants
- Location reads 66/100 on livability (#133 in TN) — a middle-class / working-renter tenant base. Strengths: crime A+, cost of living A+, housing A+; Watch: health & safety C-, employment D, amenities F.
- Benton County (town): math 31% / reading 28% proficiency, ranked #66 of 139 in TN (top 48%) — low school quality limits family demand, transient renter base, plan for 1-2y turnover.
- Zoned schools: Briarwood School (math 38% / reading 34%, grade F, #305 of 952 statewide, top 32%, 381 students, 0% FRL); Camden Central High School (math 8% / reading 37%, grade F, #156 of 332 statewide, top 49%, 521 students, 0% FRL) — zoned schools average 0% FRL vs 54% district-wide (54 pts lower); this property's tenant base skews higher-income than the district average.
- Market conditions: 112 active listings in the ZIP; 6 units permitted in Benton County in 2024 (0 in 5+ unit buildings).
Forward outlook
- Local home prices are declining (-3.0%/yr); year-one equity from $588 of loan paydown is wiped out by about $3k of value loss. Plan a longer hold.
- Benton County population projected at -18% by 2050 — secular population decline; favor cash flow + early exit over multi-decade hold.
- At projected returns (-3.0% appreciation + 3.0% rent growth), your $24k cash investment doubles in ~3 years — after that, you're playing with house money.
Negotiation context
- It's been on market 39 days — a 3% lower offer ($82k) is reasonable based on typical stale-listing flexibility.
- Current owner paid $34k; list at $85k implies a 146% gain — meaningful room to come down on a strong offer.
Risks & watch-outs
- Watch-outs: built in 1900 — expect roof / HVAC / electrical / plumbing capex.
- Climate carrying-cost: moderate wildfire risk; extreme-heat days projected 7→20/yr by 2055 (HVAC capex compounding) — expect insurance premiums to compound above CPI over the hold.
Questions for the listing agent
- It's been on market 39 days. Have you received any prior offers? Is the seller open to a 3% concession, seller financing, or rate buy-down credit?
- Built in 1900 — when were the roof, HVAC, electrical panel, plumbing, and water heater last replaced?
- Is there a deadline driving the sale (1031 exchange, divorce, estate, relocation)? That informs how much negotiation room exists.
- Schools are D-rated, which usually means shorter tenancies and higher turnover. Who's the typical renter profile here, and what's been the actual vacancy rate?
- What's the average days-on-market for RENTAL listings here right now (not sales)? A rising rental-DOM trend means longer vacancies and softer asking-rent achievability than the comps imply.
- What's the recent tenant-quality profile in this submarket — average credit score on applications, eviction rate, late-payment / NSF rate, and stable-employment percentage? A property-management company in the area should have these aggregated.
- How much new for-sale + rental construction is in the pipeline within 1–3 miles? Heavy new supply typically softens prices + rents 12–24 months out; constrained supply supports both.
Investment metrics
- 1% rule
- 2.15% ✓
- Cap rate
- 19.28%
- Cash-on-cash
- 46.38%
- DSCR
- 3.06
- GRM
- 3.9
CMA / ARV
No comps found within radius.
Projected returns pro-forma
-3.0% appreciation · 3.0% rent growth · sell at horizon
- IRR
- 43.6%
- Equity multiple
- 2.88×
- Total profit
- $44,797
- Equity at exit
- $12,674
- IRR
- 49.6%
- Equity multiple
- 5.81×
- Total profit
- $114,398
- Equity at exit
- $7,349
Cash invested: $23,800 (down + closing). Projections, not guarantees.
Landlord ↔ Tenant lean methodology
- Overall (STATE)
- 87 Strongly Landlord-Friendly
- State Tennessee
- 87 Strongly Landlord-Friendly · R+13
- County
- — inherits STATE
- City
- — inherits STATE
ZIP-level market 38320
- Home prices YoY
- -6.5%
- Active inventory
- 112
- Price-to-rent
- 3.9×
Monthly cashflow live
- Estimated rent
- $1,829 medium interval (Pro) →
- Mortgage (P&I)
- −$446
- Tax from tax record
- −$44 /mo · $523/yr
- Insurance
- −$35
- HOA
- −$0
- Vacancy / Maint / Mgmt
- −$384
- Net cashflow
- $920
Break-even live
Sensitivity live
| Price | -10% $968 | -5% $944 | +0% $920 | +5% $896 | +10% $872 |
|---|---|---|---|---|---|
| Rent | -10% $775 | -5% $848 | +0% $920 | +5% $992 | +10% $1,064 |
| Rate | -1.0pp $963 | -0.5pp $941 | base $920 | +0.5pp $898 | +1.0pp $875 |
UW: 25.0% down · 7.5% · 30yr · 1.5% tax · 5.0% vac · 8.0% maint · 8.0% mgmt
Financing live
Cash to close
- Down payment
- $21,250
- Closing costs
- $2,550
- Reserves months
- —
- Total cash needed
- —
Loan-product check · same deal, 3 products live
Conventional
25% down · 7.5% · 30yr
- Down + closing
- —
- Monthly P&I
- —
- Monthly cashflow
- —
- DSCR
- —
- Eligible?
- —
Personal DTI + credit; lowest rate.
DSCR
20% down · 8.5% · 30yr
- Down + closing
- —
- Monthly P&I
- —
- Monthly cashflow
- —
- DSCR
- —
- Eligible?
- —
No personal income docs; deal must DSCR.
Hard money
10% down · 12.0% · 12mo
- Down + closing
- —
- Monthly P&I
- —
- Monthly cashflow
- —
- DSCR
- —
- Eligible?
- —
Short-term bridge; refi at stabilization.
Listing history 18 events
-
2026-06-16days on market $85,000 Active 39 DOM
-
2026-06-15days on market $85,000 Active 38 DOM
-
2026-06-13days on market $85,000 Active 36 DOM
-
2026-06-12pricedays on market $85,000 Active 35 DOM
-
2026-06-09days on market $94,900 Active 32 DOM
-
2026-06-08days on market $94,900 Active 31 DOM
-
2026-06-08days on market $94,900 Active 30 DOM
-
2026-06-07days on market $94,900 Active 29 DOM
-
2026-06-04days on market $94,900 Active 26 DOM
-
2026-06-02days on market $94,900 Active 25 DOM
-
2026-06-01days on market $94,900 Active 24 DOM
-
2026-05-31price $94,900 Active 23 DOM
-
2026-05-31days on market $99,900 Active 23 DOM
-
2026-05-23price $99,900
-
2026-05-18price $115,000
-
2026-05-12price $120,000
-
2026-05-08$140,000 Active
-
2002-06-17soldstatus $34,500
ⓘ Source: listings_history table (triggers on properties + properties_extension) + one-shot
backfill from property_details.listing_events for pre-trigger history.
Tax reassessment forecast TN · Resets to sale price
- Current annual tax
- $523 · $44/mo
- Projected year-2 tax
- $604 · $50/mo
- Expected delta
- +$80/yr (+$7/mo · 15.4%)
ⓘ Screening estimate from a state-policy table — verify with the county assessor before closing.
Climate risk First Street
- Flood 1/10 Low FEMA zone X (unshaded) · 0% chance over 30 yrs
- Wildfire 5/10 Major
- Heat 5/10 Major 7 d/yr ≥108°F today · 20 d/yr by 30 yrs out
- Wind 4/10 Moderate 11% chance of damaging wind over 30 yrs
- Air quality 2/10 Low 0 unhealthy d/yr today · 1 by 30 yrs out
Nearby sold comps map
Loading sold comps map…
Walkable amenities ~0.75 mi
Loading nearby amenities…
Taxation est. · year 1
- Rental income
- $21,942
- − Mortgage interest
- −$4,761
- − Property taxes
- −$523
- − Insurance
- −$425
- − Repairs & maintenance
- −$1,755
- − Management
- −$1,755
- − Depreciation
- −$2,473
- Taxable income
- $10,250
- Est. tax owed @ 24.0%
- −$2,460
- After-tax cash flow
- $8,578/yr
For passive investors: Depreciation is non-cash, so a rental often shows a tax loss while cash-flowing — sheltering income. Rental losses are passive: they offset passive income freely, and up to $25,000/yr can offset ordinary (W-2) income if you actively participate and your MAGI is under $100k (phasing out to $0 by $150k); unused losses carry forward. On sale, claimed depreciation is recaptured at up to 25%, and gains may owe capital-gains tax (a 1031 exchange can defer both). Figures are a year-1 estimate at your 24.0% rate — not tax advice; consult a CPA.
Schools (NCES district)
- District
- Benton County
- NCES district ID
- 4700240
- Math proficiency
- 31% ▼ -8.00%
- Reading proficiency
- 28% ▼ -7.00%
- Median HH income
- $33,587
- Composite
- 24.24/100
- National rank
- #7722
- State rank
- #66 of 139 in TN
Livability — Camden
- Score
- 66/100
- State rank
- #133
- US rank
- #12196
Category grades
Schools grade is shown separately in the Schools card above.
Census & demographics
- Census place
- Camden, TN
- Population (ZIP)
- 10,470
Population outlook (Benton County) Hauer SSP2
- Today (2025)
- 15,046 people
- By 2030
- 14,425 · -4.1%
- By 2040
- 13,296 · -11.6%
- By 2050
- 12,298 · -18.3%
- By 2075
- 10,347 · -31.2%
- By 2100
- 8,594 · -42.9%
Race, ethnicity, and origin ACS 2023
- Neighborhood character
- Predominantly White (91%)
- Race & ethnicity
- White 91% Two or more races 3% Hispanic / Latino 2% Black 2% Asian 1%
- Common ancestry
- Lithuanian 3% Italian 3% Slovak 2%
- Foreign-born
- 2% · China
- Languages at home
- 99% English-only · Spanish 1%
Political lean MEDSL · Benton
- 2024 margin
- Solid R (+62.9) · D 18.1% · R 81.1%
- 2008→2024 swing
- -46.7pp toward R · 2008: -16.2pp · 2024: -62.9pp
- All cycles
- 2024: R+62.9 2020: R+57.0 2016: R+51.3 2012: R+25.6 2008: R+16.2
Not yet ingested
- Civics
- —
Market trends
- HPI YoY
- ▼ -16.25%
- Current HPI
- 233.3477
- Rent YoY
- —
- Metro
- —
- State GDP YoY
- ▲ 2.78%
- F500 in state
- 22
Industry mix (Fortune 500 HQ in TN)
| Industry | F500 HQs | Revenue |
|---|---|---|
| Healthcare | 3 | $91B |
|
||
| Retail | 3 | $72B |
|
||
| Transportation / Logistics | 1 | $88B |
|
||
| Paper / Packaging | 1 | $19B |
|
||
| Insurance | 1 | $13B |
|
||
| Energy | 1 | $12B |
|
||
Price history
+189.6% since first listed5 events — show timeline
- 2026-05-23 Price Changed $99,900 REALTRACS as Distributed by MLS Grid
- 2026-05-18 Price Changed $115,000 REALTRACS as Distributed by MLS Grid
- 2026-05-12 Price Changed $120,000 REALTRACS as Distributed by MLS Grid
- 2026-05-08 Listed $140,000 REALTRACS as Distributed by MLS Grid
- 2002-06-17 Sold (Public Records) $34,500 Public Records
Property tax history
+2.2%/yrLatest (2025): $523 · -0.4% YoY. Source: county tax records.
Cash-flow waterfall
monthlySold comps — $/sqft
last 12 mo · ≤1 miLoading sold comps…