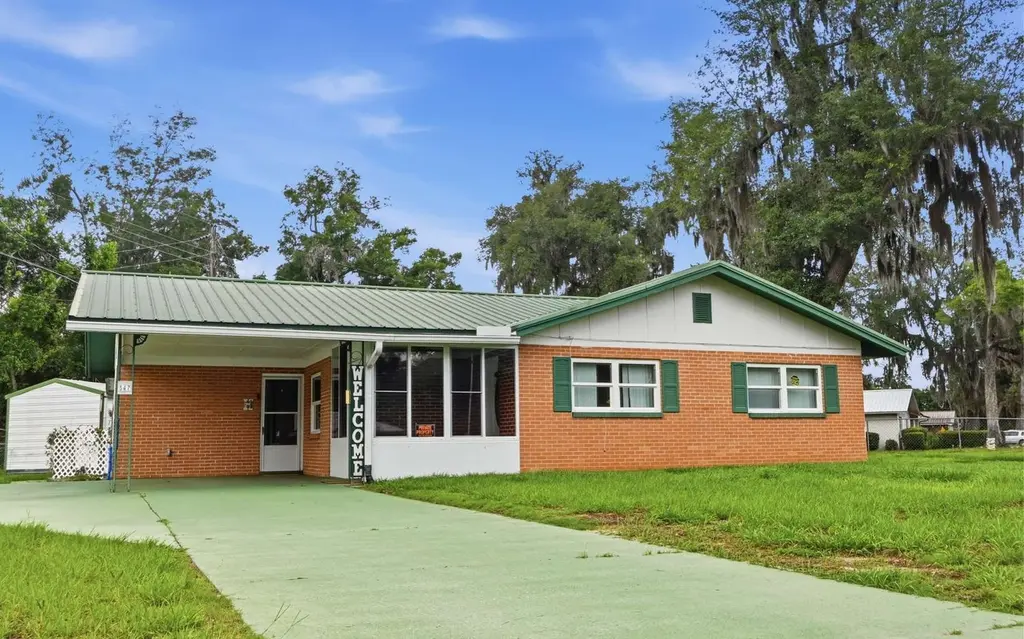
547 SE Olustee Ave · Watertown, FL
Flood risk 1/10 · Minimal
- FEMA flood zone
- X (unshaded)
- Chance of flooding over 30 yrs
- 0.0%
- Est. flood insurance / yr
- $507 – $1,088
Fire risk 6/10 · Moderate
- Est. fire insurance / yr
- $947 – $1,759
Heat risk 8/10 · Major
- Hot days now (above 107°F)
- 7 days/yr
- Hot days in 30 yrs
- 20 days/yr
Wind risk 9/10 · Severe
- Chance of severe wind over 30 yrs
- 99.0%
Air-quality risk 5/10 · Moderate
- Unhealthy air days now
- 9 days/yr
- Unhealthy air days in 30 yrs
- 10 days/yr
Risk factors via First Street. Map © Google.
Why this score? — see what drove the C+ grade
The composite is a weighted blend of 9 inputs, each scored 0–100. Each bar is that input's sub-score; the figure is the points it added to the 100-point composite (weight × sub-score).
- Cash flow +20.5/30.0
- Appreciation +10.0/10.0
- ARV discount +6.9/15.0
- DSCR +6.5/10.0
- Schools +4.5/10.0
- 1% rule +4.4/10.0
- Livability +3.0/5.0
- Rent growth +2.5/5.0
- Condition / age +2.5/5.0
$187,000
🖨 Deal sheet 📄 Offer letter ✓ Due diligence
Listing remarks MLS
Vintage 1960s era brick home on a corner lot now available in the established Oak Hill Estates neighborhood. Create a new home here or explore the possibilities of an investment property. The screened porches add to the living space while the easy to maintain vinyl and tile floors offer durability and functionality. This location is a short drive from shopping, recreation and the new Eastside Elementary School.
Key facts
- 9,975 sq ft lot
- Parking
- Built 1963
Property features AI
Finance
- Other: Property type: Residential — Single Family Residence; Zoning: RSF-2
- Financial info: No lease restrictions indicated
- HOA & community: No HOA association noted; Development: Oak Hill Estates
Exterior
- Parking: Carport with 1 space
- Utilities: Public water; Septic tank sewer; Electricity connected; Cable available
- Home design: Single-family residence; One story; Northwest-facing; Completed condition
- Construction: Brick construction; Metal roof; Slab foundation; Built on 0.23 acre lot (approx. 104 x 96)
- Exterior features: Corner lot within city limits; Public maintained asphalt road; Shed(s)
Interior
- Kitchen: Range; Range hood; Refrigerator; Electric water heater
- Bedrooms: 3 bedrooms
- Flooring: Ceramic tile; Linoleum; Vinyl
- Bathrooms: 2 full bathrooms
- Heating & cooling: Central heating (electric); Central air conditioning
- Interior features: Ceiling fans; Blinds; Insulated windows; Nine total rooms
- Laundry & utility: Washer and dryer in laundry room (inside)
Neighborhood map
What this means for you Summary
Snapshot
- This is a 3-bed/2.0-bath single-family listed at $187k.
Deal economics
- At list price, monthly cash flow is $247 ($3k/yr) — positive.
- The deal already cash-flows at list — no discount required.
- To meet the 1% rule (rent ≥ 1% of price), the offer needs to be $176k (6.0% below list).
- Recommended offer: $176k (6.0% below list) — sets the bar for 1% rule.
- Cap rate 7.9% vs local median 5.5% in Watertown — top-decile yield for the area; either an underpriced asset or a hidden risk that comps aren't pricing in. Stress-test before assuming the spread holds.
Location & tenants
- Location reads 60/100 on livability (#798 in FL) — a middle-class / working-renter tenant base. Strengths: crime A+, cost of living A+, housing A-; Watch: amenities F, commute F, employment F.
- Columbia (town): math 53% / reading 54% proficiency, ranked #25 of 73 in FL (top 34%) — acceptable for families but not a draw, mixed tenant base, ~2y average lease.
- Zoned schools: Eastside Elementary School (math 68% / reading 62%, grade B+, #514 of 2,144 statewide, top 24%, 631 students, 62% FRL).
- Market conditions: 143 active listings in the ZIP; 178 units permitted in Columbia County in 2024 (0 in 5+ unit buildings).
Forward outlook
- In year one you build about $20k of equity ($1k loan paydown + $19k appreciation (10.0% local appreciation)).
- Columbia County population projected to shrink 7% by 2050 — rents likely to lag national; underwrite the cash flow, not the appreciation.
- At projected returns (10.0% appreciation + 3.0% rent growth), your $52k cash investment doubles in ~3 years — after that, you're playing with house money.
- By year 2, paydown + projected appreciation supports a ~$32k cash-out refi (75% LTV) — recoverable capital for the next deal without selling this one.
Negotiation context
- Only 6 days on market — expect competitive offers; lowballing is unlikely to land.
- 2 sale attempts with the ask held roughly flat each time — persistent listings suggest the price (not the market) is what's stuck; bring a comps-based counter.
- Current owner paid $112k; list at $187k implies a 67% gain — meaningful room to come down on a strong offer.
Risks & watch-outs
- Climate carrying-cost: severe wind risk, 99% chance of damaging wind over 30y; major wildfire risk; extreme-heat days projected 7→20/yr by 2055 (HVAC capex compounding) — expect insurance premiums to compound above CPI over the hold.
Questions for the listing agent
- Built in 1963 — when were the roof, HVAC, electrical panel, plumbing, and water heater last replaced?
- Is there a deadline driving the sale (1031 exchange, divorce, estate, relocation)? That informs how much negotiation room exists.
- Schools are F-rated, which usually means shorter tenancies and higher turnover. Who's the typical renter profile here, and what's been the actual vacancy rate?
- What's the average days-on-market for RENTAL listings here right now (not sales)? A rising rental-DOM trend means longer vacancies and softer asking-rent achievability than the comps imply.
- What's the recent tenant-quality profile in this submarket — average credit score on applications, eviction rate, late-payment / NSF rate, and stable-employment percentage? A property-management company in the area should have these aggregated.
- How much new for-sale + rental construction is in the pipeline within 1–3 miles? Heavy new supply typically softens prices + rents 12–24 months out; constrained supply supports both.
Investment metrics
- 1% rule
- 0.94% ✗
- Cap rate
- 7.88%
- Cash-on-cash
- 5.66%
- DSCR
- 1.25
- GRM
- 8.9
CMA / ARV
- ARV (on-the-fly)
- $184,475
- Comps found
- 12
Show comp detail 12 sales within ~0.75 mi
| Address | Dist | Beds/Ba | Sqft | Sold | Price | $/sf | Match |
|---|---|---|---|---|---|---|---|
| 465 SE Golf Club Ave | 0.18mi | 3/2.0 | 1,215 (+3%) | 0mo | $175,000 | $144 | 86 |
| 187 SE Elm Loop | 0.22mi | 2/2.0 (-1) | 1,189 (+1%) | 6mo | $202,500 | $170 | 78 |
| 240 SE Cameron Ter | 0.27mi | 3/2.0 | 1,225 (+4%) | 5mo | $235,000 | $192 | 76 |
| 208 SE Elm Loop | 0.23mi | 3/2.0 | 1,230 (+5%) | 7mo | $192,500 | $157 | 76 |
| 345 SE Rosewood Cir | 0.20mi | 2/2.0 (-1) | 1,147 (-2%) | 8mo | $234,000 | $204 | 75 |
| 367 SE Tribble St | 0.26mi | 3/1.5 | 1,103 (-6%) | 2mo | $160,000 | $145 | 74 |
| 741 SE Rosewood Cir | 0.38mi | 2/2.0 (-1) | 1,193 (+2%) | 6mo | $189,000 | $158 | 70 |
| 201 SE Rosewood Cir | 0.33mi | 2/2.0 (-1) | 1,220 (+4%) | 7mo | $187,000 | $153 | 67 |
| 755 SE Rosewood Cir | 0.38mi | 2/2.0 (-1) | 1,111 (-5%) | 4mo | $165,000 | $149 | 65 |
| 173 SE Jenese Way | 0.59mi | 2/2.0 (-1) | 1,216 (+4%) | 0mo | $180,000 | $148 | 62 |
| 205 SE Tristin Ln | 0.66mi | 2/2.0 (-1) | 1,151 (-2%) | 6mo | $210,000 | $182 | 56 |
| 734 SE Rosewood Cir | 0.35mi | 2/2.0 (-1) | 1,017 (-13%) | 2mo | $160,000 | $157 | 55 |
Match score weights: distance 35% · size 25% · config 20% · recency 20%. Top-matched comps best support the ARV.
Projected returns pro-forma
10.0% appreciation · 3.0% rent growth · sell at horizon
- IRR
- 28.4%
- Equity multiple
- 3.24×
- Total profit
- $117,517
- Equity at exit
- $168,464
- IRR
- 24.7%
- Equity multiple
- 7.37×
- Total profit
- $333,560
- Equity at exit
- $363,300
Cash invested: $52,360 (down + closing). Projections, not guarantees.
Landlord ↔ Tenant lean methodology
- Overall (STATE)
- 87 Strongly Landlord-Friendly
- State Florida
- 87 Strongly Landlord-Friendly · R+3
- County
- — inherits STATE
- City
- — inherits STATE
ZIP-level market 32025
- Home prices YoY
- 6.8%
- Active inventory
- 143
- Price-to-rent
- 8.9×
Monthly cashflow live
- Estimated rent
- $1,758 medium interval (Pro) →
- Mortgage (P&I)
- −$981
- Tax from tax record
- −$83 /mo · $1,001/yr
- Insurance
- −$78
- HOA
- −$0
- Vacancy / Maint / Mgmt
- −$369
- Net cashflow
- $247
Break-even live
UW: 25.0% down · 7.5% · 30yr · 1.5% tax · 5.0% vac · 8.0% maint · 8.0% mgmt
Financing live
Cash to close
- Down payment
- $46,750
- Closing costs
- $5,610
- Reserves months
- —
- Total cash needed
- —
Loan-product check · same deal, 3 products live
Conventional
25% down · 7.5% · 30yr
- Down + closing
- —
- Monthly P&I
- —
- Monthly cashflow
- —
- DSCR
- —
- Eligible?
- —
Personal DTI + credit; lowest rate.
DSCR
20% down · 8.5% · 30yr
- Down + closing
- —
- Monthly P&I
- —
- Monthly cashflow
- —
- DSCR
- —
- Eligible?
- —
No personal income docs; deal must DSCR.
Hard money
10% down · 12.0% · 12mo
- Down + closing
- —
- Monthly P&I
- —
- Monthly cashflow
- —
- DSCR
- —
- Eligible?
- —
Short-term bridge; refi at stabilization.
Listing history 7 events
-
2026-06-09remarks 454-char remark
-
2026-06-09status $187,000 Pending 6 DOM
-
2026-06-08days on market $187,000 Active 6 DOM
-
2026-06-07days on market $187,000 Active 5 DOM
-
2026-06-05days on market $187,000 Active 2 DOM
-
2026-06-03remarks 414-char remark
-
2026-06-03$187,000 Active 1 DOM
ⓘ Source: listings_history table (triggers on properties + properties_extension) + one-shot
backfill from property_details.listing_events for pre-trigger history.
Tax reassessment forecast FL · Resets to sale price
- Current annual tax
- $1,001 · $83/mo
- Projected year-2 tax
- $1,552 · $129/mo
- Expected delta
- +$552/yr (+$46/mo · 55.1%)
ⓘ Screening estimate from a state-policy table — verify with the county assessor before closing.
Climate risk First Street
- Flood 1/10 Low FEMA zone X (unshaded) · 0% chance over 30 yrs
- Wildfire 6/10 Major
- Heat 8/10 Severe 7 d/yr ≥107°F today · 20 d/yr by 30 yrs out
- Wind 9/10 Extreme 99% chance of damaging wind over 30 yrs
- Air quality 5/10 Major 9 unhealthy d/yr today · 10 by 30 yrs out
Nearby sold comps map
Loading sold comps map…
Walkable amenities ~0.75 mi
Loading nearby amenities…
Taxation est. · year 1
- Rental income
- $21,099
- − Mortgage interest
- −$10,475
- − Property taxes
- −$1,001
- − Insurance
- −$935
- − Repairs & maintenance
- −$1,688
- − Management
- −$1,688
- − Depreciation
- −$5,440
- Taxable loss
- −$127
- Est. tax savings @ 24.0%
- +$30
- After-tax cash flow
- $2,996/yr
For passive investors: Depreciation is non-cash, so a rental often shows a tax loss while cash-flowing — sheltering income. Rental losses are passive: they offset passive income freely, and up to $25,000/yr can offset ordinary (W-2) income if you actively participate and your MAGI is under $100k (phasing out to $0 by $150k); unused losses carry forward. On sale, claimed depreciation is recaptured at up to 25%, and gains may owe capital-gains tax (a 1031 exchange can defer both). Figures are a year-1 estimate at your 24.0% rate — not tax advice; consult a CPA.
Schools (NCES district)
- District
- Columbia
- NCES district ID
- 1200360
- Math proficiency
- 53% ▼ -10.00%
- Reading proficiency
- 54% ▼ -3.00%
- Median HH income
- $40,053
- Composite
- 44.74/100
- National rank
- #2750
- State rank
- #25 of 73 in FL
Livability — Watertown
- Score
- 60/100
- State rank
- #798
- US rank
- #18481
Category grades
Schools grade is shown separately in the Schools card above.
Census & demographics
- Census place
- Watertown, FL
- County
- Columbia County · 40,507 people
- Metro
- Lake City, FL
- Population (ZIP)
- 22,948
- Household income
- $55,004
- Rent vs Own
- Severe rent burden
- 754.0
Population outlook (Columbia County) Hauer SSP2
- Today (2025)
- 68,129 people
- By 2030
- 67,501 · -0.9%
- By 2040
- 65,465 · -3.9%
- By 2050
- 63,058 · -7.4%
- By 2075
- 56,291 · -17.4%
- By 2100
- 45,243 · -33.6%
Race, ethnicity, and origin ACS 2023
- Neighborhood character
- Predominantly White (67%)
- Race & ethnicity
- White 67% Black 20% Hispanic / Latino 8% Two or more races 7%
- Hispanic origin (detail)
- Mexican 1% Puerto Rican 3% Cuban 1%
- Common ancestry
- Serbian 2% Lithuanian 2% Romanian 2%
- Foreign-born
- 3% · Canada
- Languages at home
- 91% English-only · Spanish 6% French/Haitian/Cajun 2%
Political lean MEDSL · Columbia
- 2024 margin
- Solid R (+50.2) · D 24.6% · R 74.7%
- 2008→2024 swing
- -16.4pp toward R · 2008: -33.8pp · 2024: -50.2pp
- All cycles
- 2024: R+50.2 2020: R+45.2 2016: R+44.5 2012: R+36.7 2008: R+33.8
Not yet ingested
- Civics
- —
Market trends
- HPI YoY
- ▲ 17.57%
- Current HPI
- 276.7253
- Rent YoY
- —
- Metro
- Lake City, FL
- State GDP YoY
- ▲ 3.28%
- F500 in state
- 36
Industry mix (Fortune 500 HQ in FL)
| Industry | F500 HQs | Revenue |
|---|---|---|
| Industrial Technology | 2 | $29B |
|
||
| Insurance | 2 | $17B |
|
||
| Retail | 1 | $60B |
|
||
| Technology Distribution | 1 | $58B |
|
||
| Homebuilding | 1 | $35B |
|
||
| Technology Manufacturing | 1 | $35B |
|
||
Price history
+367.5% since first listed5 events — show timeline
- 2026-06-02 Listed $187,000 Stellar MLS as Distributed by MLS Grid
- 2026-06-02 Listed $187,000 NFMLS
- 2005-11-17 Sold (Public Records) $112,000 Public Records
- 2005-04-20 Sold (Public Records) $69,900 Public Records
- 1985-02-01 Sold (Public Records) $40,000 Public Records
Property tax history
-1.7%/yrLatest (2025): $1,001 · -21.8% YoY. Source: county tax records.
Cash-flow waterfall
monthlySold comps — $/sqft
last 12 mo · ≤1 miLoading sold comps…