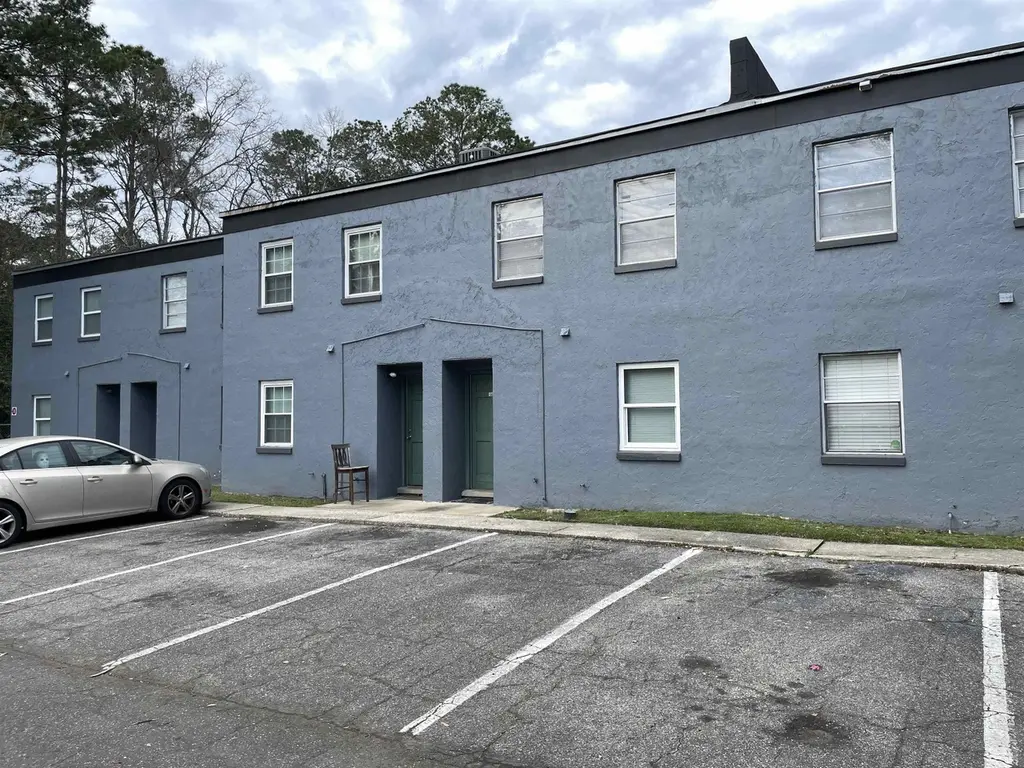
2325 W Pensacola St #140 · Tallahassee, FL
Flood risk 1/10 · Minimal
- FEMA flood zone
- X (unshaded)
- Chance of flooding over 30 yrs
- 0.0%
- Est. flood insurance / yr
- $507 – $1,088
Fire risk 1/10 · Minimal
- Est. fire insurance / yr
- $947 – $1,759
Heat risk 8/10 · Major
- Hot days now (above 108°F)
- 7 days/yr
- Hot days in 30 yrs
- 20 days/yr
Wind risk 9/10 · Severe
- Chance of severe wind over 30 yrs
- 99.0%
Air-quality risk 4/10 · Minor
- Unhealthy air days now
- 5 days/yr
- Unhealthy air days in 30 yrs
- 6 days/yr
Risk factors via First Street. Map © Google.
Why this score? — see what drove the B grade
The composite is a weighted blend of 9 inputs, each scored 0–100. Each bar is that input's sub-score; the figure is the points it added to the 100-point composite (weight × sub-score).
- Cash flow +30.0/30.0
- 1% rule +10.0/10.0
- DSCR +10.0/10.0
- ARV discount +7.5/15.0
- Schools +4.3/10.0
- Livability +4.3/5.0
- Rent growth +3.7/5.0
- Condition / age +2.5/5.0
- Appreciation +0.0/10.0
$54,500
🖨 Deal sheet 📄 Offer letter ✓ Due diligence
Listing remarks MLS
Wonderful condo priced just right! Cllose to FSU, TCC and Famu. Unit offers a spacious floor plan, plenty of windows that provide lots of light, spacious closets in the bedrooms, and a terrace or balcony for your pleasure. HOA includes Water, Sewage, Pest control, Landscaping, Parking, Use of the pool HOA Fee is 200/month
Key facts
- $334 HOA
- Community pool
- Built 1969
Property features AI
Finance
- Other: Property is listed for sale
- HOA & community: Association fee $4,008; Association covers common areas, insurance, grounds and structure maintenance, pest control, pool(s), street lights, and trash; Community features include pool, street lights, and sidewalks
Exterior
- Parking: Parking space(s)
- Utilities: Public sewer
- Home design: 2-story property; Stucco exterior
- Construction: Stucco construction
- Exterior features: Patio; Concrete in-ground community pool; Public maintained paved road
Interior
- Kitchen: Dishwasher; Oven; Range; Refrigerator; Kitchen approx. 10 x 5
- Bedrooms: Bedroom 2: 12 x 12; Other room: 13 x 12; Primary bedroom located on upper level
- Flooring: Laminate flooring
- Bathrooms: 1 full bathroom; 1 half bathroom
- Heating & cooling: Central heating (electric); Central cooling (electric)
- Interior features: Upper-level primary bedroom; Walk-in closet(s)
Neighborhood map
What this means for you Summary
Snapshot
- This is a 2-bed/1.5-bath condo listed at $54k.
Deal economics
- At list price, monthly cash flow is $279 ($3k/yr) — positive.
- The deal already cash-flows at list — no discount required.
- Meets the 1% rule at list price ($1k rent vs $54k).
- Recommended offer: $51k (6.0% below list) — sets the bar for market timing.
- Cap rate 12.4% vs local median 4.2% in Tallahassee — top-decile yield for the area; either an underpriced asset or a hidden risk that comps aren't pricing in. Stress-test before assuming the spread holds.
Location & tenants
- Location reads 86/100 on livability (#19 in FL, #429 nationally) — a professional / high-income tenant draw. Strengths: amenities A+, commute A+, health & safety A+; Watch: employment D.
- Leon (urban): math 48% / reading 53% proficiency, ranked #33 of 73 in FL (top 45%) — acceptable for families but not a draw, mixed tenant base, ~2y average lease.
- Market conditions: Rents rising fast (+4.7%/yr); 142 active listings in the ZIP; 38 comparable units currently listed for rent nearby; rentals at typical pace (median 22d on market — plan ~3-4 weeks tenant-placement turnaround); lower-income renter base — watch delinquency; 1,765 units permitted in Leon County in 2024 (975 in 5+ unit buildings).
- At $1,275/mo this rent would consume 47% of the median local household income ($32k/yr) (locally 6995% of renters already pay >50% of income on rent) — very limited rent-growth headroom before tenants either downsize or default.
Forward outlook
- Local home prices are declining (-3.0%/yr); year-one equity from $377 of loan paydown is wiped out by about $2k of value loss. Plan a longer hold.
- Leon County population projected at +23% by 2050 — long-run rental-demand tailwind backs the buy-and-hold thesis.
- At projected returns (-3.0% appreciation + 4.7% rent growth), your $15k cash investment doubles in ~5 years — after that, you're playing with house money.
Negotiation context
- It's been on market 90 days — a 6% lower offer ($51k) is reasonable based on typical stale-listing flexibility.
- 5 sale attempts since 8y ago with the ask held roughly flat each time — persistent listings suggest the price (not the market) is what's stuck; bring a comps-based counter.
- Current owner paid $34k; list at $54k implies a 61% gain — meaningful room to come down on a strong offer.
Risks & watch-outs
- Watch-outs: HOA is 26% of rent.
- Climate carrying-cost: severe wind risk, 99% chance of damaging wind over 30y; extreme-heat days projected 7→20/yr by 2055 (HVAC capex compounding) — expect insurance premiums to compound above CPI over the hold.
Questions for the listing agent
- It's been on market 90 days. Have you received any prior offers? Is the seller open to a 6% concession, seller financing, or rate buy-down credit?
- Built in 1969 — when were the roof, HVAC, electrical panel, plumbing, and water heater last replaced?
- What does the HOA fee cover, when was the last increase, and are there any pending special assessments or reserve-fund shortfalls?
- Any open or pending special assessments — roof, HVAC, plumbing, elevator, façade? What's the per-unit balance and payoff schedule, and is the seller paying it off at close or rolling it to the buyer?
- Why hasn't it sold? Are there any deal-killer items the seller is aware of (foundation, flood, title, zoning, code violations)?
- Is there a deadline driving the sale (1031 exchange, divorce, estate, relocation)? That informs how much negotiation room exists.
- Schools are B-rated — typically a magnet for longer-tenancy family renters. What's the average tenant stay here, and is there a school-zone premium baked into asking?
- What's the average days-on-market for RENTAL listings here right now (not sales)? A rising rental-DOM trend means longer vacancies and softer asking-rent achievability than the comps imply.
- What's the recent tenant-quality profile in this submarket — average credit score on applications, eviction rate, late-payment / NSF rate, and stable-employment percentage? A property-management company in the area should have these aggregated.
- How much new apartment / multifamily construction is in the pipeline within 1–3 miles? Heavy new supply (>2% of stock underway) typically softens rents 12–24 months out; light construction supports rent growth.
Investment metrics
- 1% rule
- 2.34% ✓
- Cap rate
- 12.44%
- Cash-on-cash
- 21.95%
- DSCR
- 1.98
- GRM
- 3.6
CMA / ARV
No comps found within radius.
Projected returns pro-forma
-3.0% appreciation · 4.69% rent growth · sell at horizon
- IRR
- 17.8%
- Equity multiple
- 1.75×
- Total profit
- $11,385
- Equity at exit
- $8,126
- IRR
- 28.1%
- Equity multiple
- 3.83×
- Total profit
- $43,125
- Equity at exit
- $4,712
Cash invested: $15,260 (down + closing). Projections, not guarantees.
Landlord ↔ Tenant lean methodology
- Overall (STATE)
- 87 Strongly Landlord-Friendly
- State Florida
- 87 Strongly Landlord-Friendly · R+3
- County
- — inherits STATE
- City
- — inherits STATE
ZIP-level market 32304
- Home prices YoY
- -21.2%
- Rents YoY
- 4.7%
- Active inventory
- 142
- Price-to-rent
- 3.6×
Monthly cashflow live
- Estimated rent
- $1,275 high interval (Pro) →
- Mortgage (P&I)
- −$286
- Tax from tax record
- −$86 /mo · $1,031/yr
- Insurance
- −$23
- HOA
- −$334
- Vacancy / Maint / Mgmt
- −$268
- Net cashflow
- $279
Break-even live
UW: 25.0% down · 7.5% · 30yr · 1.5% tax · 5.0% vac · 8.0% maint · 8.0% mgmt
Financing live
Cash to close
- Down payment
- $13,625
- Closing costs
- $1,635
- Reserves months
- —
- Total cash needed
- —
Loan-product check · same deal, 3 products live
Conventional
25% down · 7.5% · 30yr
- Down + closing
- —
- Monthly P&I
- —
- Monthly cashflow
- —
- DSCR
- —
- Eligible?
- —
Personal DTI + credit; lowest rate.
DSCR
20% down · 8.5% · 30yr
- Down + closing
- —
- Monthly P&I
- —
- Monthly cashflow
- —
- DSCR
- —
- Eligible?
- —
No personal income docs; deal must DSCR.
Hard money
10% down · 12.0% · 12mo
- Down + closing
- —
- Monthly P&I
- —
- Monthly cashflow
- —
- DSCR
- —
- Eligible?
- —
Short-term bridge; refi at stabilization.
Rent comps 38 comps
| Address | Beds | Baths | Sqft | Rent | $/sqft | DOM | Units | Dist |
|---|---|---|---|---|---|---|---|---|
| 317 Mabry St Tallahassee, FL | 2.0 | 1.0 | 808 | $898 | $1.11 | 21d | 1 | 0.11mi |
| 2202 W Pensacola St Tallahassee, FL | 1.0–3.0 | 1.0 | 950 | $1,224 | $1.29 | 21d | 3 | 0.12mi |
| 205 White Dr Tallahassee, FL | 1.0–4.0 | 1.0–4.0 | 1155 | $637 | $0.55 | 21d | 1 | 0.25mi |
| 316 Ausley Rd Tallahassee, FL | 1.0–4.0 | 1.0–2.0 | 750 | $798 | $1.06 | 14d | 8 | 0.36mi |
| 2131 Jackson Bluff Rd Tallahassee, FL | 2.0 | 2.0 | 1043 | $1,257 | $1.21 | 14d | 3 | 0.51mi |
| 103 Cactus St Tallahassee, FL | 2.0–4.0 | 1.0–2.0 | 1000 | $1,195 | $1.20 | 14d | 3 | 0.51mi |
| 2125 Jackson Bluff Rd Tallahassee, FL | 1.0–3.0 | 1.0–2.0 | 975 | $1,172 | $1.20 | 21d | 4 | 0.52mi |
| 2182 Timberwood Cir S Unit 1 Tallahassee, FL | 3.0 | 2.5 | 1280 | $1,599 | $1.25 | 21d | 1 | 0.58mi |
| 2350 Horne Ave Unit 2 Tallahassee, FL | 2.0 | 2.0 | 800 | $995 | $1.24 | 21d | 1 | 0.66mi |
| 301 S Lipona Rd #24 Tallahassee, FL | 2.0 | 1.5 | 896 | $1,350 | $1.51 | 21d | 1 | 0.67mi |
| 1854 Belle Vue Way Tallahassee, FL | 2.0–4.0 | 1.0–2.0 | 1100 | $1,235 | $1.12 | 21d | 1 | 0.72mi |
| 220 Atkinson Dr Unit D Tallahassee, FL | 2.0 | 1.0 | 928 | $1,100 | $1.19 | 21d | 1 | 0.82mi |
| 930 S Lipona Rd Unit D Tallahassee, FL | 2.0 | 2.0 | 896 | $1,295 | $1.45 | 21d | 1 | 0.82mi |
| 1801 Lenora Dr Tallahassee, FL | 3.0 | 1.0 | 1150 | $1,800 | $1.57 | 21d | 1 | 0.85mi |
| 2353 W Mission Rd Tallahassee, FL | 2.0–3.0 | 2.0–2.5 | 1012 | $1,250 | $1.23 | 14d | 11 | 0.92mi |
| 1001 Ocala Rd Tallahassee, FL | 4.0 | 1.0–2.0 | 899 | $584 | $0.65 | 21d | 6 | 0.96mi |
| 1612 Overstreet St Tallahassee, FL | 3.0 | 3.0 | 1500 | $3,300 | $2.20 | 21d | 1 | 1.00mi |
| 322 Conradi St Tallahassee, FL | 3.0 | 2.0 | 1100 | $1,950 | $1.77 | 21d | 4 | 1.09mi |
| 1643 Sharkey St Tallahassee, FL | 3.0 | 1.0 | 912 | $1,350 | $1.48 | 21d | 1 | 1.13mi |
| 1606 Airport Dr Tallahassee, FL | 3.0 | 2.0 | 1008 | $1,395 | $1.38 | 21d | 1 | 1.16mi |
| 2614 W Tennessee St Tallahassee, FL | 1.0–4.0 | 1.0–4.0 | 1270 | $1,159 | $0.91 | 21d | 14 | 1.17mi |
| 1525 W Tennessee St #307 Tallahassee, FL | 2.0 | 1.0 | 1200 | $1,600 | $1.33 | 21d | 1 | 1.21mi |
| 2060 Continental Ave Tallahassee, FL | 1.0–3.0 | 1.0–2.5 | 1121 | $1,052 | $0.94 | 14d | 26 | 1.22mi |
| 1327 Jackson Bluff Rd Tallahassee, FL | 2.0–4.0 | 2.0 | 1450 | $475 | $0.33 | 21d | 1 | 1.22mi |
| 1313 Airport Dr Unit DRE6 Tallahassee, FL | 1.0 | 1.5 | 1100 | $1,300 | $1.18 | 14d | 1 | 1.26mi |
| 2020 Continental Ave Tallahassee, FL | 1.0–2.0 | 1.0–1.5 | 850 | $1,300 | $1.53 | 21d | 3 | 1.26mi |
| 1303 Airport Dr Unit A08 Tallahassee, FL | 2.0 | 2.5 | 1083 | $1,475 | $1.36 | 21d | 1 | 1.28mi |
| 832 Arkansas St Tallahassee, FL | 3.0 | 1.0 | 1296 | $1,400 | $1.08 | 21d | 1 | 1.29mi |
| 770 Appleyard Dr Tallahassee, FL | 2.0 | 2.5 | 1150 | $1,442 | $1.25 | 14d | 14 | 1.29mi |
| 1303 Ocala Rd Tallahassee, FL | 1.0–4.0 | 1.0–2.0 | 1121 | $1,320 | $1.18 | 14d | 48 | 1.31mi |
| 2616 Mission Rd Tallahassee, FL | 1.0–2.0 | 1.0 | 750 | $1,195 | $1.59 | 14d | 12 | 1.31mi |
| 1426 Pepper Dr Tallahassee, FL | 2.0 | 1.0 | 858 | $1,250 | $1.46 | 21d | 1 | 1.33mi |
| 1111 High Rd Tallahassee, FL | 2.0–3.0 | 2.0 | 1000 | $1,409 | $1.41 | 14d | 11 | 1.35mi |
| 1616 McCaskill Ave Tallahassee, FL | 1.0–2.0 | 1.0 | 750 | $969 | $1.29 | 21d | 43 | 1.37mi |
| 1360 Ocala Rd Tallahassee, FL | 2.0 | 1.0 | 800 | $1,000 | $1.25 | 21d | 1 | 1.37mi |
| 1108 Greentree Ct Tallahassee, FL | 2.0 | 2.0 | 888 | $1,275 | $1.44 | 21d | 1 | 1.38mi |
| 1380 Ocala Rd Tallahassee, FL | 1.0 | 1.0 | 700 | $975 | $1.39 | 21d | 1 | 1.38mi |
| 1329 Nylic St #1 Tallahassee, FL | 3.0 | 3.0 | 1275 | $1,800 | $1.41 | 21d | 1 | 1.47mi |
HOA detail condo
- Monthly dues
- $334 · $4,008/yr
- Likely covers
- waterlandscapingpool
- Assessments
- None detected in remarks — confirm with the listing agent.
Listing history 30 events
-
2026-06-18days on market $54,500 Active 90 DOM
-
2026-06-17days on market $54,500 Active 89 DOM
-
2026-06-16days on market $54,500 Active 88 DOM
-
2026-06-15days on market $54,500 Active 87 DOM
-
2026-06-14days on market $54,500 Active 85 DOM
-
2026-06-10days on market $54,500 Active 82 DOM
-
2026-06-09days on market $54,500 Active 81 DOM
-
2026-06-08days on market $54,500 Active 80 DOM
-
2026-06-07days on market $54,500 Active 79 DOM
-
2026-06-05days on market $54,500 Active 76 DOM
-
2026-06-03days on market $54,500 Active 75 DOM
-
2026-06-02days on market $54,500 Active 74 DOM
-
2026-06-01days on market $54,500 Active 73 DOM
-
2026-05-31days on market $54,500 Active 72 DOM
-
2026-05-30days on market $54,500 Active 71 DOM
-
2026-03-20$54,500 Active
-
2026-03-01historical $890
-
2026-01-16historical
-
2026-01-14price $890
-
2026-01-07price $950
-
2025-12-16$975
-
2025-12-03price $66,000
-
2025-11-07status Active
-
2025-11-07price $69,000
-
2025-08-19historical
-
2025-02-19$72,000 Active
-
2018-06-15soldstatus $33,750 324-char remark
Show marketing remark (324 chars)
Wonderful condo priced just right! Cllose to FSU, TCC and Famu. Unit offers a spacious floor plan, plenty of windows that provide lots of light, spacious closets in the bedrooms, and a terrace or balcony for your pleasure. HOA includes Water, Sewage, Pest control, Landscaping, Parking, Use of the pool HOA Fee is 200/month
-
2018-04-10$40,000 324-char remark
Show marketing remark (324 chars)
Wonderful condo priced just right! Cllose to FSU, TCC and Famu. Unit offers a spacious floor plan, plenty of windows that provide lots of light, spacious closets in the bedrooms, and a terrace or balcony for your pleasure. HOA includes Water, Sewage, Pest control, Landscaping, Parking, Use of the pool HOA Fee is 200/month
-
2002-04-01soldstatus $35,000
-
1999-09-08soldstatus $30,600
ⓘ Source: listings_history table (triggers on properties + properties_extension) + one-shot
backfill from property_details.listing_events for pre-trigger history.
Tax reassessment forecast FL · Resets to sale price
- Current annual tax
- $1,031 · $86/mo
- Projected year-2 tax
- $1,031 · $86/mo
- Expected delta
- $0/yr ($0/mo · 0.0%)
ⓘ Screening estimate from a state-policy table — verify with the county assessor before closing.
Climate risk First Street
- Flood 1/10 Low FEMA zone X (unshaded) · 0% chance over 30 yrs
- Wildfire 1/10 Low
- Heat 8/10 Severe 7 d/yr ≥108°F today · 20 d/yr by 30 yrs out
- Wind 9/10 Extreme 99% chance of damaging wind over 30 yrs
- Air quality 4/10 Moderate 5 unhealthy d/yr today · 6 by 30 yrs out
Nearby sold comps map
Loading sold comps map…
Walkable amenities ~0.75 mi
Loading nearby amenities…
Taxation est. · year 1
- Rental income
- $15,304
- − Mortgage interest
- −$3,053
- − Property taxes
- −$1,031
- − Insurance
- −$272
- − Repairs & maintenance
- −$1,224
- − Management
- −$1,224
- − HOA
- −$4,008
- − Depreciation
- −$1,585
- Taxable income
- $2,906
- Est. tax owed @ 24.0%
- −$697
- After-tax cash flow
- $2,652/yr
For passive investors: Depreciation is non-cash, so a rental often shows a tax loss while cash-flowing — sheltering income. Rental losses are passive: they offset passive income freely, and up to $25,000/yr can offset ordinary (W-2) income if you actively participate and your MAGI is under $100k (phasing out to $0 by $150k); unused losses carry forward. On sale, claimed depreciation is recaptured at up to 25%, and gains may owe capital-gains tax (a 1031 exchange can defer both). Figures are a year-1 estimate at your 24.0% rate — not tax advice; consult a CPA.
Schools (NCES district)
- District
- Leon
- NCES district ID
- 1201110
- Math proficiency
- 48% ▼ -13.00%
- Reading proficiency
- 53% ▼ -5.00%
- Median HH income
- $46,339
- Composite
- 42.84/100
- National rank
- #3131
- State rank
- #33 of 73 in FL
Livability — Tallahassee
- Score
- 86/100
- State rank
- #19
- US rank
- #429
Category grades
Schools grade is shown separately in the Schools card above.
Census & demographics
- Census place
- Tallahassee, FL
- County
- Leon County · 294,472 people
- City population
- 294,472
- Metro
- Tallahassee, FL
- Population (ZIP)
- 51,673
- Household income
- $32,348
- Rent vs Own
- Severe rent burden
- 6995.0
Population outlook (Leon County) Hauer SSP2
- Today (2025)
- 315,507 people
- By 2030
- 330,677 · +4.8%
- By 2040
- 358,465 · +13.6%
- By 2050
- 386,804 · +22.6%
- By 2075
- 465,480 · +47.5%
- By 2100
- 519,959 · +64.8%
Race, ethnicity, and origin ACS 2023
- Neighborhood character
- Diverse neighborhood (Simpson 0.65)
- Race & ethnicity
- White 45% Black 36% Hispanic / Latino 10% Two or more races 7% Asian 4%
- Hispanic origin (detail)
- Mexican 2% Puerto Rican 2% Cuban 2%
- Common ancestry
- Romanian 2% Lithuanian 1% Italian 1%
- Foreign-born
- 8% · Canada, China
- Languages at home
- 86% English-only · Spanish 7% Other Indo-European 2% French/Haitian/Cajun 1%
Political lean MEDSL · Leon
- 2024 margin
- Strong D (+21.8) · D 60.3% · R 38.5% · Other 1.2%
- 2008→2024 swing
- -2.5pp toward R · 2008: 24.3pp · 2024: 21.8pp
- All cycles
- 2024: D+21.8 2020: D+28.3 2016: D+25.1 2012: D+23.6 2008: D+24.3
Not yet ingested
- Civics
- —
Market trends
- HPI YoY
- ▼ -72.04%
- Current HPI
- 267.8426
- Rent YoY
- ▲ 4.69%
- Metro
- Tallahassee, FL
- State GDP YoY
- ▲ 3.28%
- F500 in state
- 36
Industry mix (Fortune 500 HQ in FL)
| Industry | F500 HQs | Revenue |
|---|---|---|
| Industrial Technology | 2 | $29B |
|
||
| Insurance | 2 | $17B |
|
||
| Retail | 1 | $60B |
|
||
| Technology Distribution | 1 | $58B |
|
||
| Homebuilding | 1 | $35B |
|
||
| Technology Manufacturing | 1 | $35B |
|
||
Price history
+78.1% since first listed15 events — show timeline
- 2026-03-20 Listed $54,500 CATRS
- 2026-03-01 Rental Removed $890 TENANTTURNER2
- 2026-01-16 Listing Removed — CATRS
- 2026-01-14 Price Changed $890 TENANTTURNER2
- 2026-01-07 Price Changed $950 TENANTTURNER2
- 2025-12-16 Listed for Rent $975 TENANTTURNER2
- 2025-12-03 Price Changed $66,000 CATRS
- 2025-11-07 Relisted — CATRS
- 2025-11-07 Price Changed $69,000 CATRS
- 2025-08-19 Listing Removed — CATRS
- 2025-02-19 Listed $72,000 CATRS
- 2018-06-15 Sold (MLS) $33,750 CATRS
- 2018-04-10 Listed $40,000 CATRS
- 2002-04-01 Sold (Public Records) $35,000 Public Records
- 1999-09-08 Sold (Public Records) $30,600 Public Records
Property tax history
+4.1%/yrLatest (2025): $1,031 · +9.2% YoY. Source: county tax records.
Cash-flow waterfall
monthlySold comps — $/sqft
last 12 mo · ≤1 miLoading sold comps…