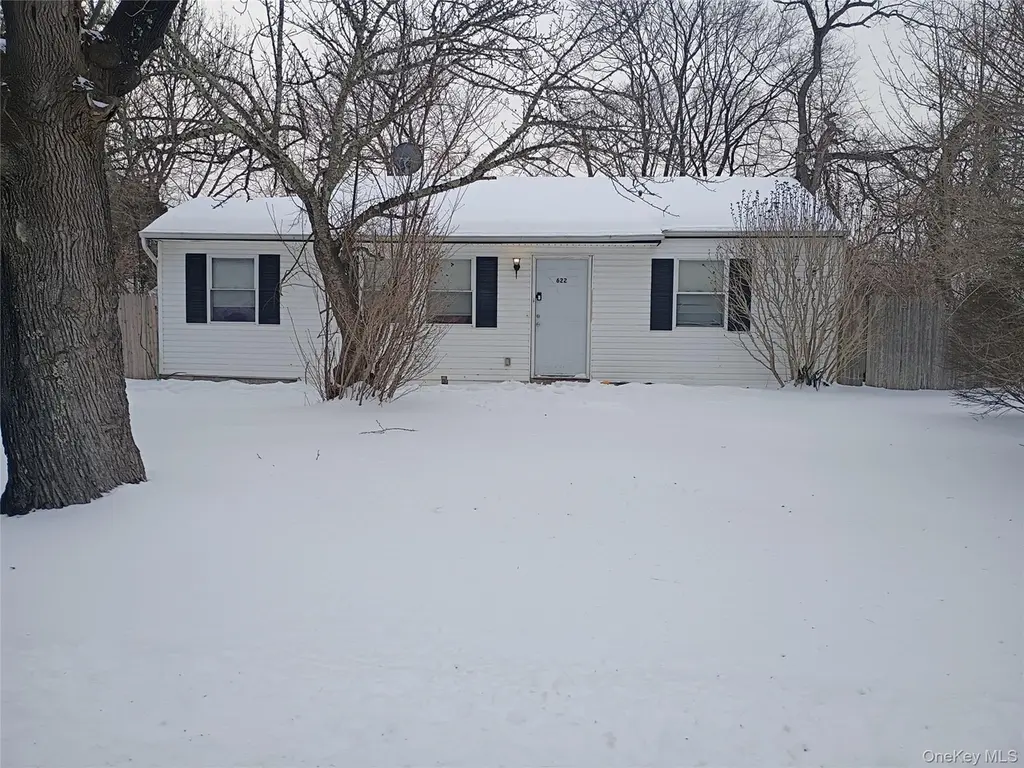
622 Post Ave · North Bellport, NY
Flood risk 4/10 · Minor
- FEMA flood zone
- X (unshaded)
- Chance of flooding over 30 yrs
- 0.22%
- Est. flood insurance / yr
- $473 – $860
Fire risk 4/10 · Minor
- Est. fire insurance / yr
- $691 – $1,283
Heat risk 4/10 · Minor
- Hot days now (above 93°F)
- 7 days/yr
- Hot days in 30 yrs
- 18 days/yr
Wind risk 8/10 · Major
- Chance of severe wind over 30 yrs
- 80.0%
Air-quality risk 4/10 · Minor
- Unhealthy air days now
- 3 days/yr
- Unhealthy air days in 30 yrs
- 5 days/yr
Risk factors via First Street. Map © Google.
Why this score? — see what drove the C- grade
The composite is a weighted blend of 9 inputs, each scored 0–100. Each bar is that input's sub-score; the figure is the points it added to the 100-point composite (weight × sub-score).
- Cash flow +18.0/30.0
- ARV discount +12.3/15.0
- DSCR +5.7/10.0
- Schools +4.5/10.0
- 1% rule +3.5/10.0
- Livability +3.1/5.0
- Rent growth +2.5/5.0
- Condition / age +2.5/5.0
- Appreciation +0.0/10.0
$399,000
🖨 Deal sheet (PDF) 📄 Offer letter ✓ Due diligence
Listing remarks MLS
Calling all investors! Clean Ranch with Low taxes are an added bonus to this 3br maintenance free Ranch that is currently being rented to CDC Section 8 occupants @ $3,450 per month. Tenant would like to stay! Close on this investment and start earning income immediately! Valid rental permit for 6ppl MAX , recently updated. Close to the Newly erected Boys and Girls Club, LIRR, Shopping and Major roadways. South Country School district, verify all info supplied. Not in flood zone. Seller makes no representations. Fenced yard, mid block location. Great opportunity!
Key facts
- Valid rental permit
- Close to lirr
- Fenced yard
Tags
Neighborhood map
What this means for you Summary
Snapshot
- This is a 3-bed/1.0-bath single-family listed at $399k.
Deal economics
- At list price, monthly cash flow is $346 ($4k/yr) — positive.
- The deal already cash-flows at list — no discount required.
- To meet the 1% rule (rent ≥ 1% of price), the offer needs to be $341k (14.5% below list).
- Recommended offer: $341k (14.5% below list) — sets the bar for 1% rule.
- Cap rate 7.3% vs local median 4.9% in North Bellport — top-decile yield for the area; either an underpriced asset or a hidden risk that comps aren't pricing in. Stress-test before assuming the spread holds.
Location & tenants
- Location reads 62/100 on livability (#842 in NY) — a middle-class / working-renter tenant base. Strengths: employment A+, housing A+; Watch: crime C-, amenities F, commute F.
- South Country Central School District (suburban): math 50% / reading 44% proficiency, ranked #460 of 755 in NY (top 61%) — families likely to look elsewhere, expect single-tenant / working-renter base with shorter leases.
- Zoned schools: Brookhaven Elementary School (506 students, 41% FRL); Bellport Middle School (math 64% / reading 54%, grade B, #161 of 729 statewide, top 24%, 838 students, 56% FRL); Bellport Senior High School (math 86% / reading 64%, grade A-, #630 of 1,100 statewide, top 57%, 1,392 students, 52% FRL).
- Zoned-school proficiency averages 67% at this address vs 47% district-wide (+20 pts) — the actual schools serving this property are materially stronger than the South Country Central School District average implies; a family-tenant draw the district grade alone would hide.
- Market conditions: 58 active listings in the ZIP; 7 comparable units currently listed for rent nearby; rentals lingering (median 45d on market — plan ~5-8 weeks vacancy on turnover, expect pricing pressure); 57% of comp listings sitting > 30 days — soft ceiling on asking rent; 1,366 units permitted in Suffolk County in 2024 (216 in 5+ unit buildings).
Forward outlook
- Local home prices are declining (-3.0%/yr); year-one equity from $3k of loan paydown is wiped out by about $12k of value loss. Plan a longer hold.
- Suffolk County population projected to shrink 5% by 2050 — rents likely to lag national; underwrite the cash flow, not the appreciation.
Negotiation context
- It's been on market 145 days — a 12% lower offer ($351k) is reasonable based on typical stale-listing flexibility.
- 2 sale attempts since 2y ago with the ask held roughly flat each time — persistent listings suggest the price (not the market) is what's stuck; bring a comps-based counter.
Risks & watch-outs
- Watch-outs: built in 1959 — expect roof / HVAC / electrical / plumbing capex.
- Climate carrying-cost: severe wind risk, 80% chance of damaging wind over 30y — expect insurance premiums to compound above CPI over the hold.
Questions for the listing agent
- It's been on market 145 days. Have you received any prior offers? Is the seller open to a 15% concession, seller financing, or rate buy-down credit?
- Built in 1959 — when were the roof, HVAC, electrical panel, plumbing, and water heater last replaced?
- Why hasn't it sold? Are there any deal-killer items the seller is aware of (foundation, flood, title, zoning, code violations)?
- Is there a deadline driving the sale (1031 exchange, divorce, estate, relocation)? That informs how much negotiation room exists.
- Schools are F-rated, which usually means shorter tenancies and higher turnover. Who's the typical renter profile here, and what's been the actual vacancy rate?
- What's the average days-on-market for RENTAL listings here right now (not sales)? A rising rental-DOM trend means longer vacancies and softer asking-rent achievability than the comps imply.
- What's the recent tenant-quality profile in this submarket — average credit score on applications, eviction rate, late-payment / NSF rate, and stable-employment percentage? A property-management company in the area should have these aggregated.
- How much new for-sale + rental construction is in the pipeline within 1–3 miles? Heavy new supply typically softens prices + rents 12–24 months out; constrained supply supports both.
Investment metrics
- 1% rule
- 0.85% ✗
- Cap rate
- 7.33%
- Cash-on-cash
- 3.72%
- DSCR
- 1.17
- GRM
- 9.8
CMA / ARV
- ARV (median comp)
- $446,247
- List price
- $399,000
- Delta
- -10.59%
- Verdict
- UNDERPRICED
- Comps
- 20 within 1.0 mi
Show comp detail 12 sales within ~0.75 mi
| Address | Dist | Beds/Ba | Sqft | Sold | Price | $/sf | Match |
|---|---|---|---|---|---|---|---|
| 609 Michigan Ave | 0.04mi | 3/1.0 | 968 (+4%) | 7mo | $419,000 | $433 | 86 |
| 717 Doane Ave | 0.20mi | 3/1.0 | 896 (-4%) | 1mo | $444,000 | $496 | 83 |
| 743 Hoffman Ave | 0.28mi | 3/1.0 | 896 (-4%) | 2mo | $240,000 | $268 | 79 |
| 603 Doane Ave | 0.13mi | 3/1.0 | 836 (-10%) | 2mo | $410,000 | $490 | 75 |
| 833 Doane Ave | 0.37mi | 3/1.0 | 950 (+2%) | 9mo | $415,000 | $437 | 72 |
| 506 Scherger Ave | 0.70mi | 4/1.0 (+1) | 908 (-3%) | 4mo | $455,000 | $501 | 55 |
| 941 Provost Ave | 0.72mi | 3/1.0 | 964 (+3%) | 9mo | $400,000 | $415 | 53 |
| 623 Meade Ave | 0.53mi | 3/1.0 | 850 (-9%) | 9mo | $355,000 | $418 | 53 |
| 635 Provost Ave | 0.49mi | 4/1.0 (+1) | 1,045 (+12%) | 3mo | $447,000 | $428 | 49 |
| 656 Scherger Ave | 0.67mi | 3/1.0 | 828 (-11%) | 7mo | $463,500 | $560 | 44 |
| 803 Meade Ave | 0.61mi | 3/1.0 | 792 (-15%) | 3mo | $440,000 | $556 | 44 |
| 917 Provost Ave | 0.68mi | 3/1.0 | 800 (-14%) | 8mo | $350,000 | $438 | 38 |
Match score weights: distance 35% · size 25% · config 20% · recency 20%. Top-matched comps best support the ARV.
Projected returns pro-forma
-3.0% appreciation · 3.0% rent growth · sell at horizon
- IRR
- -10.5%
- Equity multiple
- 0.62×
- Total profit
- $-42,797
- Equity at exit
- $59,492
- IRR
- -1.3%
- Equity multiple
- 0.91×
- Total profit
- $-9,677
- Equity at exit
- $34,498
Cash invested: $111,720 (down + closing). Projections, not guarantees.
Landlord ↔ Tenant lean methodology
- Overall (STATE)
- 15 Strongly Tenant-Friendly
- State New York
- 15 Strongly Tenant-Friendly · D+10
- County
- — inherits STATE
- City
- — inherits STATE
ZIP-level market 11713
- Home prices YoY
- -26.0%
- Active inventory
- 58
- Price-to-rent
- 9.8×
Monthly cashflow live
- Estimated rent
- $3,410 high interval (Pro) →
- Mortgage (P&I)
- −$2,092
- Tax from tax record
- −$89 /mo · $1,066/yr
- Insurance
- −$166
- HOA
- −$0
- Vacancy / Maint / Mgmt
- −$716
- Net cashflow
- $346
Break-even live
Sensitivity live
| Price | -10% $572 | -5% $459 | +0% $346 | +5% $233 | +10% $120 |
|---|---|---|---|---|---|
| Rent | -10% $77 | -5% $212 | +0% $346 | +5% $481 | +10% $616 |
| Rate | -1.0pp $547 | -0.5pp $448 | base $346 | +0.5pp $243 | +1.0pp $138 |
UW: 25.0% down · 7.5% · 30yr · 1.5% tax · 5.0% vac · 8.0% maint · 8.0% mgmt
Financing live
Cash to close
- Down payment
- $99,750
- Closing costs
- $11,970
- Reserves months
- —
- Total cash needed
- —
Loan-product check · same deal, 3 products live
Conventional
25% down · 7.5% · 30yr
- Down + closing
- —
- Monthly P&I
- —
- Monthly cashflow
- —
- DSCR
- —
- Eligible?
- —
Personal DTI + credit; lowest rate.
DSCR
20% down · 8.5% · 30yr
- Down + closing
- —
- Monthly P&I
- —
- Monthly cashflow
- —
- DSCR
- —
- Eligible?
- —
No personal income docs; deal must DSCR.
Hard money
10% down · 12.0% · 12mo
- Down + closing
- —
- Monthly P&I
- —
- Monthly cashflow
- —
- DSCR
- —
- Eligible?
- —
Short-term bridge; refi at stabilization.
Rent comps 7 comps
| Address | Beds | Baths | Sqft | Rent | $/sqft | DOM | Units | Dist |
|---|---|---|---|---|---|---|---|---|
| 640 Post Ave Bellport, NY | 3.0 | 1.0 | 1024 | $3,400 | $3.32 | 0d | 1 | 0.04mi |
| 655 Post Ave Bellport, NY | 3.0 | 1.0 | 1008 | $3,350 | $3.32 | 11d | 1 | 0.07mi |
| 849 Walker Ave Bellport, NY | 3.0 | 1.0 | 884 | $3,500 | $3.96 | 6d | 1 | 0.39mi |
| 718 Provost Ave Bellport, NY | 4.0 | 1.0 | 1100 | $4,000 | $3.64 | 45d | 1 | 0.55mi |
| 47 Station Rd Bellport, NY | 2.0 | 1.0 | 1104 | $3,500 | $3.17 | 45d | 1 | 1.19mi |
| 152 S Country Rd Unit B Bellport, NY | 2.0 | 1.0 | 900 | $2,900 | $3.22 | 45d | 1 | 1.44mi |
| 19 Bellport Ln #1 Bellport, NY | 2.0 | 1.0 | 980 | $3,100 | $3.16 | 45d | 1 | 1.49mi |
Listing history 22 events
-
2026-06-21days on market $399,000 Active 145 DOM
-
2026-06-18days on market $399,000 Active 142 DOM
-
2026-06-17days on market $399,000 Active 141 DOM
-
2026-06-16days on market $399,000 Active 140 DOM
-
2026-06-15days on market $399,000 Active 139 DOM
-
2026-06-13days on market $399,000 Active 137 DOM
-
2026-06-13days on market $399,000 Active 136 DOM
-
2026-06-09days on market $399,000 Active 133 DOM
-
2026-06-08days on market $399,000 Active 132 DOM
-
2026-06-07days on market $399,000 Active 131 DOM
-
2026-06-04days on market $399,000 Active 128 DOM
-
2026-06-03days on market $399,000 Active 127 DOM
-
2026-06-02days on market $399,000 Active 126 DOM
-
2026-06-01days on market $399,000 Active 125 DOM
-
2026-05-31days on market $399,000 Active 124 DOM
-
2026-01-27$399,000 Active 568-char remark
Show marketing remark (568 chars)
Calling all investors! Clean Ranch with Low taxes are an added bonus to this 3br maintenance free Ranch that is currently being rented to CDC Section 8 occupants @ $3,450 per month. Tenant would like to stay! Close on this investment and start earning income immediately! Valid rental permit for 6ppl MAX , recently updated. Close to the Newly erected Boys and Girls Club, LIRR, Shopping and Major roadways. South Country School district, verify all info supplied. Not in flood zone. Seller makes no representations. Fenced yard, mid block location. Great opportunity!
-
2024-08-27soldstatus $368,233
-
2024-08-05soldstatus $361,013 Closed 102-char remark
Show marketing remark (102 chars)
3 Bed, 1 Bath Ranch with Fenced Yard!, Additional information: Appearance:Good,Interior Features:Lr/Dr
-
2024-06-24status Pending 102-char remark
Show marketing remark (102 chars)
3 Bed, 1 Bath Ranch with Fenced Yard!, Additional information: Appearance:Good,Interior Features:Lr/Dr
-
2024-05-24$329,000 Active 102-char remark
Show marketing remark (102 chars)
3 Bed, 1 Bath Ranch with Fenced Yard!, Additional information: Appearance:Good,Interior Features:Lr/Dr
-
2024-05-16historical $329,000 102-char remark
Show marketing remark (102 chars)
3 Bed, 1 Bath Ranch with Fenced Yard!, Additional information: Appearance:Good,Interior Features:Lr/Dr
-
1993-06-08soldstatus $11,000
ⓘ Source: listings_history table (triggers on properties + properties_extension) + one-shot
backfill from property_details.listing_events for pre-trigger history.
Tax reassessment forecast NY · Partial reset (capped growth)
- Current annual tax
- $1,066 · $89/mo
- Projected year-2 tax
- $3,904 · $325/mo
- Expected delta
- +$2,839/yr (+$237/mo · 266.4%)
ⓘ Screening estimate from a state-policy table — verify with the county assessor before closing.
Climate risk First Street
- Flood 4/10 Moderate FEMA zone X (unshaded) · 22% chance over 30 yrs
- Wildfire 4/10 Moderate
- Heat 4/10 Moderate 7 d/yr ≥93°F today · 18 d/yr by 30 yrs out
- Wind 8/10 Severe 80% chance of damaging wind over 30 yrs
- Air quality 4/10 Moderate 3 unhealthy d/yr today · 5 by 30 yrs out
Nearby sold comps map
Loading sold comps map…
Walkable amenities ~0.75 mi
Loading nearby amenities…
Taxation est. · year 1
- Rental income
- $40,919
- − Mortgage interest
- −$22,350
- − Property taxes
- −$1,066
- − Insurance
- −$1,995
- − Repairs & maintenance
- −$3,273
- − Management
- −$3,273
- − Depreciation
- −$11,607
- Taxable loss
- −$2,647
- Est. tax savings @ 24.0%
- +$635
- After-tax cash flow
- $4,791/yr
For passive investors: Depreciation is non-cash, so a rental often shows a tax loss while cash-flowing — sheltering income. Rental losses are passive: they offset passive income freely, and up to $25,000/yr can offset ordinary (W-2) income if you actively participate and your MAGI is under $100k (phasing out to $0 by $150k); unused losses carry forward. On sale, claimed depreciation is recaptured at up to 25%, and gains may owe capital-gains tax (a 1031 exchange can defer both). Figures are a year-1 estimate at your 24.0% rate — not tax advice; consult a CPA.
Schools (NCES district)
- District
- South Country Central School District
- NCES district ID
- 3600008
- Math proficiency
- 50% ▲ 4.00%
- Reading proficiency
- 44% ▲ 4.00%
- Median HH income
- $74,049
- Composite
- 44.75/100
- National rank
- #5960
- State rank
- #460 of 755 in NY
Livability — North Bellport
- Score
- 62/100
- State rank
- #842
- US rank
- #16345
Category grades
Schools grade is shown separately in the Schools card above.
Census & demographics
- Census place
- North Bellport, NY
- City population
- 9,236
- Population (ZIP)
- 9,236
Population outlook (Suffolk County) Hauer SSP2
- Today (2025)
- 1,505,262 people
- By 2030
- 1,498,318 · -0.5%
- By 2040
- 1,471,101 · -2.3%
- By 2050
- 1,424,848 · -5.3%
- By 2075
- 1,337,157 · -11.2%
- By 2100
- 1,217,720 · -19.1%
Race, ethnicity, and origin ACS 2023
- Neighborhood character
- Diverse neighborhood (Simpson 0.64)
- Race & ethnicity
- White 50% Hispanic / Latino 30% Black 14% Two or more races 10% Asian 2%
- Hispanic origin (detail)
- Mexican 2% Puerto Rican 3% Dominican 1%
- Common ancestry
- Romanian 4% Italian 1% Lithuanian 1%
- Foreign-born
- 23% · Canada, Jamaica, China
- Languages at home
- 72% English-only · Spanish 23% Other Indo-European 3%
Political lean MEDSL · Suffolk
- 2024 margin
- Lean R (+10.0) · D 45.0% · R 55.0%
- 2008→2024 swing
- -16.0pp toward R · 2008: 6.0pp · 2024: -10.0pp
- All cycles
- 2024: R+10.0 2020: R+0.0 2016: R+8.2 2012: D+2.9 2008: D+6.0
Not yet ingested
- Civics
- —
Market trends
- HPI YoY
- ▼ -148.23%
- Current HPI
- 421.2165
- Rent YoY
- —
- Metro
- —
- State GDP YoY
- ▲ 2.60%
- F500 in state
- 92
Industry mix (Fortune 500 HQ in NY)
| Industry | F500 HQs | Revenue |
|---|---|---|
| Financial Services | 10 | $950B |
|
||
| Consumer Goods | 9 | $162B |
|
||
| Insurance | 4 | $225B |
|
||
| Telecommunications | 2 | $144B |
|
||
| Pharmaceuticals | 2 | $112B |
|
||
| Media / Entertainment | 2 | $69B |
|
||
Price history
+3527.3% since first listed7 events — show timeline
- 2026-01-27 Listed $399,000 OneKey® MLS as Distributed by MLS Grid
- 2024-08-27 Sold (Public Records) $368,233 Public Records
- 2024-08-05 Sold (MLS) $361,013 OneKey® MLS as Distributed by MLS Grid
- 2024-06-24 Pending — OneKey® MLS as Distributed by MLS Grid
- 2024-05-24 Listed $329,000 OneKey® MLS as Distributed by MLS Grid
- 2024-05-16 Coming Soon $329,000 OneKey® MLS as Distributed by MLS Grid
- 1993-06-08 Sold (Public Records) $11,000 Public Records
Property tax history
-0.0%/yrLatest (2025): $1,066 · +0.0% YoY. Source: county tax records.
Cash-flow waterfall
monthlySold comps — $/sqft
last 12 mo · ≤1 miLoading sold comps…