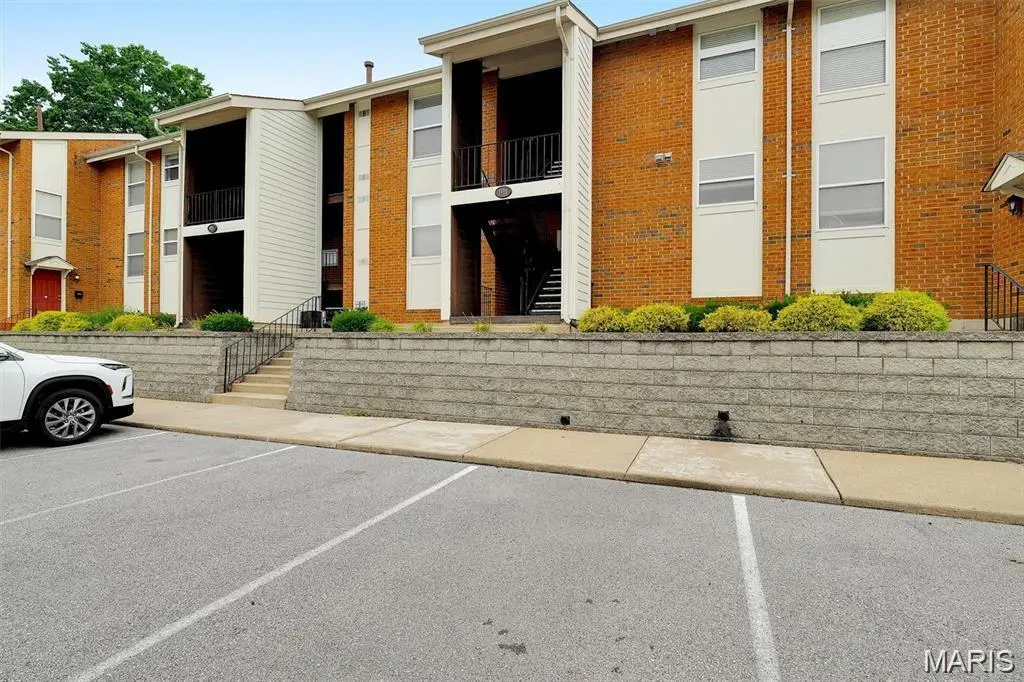
1989 Hunting Lake Ct #303 · Kirkwood, MO
Flood risk 1/10 · Minimal
- FEMA flood zone
- X (unshaded)
- Chance of flooding over 30 yrs
- 0.0%
- Est. flood insurance / yr
- $507 – $1,088
Fire risk 1/10 · Minimal
- Est. fire insurance / yr
- $1,054 – $1,958
Heat risk 5/10 · Moderate
- Hot days now (above 106°F)
- 7 days/yr
- Hot days in 30 yrs
- 21 days/yr
Wind risk 2/10 · Minimal
- Chance of severe wind over 30 yrs
- 1.0%
Air-quality risk 3/10 · Minor
- Unhealthy air days now
- 2 days/yr
- Unhealthy air days in 30 yrs
- 4 days/yr
Risk factors via First Street. Map © Google.
Why this score? — see what drove the D grade
The composite is a weighted blend of 9 inputs, each scored 0–100. Each bar is that input's sub-score; the figure is the points it added to the 100-point composite (weight × sub-score).
- Cash flow +13.1/30.0
- 1% rule +6.0/10.0
- Schools +5.7/10.0
- Rent growth +4.2/5.0
- DSCR +3.9/10.0
- Livability +3.9/5.0
- ARV discount +3.2/15.0
- Condition / age +2.5/5.0
- Appreciation +0.0/10.0
$155,000
🖨 Deal sheet (PDF) 📄 Offer letter ✓ Due diligence
Listing remarks
Welcome to this beautifully updated 2-bedroom, 2-bath condo in sought-after Kirkwood! This move-in ready unit features fresh paint throughout, luxury vinyl flooring throughout, new stainless steel appliances, and two new bathroom vanities. The spacious open-concept living and dining area offers a comfortable layout for everyday living and entertaining. The kitchen provides ample cabinet space and a refreshed modern feel with its new stainless steel appliances. The primary bedroom includes a private en-suite bath and a generous walk-in closet, while the second bedroom is perfect for guests, a home office, or additional living space. Step outside to the ground-level patio, ideal for morning c
Key facts
- Ample cabinet space
- $350 HOA
- Community pool
Tags
Property features AI
Finance
- Financial info: Lease considered
- HOA & community: HOA with monthly fee (includes clubhouse and pool); Community amenities: clubhouse, pool, fitness center, basketball court, tennis courts, trails; Community of 6 units
Exterior
- Parking: Assigned off-street parking
- Utilities: Public water; Public sewer; Electric service by Ameren; Electricity available
- Home design: Residential condominium; Attached unit; Three or more levels
- Construction: Concrete construction
- Exterior features: Deck; In-ground pool; Panel doors
Interior
- Kitchen: Dishwasher; Disposal; Microwave; Range
- Bedrooms: 2 bedrooms (both on main level)
- Flooring: Hardwood
- Bathrooms: 2 full bathrooms (both on main level)
- Heating & cooling: Forced air heating (electric); Central air conditioning; Ceiling fan(s)
- Interior features: Open floorplan; Storage space in basement
- Laundry & utility: Electric water heater
Neighborhood map
What this means for you Summary
Snapshot
- This is a 2-bed/2.0-bath condo listed at $155k.
Deal economics
- At list price, monthly cash flow is $-6 ($-77/yr) — negative.
- To cash-flow at today's rent, offer at most $154k (0.7% below list).
- Meets the 1% rule at list price ($2k rent vs $155k).
- Recommended offer: $150k (3.0% below list) — sets the bar for market timing.
- Cap rate 6.2% vs local median 2.4% in Kirkwood — top-decile yield for the area; either an underpriced asset or a hidden risk that comps aren't pricing in. Stress-test before assuming the spread holds.
Location & tenants
- Location reads 78/100 on livability (#27 in MO, #2,478 nationally) — a middle-class / working-renter tenant base. Strengths: employment A+, housing A+, crime B; Watch: cost of living C-, commute F.
- Kirkwood R-VII (suburban): math 57% / reading 68% proficiency, ranked #5 of 324 in MO (top 2%) — acceptable for families but not a draw, mixed tenant base, ~2y average lease; only 11% free/reduced lunch — higher-income household profile.
- Zoned schools: George R. Robinson Elem. (math 47% / reading 63%, grade C, #185 of 1,115 statewide, top 17%, 493 students, 17% FRL); Nipher Middle (math 52% / reading 63%, grade B, #30 of 391 statewide, top 8%, 673 students, 11% FRL); Kirkwood Sr. High (math 72% / reading 79%, grade A-, #3 of 521 statewide, top 0%, 1,775 students, 11% FRL) — zoned schools at 13% FRL track the district average.
- Market conditions: Rents rising fast (+6.6%/yr); 214 active listings in the ZIP; 7 comparable units currently listed for rent nearby; rentals leasing fast (median 1d on market — plan ~1-2 weeks tenant-placement turnaround); high-income renter base; 920 units permitted in St. Louis County in 2024 (250 in 5+ unit buildings).
- This rent is only 15% of the median local income ($136k/yr) — well below the 30% rent-burden line; pricing power to push rent on renewal without tenant pushback.
Forward outlook
- Local home prices are declining (-3.0%/yr); year-one equity from $1k of loan paydown is wiped out by about $5k of value loss. Plan a longer hold.
Negotiation context
- It's been on market 43 days — a 3% lower offer ($150k) is reasonable based on typical stale-listing flexibility.
- Current owner paid $99k; list at $155k implies a 57% gain — meaningful room to come down on a strong offer.
Risks & watch-outs
- Watch-outs: HOA is 21% of rent.
- Climate carrying-cost: extreme-heat days projected 7→21/yr by 2055 (HVAC capex compounding) — expect insurance premiums to compound above CPI over the hold.
Questions for the listing agent
- What do current leases actually rent for vs. the listed asking? Can we see a recent rent roll and the last 12 months of T-12 income?
- It's been on market 43 days. Have you received any prior offers? Is the seller open to a 3% concession, seller financing, or rate buy-down credit?
- Built in 1967 — when were the roof, HVAC, electrical panel, plumbing, and water heater last replaced?
- What does the HOA fee cover, when was the last increase, and are there any pending special assessments or reserve-fund shortfalls?
- Any open or pending special assessments — roof, HVAC, plumbing, elevator, façade? What's the per-unit balance and payoff schedule, and is the seller paying it off at close or rolling it to the buyer?
- Is there a deadline driving the sale (1031 exchange, divorce, estate, relocation)? That informs how much negotiation room exists.
- Schools are A-rated — typically a magnet for longer-tenancy family renters. What's the average tenant stay here, and is there a school-zone premium baked into asking?
- The area grade is low — what's the realistic commute time and amenity access for the typical tenant pool here? Any planned neighborhood developments (good or bad) we should know about?
- What's the average days-on-market for RENTAL listings here right now (not sales)? A rising rental-DOM trend means longer vacancies and softer asking-rent achievability than the comps imply.
- What's the recent tenant-quality profile in this submarket — average credit score on applications, eviction rate, late-payment / NSF rate, and stable-employment percentage? A property-management company in the area should have these aggregated.
- How much new apartment / multifamily construction is in the pipeline within 1–3 miles? Heavy new supply (>2% of stock underway) typically softens rents 12–24 months out; light construction supports rent growth.
Investment metrics
- 1% rule
- 1.10% ✓
- Cap rate
- 6.24%
- Cash-on-cash
- -0.18%
- DSCR
- 0.99
- GRM
- 7.6
CMA / ARV
- ARV (median comp)
- $141,437
- List price
- $155,000
- Delta
- 9.59%
- Verdict
- FAIR
- Comps
- 20 within 1.0 mi
Projected returns pro-forma
-3.0% appreciation · 6.63% rent growth · sell at horizon
- IRR
- -11.5%
- Equity multiple
- 0.56×
- Total profit
- $-18,887
- Equity at exit
- $23,111
- IRR
- 3.3%
- Equity multiple
- 1.28×
- Total profit
- $12,311
- Equity at exit
- $13,402
Cash invested: $43,400 (down + closing). Projections, not guarantees.
Landlord ↔ Tenant lean methodology
- Overall (STATE)
- 81 Strongly Landlord-Friendly
- State Missouri
- 81 Strongly Landlord-Friendly · R+10
- County
- — inherits STATE
- City
- — inherits STATE
ZIP-level market 63122
- Rents YoY
- 6.6%
- Active inventory
- 214
- Price-to-rent
- 7.6×
Monthly cashflow live
- Estimated rent
- $1,702 high interval (Pro) →
- Mortgage (P&I)
- −$813
- Tax from tax record
- −$123 /mo · $1,479/yr
- Insurance
- −$65
- HOA
- −$350
- Vacancy / Maint / Mgmt
- −$357
- Net cashflow
- $-6
Break-even live
Sensitivity live
| Price | -10% $81 | -5% $37 | +0% $-6 | +5% $-50 | +10% $-94 |
|---|---|---|---|---|---|
| Rent | -10% $-141 | -5% $-74 | +0% $-6 | +5% $61 | +10% $128 |
| Rate | -1.0pp $72 | -0.5pp $33 | base $-6 | +0.5pp $-47 | +1.0pp $-87 |
UW: 25.0% down · 7.5% · 30yr · 1.5% tax · 5.0% vac · 8.0% maint · 8.0% mgmt
Financing live
Cash to close
- Down payment
- $38,750
- Closing costs
- $4,650
- Reserves months
- —
- Total cash needed
- —
Loan-product check · same deal, 3 products live
Conventional
25% down · 7.5% · 30yr
- Down + closing
- —
- Monthly P&I
- —
- Monthly cashflow
- —
- DSCR
- —
- Eligible?
- —
Personal DTI + credit; lowest rate.
DSCR
20% down · 8.5% · 30yr
- Down + closing
- —
- Monthly P&I
- —
- Monthly cashflow
- —
- DSCR
- —
- Eligible?
- —
No personal income docs; deal must DSCR.
Hard money
10% down · 12.0% · 12mo
- Down + closing
- —
- Monthly P&I
- —
- Monthly cashflow
- —
- DSCR
- —
- Eligible?
- —
Short-term bridge; refi at stabilization.
Rent comps 7 comps
| Address | Beds | Baths | Sqft | Rent | $/sqft | DOM | Units | Dist |
|---|---|---|---|---|---|---|---|---|
| 1968 Green Glen Dr Kirkwood, MO | 2.0 | 2.0 | 929 | $1,600 | $1.72 | 19d | 1 | 0.02mi |
| 1996 Greenglen Dr #103 Saint Louis, MO | 2.0 | 2.0 | 1015 | $1,700 | $1.67 | 0d | 1 | 0.05mi |
| 1969 Green Glen Dr Kirkwood, MO | 2.0 | 2.0 | 929 | $1,595 | $1.72 | 0d | 1 | 0.05mi |
| 1969 Green Glen Dr Kirkwood, MO | 2.0 | 2.0 | 929 | $1,595 | $1.72 | 9d | 1 | 0.05mi |
| 1937 Greenpoint Dr Kirkwood, MO | 2.0 | 2.0 | 992 | $1,600 | $1.61 | 45d | 1 | 0.10mi |
| 1722 W Woodbine Ave Saint Louis, MO | 2.0 | 1.0 | 898 | $1,395 | $1.55 | 0d | 1 | 0.29mi |
| 1157 Timberbrook Dr Kirkwood, MO | 1.0–3.0 | 1.0–2.5 | 1336 | $1,864 | $1.40 | 0d | 27 | 0.60mi |
HOA detail condo
- Monthly dues
- $350 · $4,200/yr
- Assessments
- None detected in remarks — confirm with the listing agent.
Listing history 17 events
-
2026-06-21days on market $155,000 Active 43 DOM
-
2026-06-18days on market $155,000 Active 40 DOM
-
2026-06-17days on market $155,000 Active 39 DOM
-
2026-06-16days on market $155,000 Active 38 DOM
-
2026-06-15days on market $155,000 Active 37 DOM
-
2026-06-13days on market $155,000 Active 35 DOM
-
2026-06-13days on market $155,000 Active 34 DOM
-
2026-06-09days on market $155,000 Active 31 DOM
-
2026-06-08days on market $155,000 Active 30 DOM
-
2026-06-07days on market $155,000 Active 29 DOM
-
2026-06-03days on market $155,000 Active 25 DOM
-
2026-06-02days on market $155,000 Active 24 DOM
-
2026-06-01days on market $155,000 Active 23 DOM
-
2026-05-31days on market $155,000 Active 22 DOM
-
2026-05-09$155,000 Active 1072-char remark
-
2021-08-09soldstatus $98,900
-
2005-04-28soldstatus $15,750,000
ⓘ Source: listings_history table (triggers on properties + properties_extension) + one-shot
backfill from property_details.listing_events for pre-trigger history.
Tax reassessment forecast MO · Resets to sale price
- Current annual tax
- $1,479 · $123/mo
- Projected year-2 tax
- $1,504 · $125/mo
- Expected delta
- +$25/yr (+$2/mo · 1.7%)
ⓘ Screening estimate from a state-policy table — verify with the county assessor before closing.
Climate risk First Street
- Flood 1/10 Low FEMA zone X (unshaded) · 0% chance over 30 yrs
- Wildfire 1/10 Low
- Heat 5/10 Major 7 d/yr ≥106°F today · 21 d/yr by 30 yrs out
- Wind 2/10 Low 100% chance of damaging wind over 30 yrs
- Air quality 3/10 Moderate 2 unhealthy d/yr today · 4 by 30 yrs out
Nearby sold comps map
Loading sold comps map…
Walkable amenities ~0.75 mi
Loading nearby amenities…
Taxation est. · year 1
- Rental income
- $20,419
- − Mortgage interest
- −$8,682
- − Property taxes
- −$1,479
- − Insurance
- −$775
- − Repairs & maintenance
- −$1,634
- − Management
- −$1,634
- − HOA
- −$4,200
- − Depreciation
- −$4,509
- Taxable loss
- −$2,494
- Est. tax savings @ 24.0%
- +$598
- After-tax cash flow
- $521/yr
For passive investors: Depreciation is non-cash, so a rental often shows a tax loss while cash-flowing — sheltering income. Rental losses are passive: they offset passive income freely, and up to $25,000/yr can offset ordinary (W-2) income if you actively participate and your MAGI is under $100k (phasing out to $0 by $150k); unused losses carry forward. On sale, claimed depreciation is recaptured at up to 25%, and gains may owe capital-gains tax (a 1031 exchange can defer both). Figures are a year-1 estimate at your 24.0% rate — not tax advice; consult a CPA.
Schools (NCES district)
- District
- Kirkwood R-VII
- NCES district ID
- 2916770
- Math proficiency
- 57% ▼ -9.00%
- Reading proficiency
- 68% ▼ -5.00%
- Median HH income
- $85,581
- Composite
- 56.51/100
- National rank
- #1153
- State rank
- #5 of 324 in MO
Livability — Kirkwood
- Score
- 78/100
- State rank
- #27
- US rank
- #2478
Category grades
Schools grade is shown separately in the Schools card above.
Census & demographics
- Census place
- Kirkwood, MO
- County
- Saint Louis County · 888,823 people
- City population
- 41,634
- Metro
- St. Louis, MO-IL
- Population (ZIP)
- 41,634
- Household income
- $136,385
- Rent vs Own
- Severe rent burden
- 738.0
Population outlook (St. Louis County) Hauer SSP2
- Today (2025)
- 1,025,227 people
- By 2030
- 1,028,023 · +0.3%
- By 2040
- 1,020,940 · -0.4%
- By 2050
- 1,007,280 · -1.8%
- By 2075
- 987,277 · -3.7%
- By 2100
- 921,984 · -10.1%
Race, ethnicity, and origin ACS 2023
- Neighborhood character
- Predominantly White (84%)
- Race & ethnicity
- White 84% Two or more races 8% Black 4% Hispanic / Latino 2% Asian 2%
- Common ancestry
- Lithuanian 3% Italian 3% Slovak 3%
- Foreign-born
- 3% · Canada, China
- Languages at home
- 96% English-only · Spanish 1% Other Indo-European 1% Chinese 1%
Political lean MEDSL · St. Louis
- 2024 margin
- Strong D (+23.4) · D 60.8% · R 37.4% · Other 1.7%
- 2008→2024 swing
- +3.5pp toward D · 2008: 19.9pp · 2024: 23.4pp
- All cycles
- 2024: D+23.4 2020: D+24.0 2016: D+16.2 2012: D+13.7 2008: D+19.9
Not yet ingested
- Civics
- —
Market trends
- HPI YoY
- ▼ -413.98%
- Current HPI
- 242.2782
- Rent YoY
- ▲ 6.63%
- Metro
- St. Louis, MO-IL
- State GDP YoY
- ▲ 1.84%
- F500 in state
- 20
Industry mix (Fortune 500 HQ in MO)
| Industry | F500 HQs | Revenue |
|---|---|---|
| Healthcare | 1 | $163B |
|
||
| Insurance | 1 | $21B |
|
||
| Industrial Technology | 1 | $17B |
|
||
| Retail | 1 | $16B |
|
||
| Industrial Distribution | 1 | $10B |
|
||
| Utilities | 1 | $9B |
|
||
Price history
-99.0% since first listed3 events — show timeline
- 2026-05-09 Listed $155,000 MARIS as Distributed by MLS Grid
- 2021-08-09 Sold (Public Records) $98,900 Public Records
- 2005-04-28 Sold (Public Records) $15,750,000 Public Records
Property tax history
+2.0%/yrLatest (2022): $1,479 · +1.3% YoY. Source: county tax records.
Cash-flow waterfall
monthlySold comps — $/sqft
last 12 mo · ≤1 miLoading sold comps…