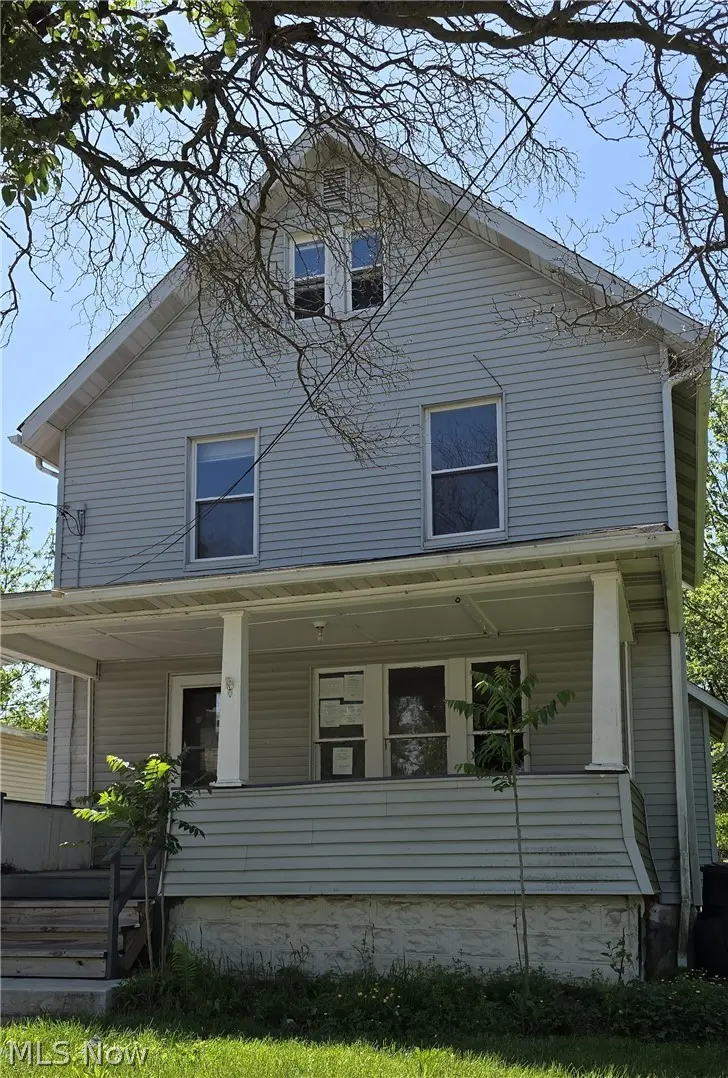
2278 11th St SW · Akron, OH
Flood risk 1/10 · Minimal
- FEMA flood zone
- X (unshaded)
- Chance of flooding over 30 yrs
- 0.0%
- Est. flood insurance / yr
- $473 – $860
Fire risk 1/10 · Minimal
- Est. fire insurance / yr
- $713 – $1,323
Heat risk 3/10 · Minor
- Hot days now (above 96°F)
- 7 days/yr
- Hot days in 30 yrs
- 17 days/yr
Wind risk 1/10 · Minimal
- Chance of severe wind over 30 yrs
- —
Air-quality risk 2/10 · Minimal
- Unhealthy air days now
- 0 days/yr
- Unhealthy air days in 30 yrs
- 1 days/yr
Risk factors via First Street. Map © Google.
Why this score? — see what drove the B- grade
The composite is a weighted blend of 9 inputs, each scored 0–100. Each bar is that input's sub-score; the figure is the points it added to the 100-point composite (weight × sub-score).
- Cash flow +30.0/30.0
- 1% rule +10.0/10.0
- DSCR +10.0/10.0
- ARV discount +7.5/15.0
- Livability +4.0/5.0
- Rent growth +3.5/5.0
- Condition / age +2.5/5.0
- Schools +2.1/10.0
- Appreciation +0.0/10.0
$55,000
🖨 Deal sheet 📄 Offer letter ✓ Due diligence
Listing remarks
Welcome to 2278 11th Street SW in Akron - a spacious and versatile property that is perfect as either an owner-occupied home or an investment opportunity. With approximately 2,000 square feet of finished living space spread across three levels, this home offers room for everyone. The main floor features a spacious living room, a generously sized dining room, and a large kitchen, along with fresh paint and new flooring that create a bright, welcoming atmosphere. Upstairs, you'll find three comfortable bedrooms and a roomy full bath. Two of the bedrooms showcase beautiful hardwood floors, adding warmth and character to the space. A bathroom connected sunroom overlooks the backyard and offers
Key facts
- Finished third floor
- New siding
- Newer roof
Tags
Property features AI
Exterior
- Parking: Driveway parking
- Utilities: Public water; Public sewer
- Home design: Single-family property; Fixer condition
- Construction: Vinyl siding; Shingle roof; Block and stone foundation; Built according to public records
- Exterior features: Driveway
Interior
- Bathrooms: 2 full bathrooms; 1 bathroom on the main level
- Heating & cooling: Gas heating; Central air conditioning
- Interior features: Full basement
Neighborhood map
What this means for you Summary
Snapshot
- This is a 5-bed/1.5-bath single-family listed at $55k.
Deal economics
- At list price, monthly cash flow is $710 ($9k/yr) — positive.
- The deal already cash-flows at list — no discount required.
- Meets the 1% rule at list price ($2k rent vs $55k).
- Cap rate 21.8% vs local median 6.6% in Akron — top-decile yield for the area; either an underpriced asset or a hidden risk that comps aren't pricing in. Stress-test before assuming the spread holds.
Location & tenants
- Location reads 81/100 on livability (#104 in OH, #1,591 nationally) — a professional / high-income tenant draw. Strengths: amenities A+, commute A+, cost of living A+; Watch: crime F, employment F.
- Akron City (urban): math 22% / reading 30% proficiency, ranked #602 of 656 in OH (top 92%) — low school quality limits family demand, transient renter base, plan for 1-2y turnover; 66% free/reduced lunch — lower-income household profile, screen leases tightly.
- Market conditions: Rents rising (+3.9%/yr); 104 active listings in the ZIP; 4 comparable units currently listed for rent nearby; rentals lingering (median 44d on market — plan ~5-8 weeks vacancy on turnover, expect pricing pressure); 50% of comp listings sitting > 30 days — soft ceiling on asking rent; 1,114 units permitted in Summit County in 2024 (397 in 5+ unit buildings).
- This rent runs 38% of the median local income ($47k/yr) — at the standard rent-burdened threshold; future hikes will face affordability resistance.
Forward outlook
- Local home prices are declining (-3.0%/yr); year-one equity from $380 of loan paydown is wiped out by about $2k of value loss. Plan a longer hold.
- Summit County population projected to shrink 6% by 2050 — rents likely to lag national; underwrite the cash flow, not the appreciation.
- At projected returns (-3.0% appreciation + 3.9% rent growth), your $15k cash investment doubles in ~3 years — after that, you're playing with house money.
Negotiation context
- Only 4 days on market — expect competitive offers; lowballing is unlikely to land.
- 15 sale attempts since 24y ago with the ask held roughly flat each time — persistent listings suggest the price (not the market) is what's stuck; bring a comps-based counter.
Risks & watch-outs
- Watch-outs: property tax is 3.9% of price; built in 1919 — expect roof / HVAC / electrical / plumbing capex.
Questions for the listing agent
- Built in 1919 — when were the roof, HVAC, electrical panel, plumbing, and water heater last replaced?
- Property tax is high relative to price — has the assessment been appealed recently, and will the sale trigger a re-assessment?
- Is there a deadline driving the sale (1031 exchange, divorce, estate, relocation)? That informs how much negotiation room exists.
- Crime grade is F in this area — have there been break-ins, vandalism, or insurance claims at this property in the last 3 years? What carrier currently insures it and at what premium?
- What's the average days-on-market for RENTAL listings here right now (not sales)? A rising rental-DOM trend means longer vacancies and softer asking-rent achievability than the comps imply.
- What's the recent tenant-quality profile in this submarket — average credit score on applications, eviction rate, late-payment / NSF rate, and stable-employment percentage? A property-management company in the area should have these aggregated.
- How much new for-sale + rental construction is in the pipeline within 1–3 miles? Heavy new supply typically softens prices + rents 12–24 months out; constrained supply supports both.
Investment metrics
- 1% rule
- 2.77% ✓
- Cap rate
- 21.79%
- Cash-on-cash
- 55.34%
- DSCR
- 3.46
- GRM
- 3.0
CMA / ARV
- ARV (on-the-fly)
- $117,600
- Comps found
- 12
Show comp detail 12 sales within ~0.75 mi
| Address | Dist | Beds/Ba | Sqft | Sold | Price | $/sf | Match |
|---|---|---|---|---|---|---|---|
| 2273 14th St SW | 0.14mi | 4/1.5 (-1) | 1,656 (+6%) | 8mo | $125,000 | $75 | 73 |
| 867 Battles Ave | 0.40mi | 4/1.5 (-1) | 1,597 (+2%) | 6mo | $111,900 | $70 | 68 |
| 750 Florida Ave | 0.08mi | 4/2.0 (-1) | 1,445 (-8%) | 12mo | $166,000 | $115 | 66 |
| 2231 13th St SW | 0.13mi | 4/1.0 (-1) | 1,418 (-10%) | 8mo | $100,000 | $71 | 65 |
| 1115 Harpster Ave | 0.65mi | 5/2.0 | 1,565 (-0%) | 7mo | $42,000 | $27 | 61 |
| 2168 10th St SW | 0.22mi | 4/1.0 (-1) | 1,486 (-5%) | 16mo | $118,000 | $79 | 61 |
| 2238 7th St SW | 0.22mi | 4/1.0 (-1) | 1,721 (+10%) | 7mo | $93,000 | $54 | 60 |
| 844 Harrison Ave | 0.52mi | 4/2.5 (-1) | 1,505 (-4%) | 10mo | $46,500 | $31 | 52 |
| 898 Iona Ave | 0.50mi | 4/2.0 (-1) | 1,698 (+8%) | 6mo | $51,000 | $30 | 51 |
| 916 Oregon Ave | 0.25mi | 4/1.5 (-1) | 1,373 (-12%) | 16mo | $120,000 | $87 | 50 |
| 1160 Carey Ave | 0.69mi | 5/2.0 | 1,682 (+7%) | 9mo | $139,900 | $83 | 46 |
| 2190 21st St SW | 0.56mi | 4/1.0 (-1) | 1,403 (-10%) | 7mo | $123,000 | $88 | 44 |
Match score weights: distance 35% · size 25% · config 20% · recency 20%. Top-matched comps best support the ARV.
Projected returns pro-forma
-3.0% appreciation · 3.91% rent growth · sell at horizon
- IRR
- 54.8%
- Equity multiple
- 3.46×
- Total profit
- $37,820
- Equity at exit
- $8,201
- IRR
- 60.3%
- Equity multiple
- 7.33×
- Total profit
- $97,432
- Equity at exit
- $4,755
Cash invested: $15,400 (down + closing). Projections, not guarantees.
Landlord ↔ Tenant lean methodology
- Overall (STATE)
- 73 Landlord-Friendly
- State Ohio
- 73 Landlord-Friendly · R+6
- County
- — inherits STATE
- City
- — inherits STATE
ZIP-level market 44314
- Rents YoY
- 3.9%
- Active inventory
- 104
- Price-to-rent
- 3.0×
Monthly cashflow live
- Estimated rent
- $1,522 medium interval (Pro) →
- Mortgage (P&I)
- −$288
- Tax from tax record
- −$181 /mo · $2,172/yr
- Insurance
- −$23
- HOA
- −$0
- Vacancy / Maint / Mgmt
- −$320
- Net cashflow
- $710
Break-even live
UW: 25.0% down · 7.5% · 30yr · 1.5% tax · 5.0% vac · 8.0% maint · 8.0% mgmt
Financing live
Cash to close
- Down payment
- $13,750
- Closing costs
- $1,650
- Reserves months
- —
- Total cash needed
- —
Loan-product check · same deal, 3 products live
Conventional
25% down · 7.5% · 30yr
- Down + closing
- —
- Monthly P&I
- —
- Monthly cashflow
- —
- DSCR
- —
- Eligible?
- —
Personal DTI + credit; lowest rate.
DSCR
20% down · 8.5% · 30yr
- Down + closing
- —
- Monthly P&I
- —
- Monthly cashflow
- —
- DSCR
- —
- Eligible?
- —
No personal income docs; deal must DSCR.
Hard money
10% down · 12.0% · 12mo
- Down + closing
- —
- Monthly P&I
- —
- Monthly cashflow
- —
- DSCR
- —
- Eligible?
- —
Short-term bridge; refi at stabilization.
Rent comps 4 comps
| Address | Beds | Baths | Sqft | Rent | $/sqft | DOM | Units | Dist |
|---|---|---|---|---|---|---|---|---|
| 786 Florida Ave Akron, OH | 5.0 | 1.0 | 1773 | $1,195 | $0.67 | 43d | 1 | 0.07mi |
| 720 Florida Ave Akron, OH | 4.0 | 1.0 | 1124 | $1,500 | $1.33 | 14d | 1 | 0.17mi |
| 1029 Harpster Ave Akron, OH | 4.0 | 1.0 | 1403 | $1,250 | $0.89 | 14d | 1 | 0.49mi |
| 1641 13th St SW Akron, OH | 5.0 | 2.5 | 1700 | $1,750 | $1.03 | 43d | 1 | 1.24mi |
Listing history 5 events
-
2026-06-03statusdays on market $55,000 Pending 4 DOM
-
2026-06-02days on market $55,000 Active 3 DOM
-
2026-06-01days on market $55,000 Active 2 DOM
-
2026-05-31remarks 699-char remark
-
2026-05-31$55,000 Active 1 DOM
ⓘ Source: listings_history table (triggers on properties + properties_extension) + one-shot
backfill from property_details.listing_events for pre-trigger history.
Tax reassessment forecast OH · Partial reset (capped growth)
- Current annual tax
- $2,172 · $181/mo
- Projected year-2 tax
- $2,172 · $181/mo
- Expected delta
- $0/yr ($0/mo · 0.0%)
ⓘ Screening estimate from a state-policy table — verify with the county assessor before closing.
Climate risk First Street
- Flood 1/10 Low FEMA zone X (unshaded) · 0% chance over 30 yrs
- Wildfire 1/10 Low
- Heat 3/10 Moderate 7 d/yr ≥96°F today · 17 d/yr by 30 yrs out
- Wind 1/10 Low
- Air quality 2/10 Low 0 unhealthy d/yr today · 1 by 30 yrs out
Nearby sold comps map
Loading sold comps map…
Walkable amenities ~0.75 mi
Loading nearby amenities…
Taxation est. · year 1
- Rental income
- $18,267
- − Mortgage interest
- −$3,081
- − Property taxes
- −$2,172
- − Insurance
- −$275
- − Repairs & maintenance
- −$1,461
- − Management
- −$1,461
- − Depreciation
- −$1,600
- Taxable income
- $8,216
- Est. tax owed @ 24.0%
- −$1,972
- After-tax cash flow
- $6,551/yr
For passive investors: Depreciation is non-cash, so a rental often shows a tax loss while cash-flowing — sheltering income. Rental losses are passive: they offset passive income freely, and up to $25,000/yr can offset ordinary (W-2) income if you actively participate and your MAGI is under $100k (phasing out to $0 by $150k); unused losses carry forward. On sale, claimed depreciation is recaptured at up to 25%, and gains may owe capital-gains tax (a 1031 exchange can defer both). Figures are a year-1 estimate at your 24.0% rate — not tax advice; consult a CPA.
Schools (NCES district)
- District
- Akron City
- NCES district ID
- 3904348
- Math proficiency
- 22% ▼ -17.00%
- Reading proficiency
- 30% ▼ -12.00%
- Median HH income
- $33,811
- Composite
- 21.31/100
- National rank
- #8383
- State rank
- #602 of 656 in OH
Livability — Akron
- Score
- 81/100
- State rank
- #104
- US rank
- #1591
Category grades
Schools grade is shown separately in the Schools card above.
Census & demographics
- Census place
- Akron, OH
- County
- Summit County · 440,783 people
- City population
- 174,375
- Metro
- Akron, OH
- Population (ZIP)
- 17,885
- Household income
- $47,468
- Rent vs Own
- Severe rent burden
- 975.0
Population outlook (Summit County) Hauer SSP2
- Today (2025)
- 546,583 people
- By 2030
- 544,028 · -0.5%
- By 2040
- 531,363 · -2.8%
- By 2050
- 514,923 · -5.8%
- By 2075
- 481,765 · -11.9%
- By 2100
- 432,265 · -20.9%
Race, ethnicity, and origin ACS 2023
- Neighborhood character
- Predominantly White (69%)
- Race & ethnicity
- White 69% Black 16% Two or more races 12% Hispanic / Latino 3% Asian 3%
- Common ancestry
- Slovak 2% Romanian 2% Lithuanian 1%
- Foreign-born
- 3% · India, Canada, Philippines
- Languages at home
- 96% English-only · Chinese 2% Russian/Polish/Slavic 1% Spanish 1%
Political lean MEDSL · Summit
- 2024 margin
- Lean D (+7.0) · D 53.0% · R 46.0%
- 2008→2024 swing
- -9.6pp toward R · 2008: 16.6pp · 2024: 7.0pp
- All cycles
- 2024: D+7.0 2020: D+9.6 2016: D+8.2 2012: D+14.8 2008: D+16.6
Not yet ingested
- Civics
- —
Market trends
- HPI YoY
- ▼ -166.61%
- Current HPI
- 151.066
- Rent YoY
- ▲ 3.91%
- Metro
- Akron, OH
- State GDP YoY
- ▲ 1.98%
- F500 in state
- 48
Industry mix (Fortune 500 HQ in OH)
| Industry | F500 HQs | Revenue |
|---|---|---|
| Insurance | 3 | $145B |
|
||
| Industrial Machinery | 3 | $49B |
|
||
| Financial Services | 3 | $24B |
|
||
| Consumer Goods | 2 | $93B |
|
||
| Aerospace / Defense | 2 | $47B |
|
||
| Utilities | 2 | $33B |
|
||
Price history
-31.2% since first listed38 events — show timeline
- 2026-05-30 Listed $55,000 MLSNOW
- 2025-12-31 Listing Removed — MLSNOW
- 2025-08-15 Price Changed $80,000 MLSNOW
- 2025-07-02 Relisted — MLSNOW
- 2025-06-30 Relisted — MLSNOW
- 2025-06-30 Listing Removed — MLSNOW
- 2025-06-14 Contingent — MLSNOW
- 2025-01-29 Listed $95,000 MLSNOW
- 2024-12-31 Listing Removed — MLSNOW
- 2024-11-20 Price Changed $99,500 MLSNOW
- 2024-11-15 Relisted — MLSNOW
- 2024-10-18 Pending — MLSNOW
- 2024-10-01 Listed $104,900 MLSNOW
- 2024-09-19 Listing Removed — MLSNOW
- 2024-09-10 Price Changed $104,900 MLSNOW
- 2024-09-08 Price Changed $109,900 MLSNOW
- 2024-09-03 Relisted — MLSNOW
- 2024-08-20 Pending — MLSNOW
- 2024-08-02 Relisted — MLSNOW
- 2024-07-31 Listing Removed — MLSNOW
- 2024-05-18 Price Changed $114,900 MLSNOW
- 2024-04-12 Price Changed $119,900 MLSNOW
- 2024-02-22 Listed $123,000 MLSNOW
- 2022-08-12 Sold (Public Records) $75,000 Public Records
- 2022-08-10 Sold (MLS) $75,000 MLSNOW
- 2022-07-05 Contingent — MLSNOW
- 2022-06-13 Relisted — MLSNOW
- 2022-05-28 Contingent — MLSNOW
- 2022-05-20 Relisted — MLSNOW
- 2022-05-13 Contingent — MLSNOW
- 2022-05-03 Listed $85,000 MLSNOW
- 2003-09-15 Sold (MLS) $58,000 MLSNOW
- 2003-09-15 Sold (MLS) $58,000 MLSNOW
- 2003-09-10 Sold (Public Records) $58,000 Public Records
- 2003-04-23 Listed $71,900 MLSNOW
- 2003-04-23 Listed $71,900 MLSNOW
- 2003-01-27 Listing Removed — MLSNOW
- 2002-07-29 Listed $79,900 MLSNOW
Property tax history
+4.1%/yrLatest (2025): $2,172 · +22.5% YoY. Source: county tax records.
Cash-flow waterfall
monthlySold comps — $/sqft
last 12 mo · ≤1 miLoading sold comps…