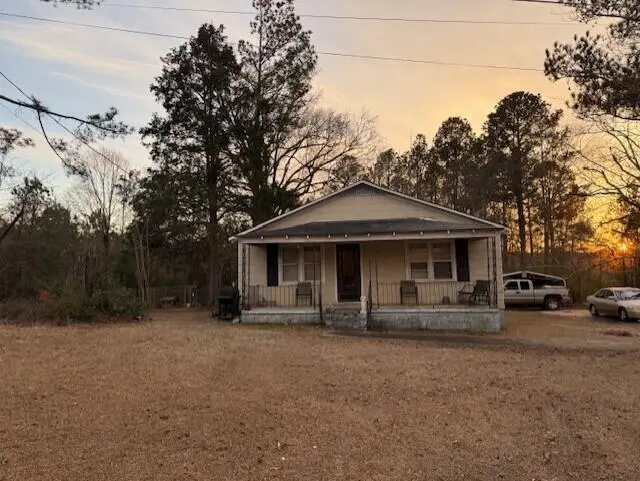
5454 Washington Rd · Evans, GA
Flood risk 1/10 · Minimal
- FEMA flood zone
- X (unshaded)
- Chance of flooding over 30 yrs
- 0.0%
- Est. flood insurance / yr
- $507 – $1,088
Fire risk 4/10 · Minor
- Est. fire insurance / yr
- $963 – $1,789
Heat risk 6/10 · Moderate
- Hot days now (above 107°F)
- 7 days/yr
- Hot days in 30 yrs
- 17 days/yr
Wind risk 6/10 · Moderate
- Chance of severe wind over 30 yrs
- 52.0%
Air-quality risk 2/10 · Minimal
- Unhealthy air days now
- 1 days/yr
- Unhealthy air days in 30 yrs
- 1 days/yr
Risk factors via First Street. Map © Google.
Why this score? — see what drove the C grade
The composite is a weighted blend of 9 inputs, each scored 0–100. Each bar is that input's sub-score; the figure is the points it added to the 100-point composite (weight × sub-score).
- Cash flow +14.8/30.0
- ARV discount +14.0/15.0
- Appreciation +10.0/10.0
- DSCR +4.5/10.0
- Schools +4.5/10.0
- Livability +3.9/5.0
- 1% rule +2.9/10.0
- Rent growth +2.5/5.0
- Condition / age +2.5/5.0
$240,000
🖨 Deal sheet 📄 Offer letter ✓ Due diligence
Listing remarks
Three bedroom Home in Greenbrier School District. Two parcels sold together totaling 9.91 Acres. Needs some TLC but ideal location on almost 10 private acres with no HOA. Great schools, shopping, and so much more. Schedule a tour today!
Key facts
- 9.91 acres
- Private acres
- Two parcels
Tags
Property features AI
Exterior
- Utilities: Public water; Public sewer; Cable available
- Home design: Single-family residence; One level
- Construction: Brick and vinyl siding construction; Block foundation; Composition roof; Built in 2026
- Exterior features: Wooded lot; See remarks for additional lot details
Interior
- Kitchen: Range
- Flooring: Laminate
- Bathrooms: 1 full bathroom
- Heating & cooling: Electric water heater
- Interior features: Range; Electric water heater; Laminate flooring; 5 total rooms; No basement
Neighborhood map
What this means for you Summary
Snapshot
- This is a 3-bed/1.0-bath other listed at $240k.
Deal economics
- At list price, monthly cash flow is $68 ($814/yr) — positive.
- The deal already cash-flows at list — no discount required.
- To meet the 1% rule (rent ≥ 1% of price), the offer needs to be $190k (20.8% below list).
- Recommended offer: $190k (20.8% below list) — sets the bar for 1% rule.
- Cap rate 6.6% vs local median 3.8% in Evans — top-decile yield for the area; either an underpriced asset or a hidden risk that comps aren't pricing in. Stress-test before assuming the spread holds.
Location & tenants
- Location reads 77/100 on livability (#20 in GA, #3,058 nationally) — a middle-class / working-renter tenant base. Strengths: crime A+, employment A+, housing A+; Watch: amenities D+, commute F.
- Columbia County (suburban): math 49% / reading 52% proficiency, ranked #13 of 174 in GA (top 8%) — acceptable for families but not a draw, mixed tenant base, ~2y average lease.
- Zoned schools: Greenbrier Elementary School (math 75% / reading 63%, grade A-, #70 of 1,228 statewide, top 6%, 654 students, 8% FRL); Greenbrier Middle School (math 60% / reading 72%, grade A-, #25 of 470 statewide, top 5%, 845 students, 12% FRL); Greenbrier High School (math 39% / reading 36%, grade F, #65 of 424 statewide, top 16%, 1,801 students, 12% FRL) — zoned schools average 11% FRL vs 26% district-wide (15 pts lower); this property's tenant base skews higher-income than the district average.
- Market conditions: 154 active listings in the ZIP; 3 comparable units currently listed for rent nearby; rentals at typical pace (median 14d on market — plan ~3-4 weeks tenant-placement turnaround); 1,213 units permitted in Columbia County in 2024 (0 in 5+ unit buildings).
Forward outlook
- In year one you build about $26k of equity ($2k loan paydown + $24k appreciation (10.0% local appreciation)).
- Columbia County population projected at +62% by 2050 — long-run rental-demand tailwind backs the buy-and-hold thesis.
- At projected returns (10.0% appreciation + 3.0% rent growth), your $67k cash investment doubles in ~3 years — after that, you're playing with house money.
- By year 2, paydown + projected appreciation supports a ~$41k cash-out refi (75% LTV) — recoverable capital for the next deal without selling this one.
Negotiation context
- It's been on market 17 days — a 2% lower offer ($236k) is reasonable based on typical stale-listing flexibility.
- 6 sale attempts since 4y ago; this cycle's ask has dropped $30k (11%) from the opening price — seller is motivated, your offer sets the floor, not the list.
Risks & watch-outs
- Watch-outs: built in 1953 — expect roof / HVAC / electrical / plumbing capex.
- Climate carrying-cost: major wind risk, 52% chance of damaging wind over 30y; extreme-heat days projected 7→17/yr by 2055 (HVAC capex compounding) — expect insurance premiums to compound above CPI over the hold.
Questions for the listing agent
- Built in 1953 — when were the roof, HVAC, electrical panel, plumbing, and water heater last replaced?
- Is there a deadline driving the sale (1031 exchange, divorce, estate, relocation)? That informs how much negotiation room exists.
- Schools are B-rated — typically a magnet for longer-tenancy family renters. What's the average tenant stay here, and is there a school-zone premium baked into asking?
- What's the average days-on-market for RENTAL listings here right now (not sales)? A rising rental-DOM trend means longer vacancies and softer asking-rent achievability than the comps imply.
- What's the recent tenant-quality profile in this submarket — average credit score on applications, eviction rate, late-payment / NSF rate, and stable-employment percentage? A property-management company in the area should have these aggregated.
- How much new for-sale + rental construction is in the pipeline within 1–3 miles? Heavy new supply typically softens prices + rents 12–24 months out; constrained supply supports both.
Investment metrics
- 1% rule
- 0.79% ✗
- Cap rate
- 6.63%
- Cash-on-cash
- 1.21%
- DSCR
- 1.05
- GRM
- 10.5
CMA / ARV
- ARV (median comp)
- $280,188
- List price
- $240,000
- Delta
- -14.34%
- Verdict
- UNDERPRICED
- Comps
- 3 within 2.0 mi
Projected returns pro-forma
10.0% appreciation · 3.0% rent growth · sell at horizon
- IRR
- 25.1%
- Equity multiple
- 3.01×
- Total profit
- $134,918
- Equity at exit
- $216,211
- IRR
- 22.1%
- Equity multiple
- 6.86×
- Total profit
- $393,699
- Equity at exit
- $466,267
Cash invested: $67,200 (down + closing). Projections, not guarantees.
Landlord ↔ Tenant lean methodology
- Overall (STATE)
- 90 Strongly Landlord-Friendly
- State Georgia
- 90 Strongly Landlord-Friendly · R+3
- County
- — inherits STATE
- City
- — inherits STATE
ZIP-level market 30802
- Home prices YoY
- 4.8%
- Active inventory
- 154
- Price-to-rent
- 10.5×
Monthly cashflow live
- Estimated rent
- $1,900 medium interval (Pro) →
- Mortgage (P&I)
- −$1,259
- Tax from tax record
- −$75 /mo · $898/yr
- Insurance
- −$100
- HOA
- −$0
- Vacancy / Maint / Mgmt
- −$399
- Net cashflow
- $68
Break-even live
UW: 25.0% down · 7.5% · 30yr · 1.5% tax · 5.0% vac · 8.0% maint · 8.0% mgmt
Financing live
Cash to close
- Down payment
- $60,000
- Closing costs
- $7,200
- Reserves months
- —
- Total cash needed
- —
Loan-product check · same deal, 3 products live
Conventional
25% down · 7.5% · 30yr
- Down + closing
- —
- Monthly P&I
- —
- Monthly cashflow
- —
- DSCR
- —
- Eligible?
- —
Personal DTI + credit; lowest rate.
DSCR
20% down · 8.5% · 30yr
- Down + closing
- —
- Monthly P&I
- —
- Monthly cashflow
- —
- DSCR
- —
- Eligible?
- —
No personal income docs; deal must DSCR.
Hard money
10% down · 12.0% · 12mo
- Down + closing
- —
- Monthly P&I
- —
- Monthly cashflow
- —
- DSCR
- —
- Eligible?
- —
Short-term bridge; refi at stabilization.
Rent comps 3 comps
| Address | Beds | Baths | Sqft | Rent | $/sqft | DOM | Units | Dist |
|---|---|---|---|---|---|---|---|---|
| 120 Lullwater Dr Evans, GA | 1.0–2.0 | 1.0–2.0 | 1018 | $1,575 | $1.55 | 14d | 9 | 1.40mi |
| 106 Copper Ridge Rd Evans, GA | 2.0 | 2.0 | 1285 | $1,900 | $1.48 | 44d | 1 | 1.47mi |
| 106 Copper Ridge Rd Evans, GA | 3.0 | 2.0 | 1469 | $2,200 | $1.50 | 14d | 1 | 1.47mi |
Listing history 13 events
-
2026-05-11historical
-
2026-05-11historical
-
2026-05-11historical
-
2026-04-30price $250,000
-
2026-03-19price $260,000
-
2026-02-23$270,000 Active
-
2026-02-23$250,000 Active
-
2024-06-24historical
-
2024-01-24$230,000
-
2024-01-24$230,000
-
2022-08-11historical
-
2022-04-13$270,000
-
2022-04-13$270,000
ⓘ Source: listings_history table (triggers on properties + properties_extension) + one-shot
backfill from property_details.listing_events for pre-trigger history.
Tax reassessment forecast GA · Resets to sale price
- Current annual tax
- $898 · $75/mo
- Projected year-2 tax
- $2,208 · $184/mo
- Expected delta
- +$1,310/yr (+$109/mo · 145.9%)
ⓘ Screening estimate from a state-policy table — verify with the county assessor before closing.
Climate risk First Street
- Flood 1/10 Low FEMA zone X (unshaded) · 0% chance over 30 yrs
- Wildfire 4/10 Moderate
- Heat 6/10 Major 7 d/yr ≥107°F today · 17 d/yr by 30 yrs out
- Wind 6/10 Major 52% chance of damaging wind over 30 yrs
- Air quality 2/10 Low 1 unhealthy d/yr today · 1 by 30 yrs out
Nearby sold comps map
Loading sold comps map…
Walkable amenities ~0.75 mi
Loading nearby amenities…
Taxation est. · year 1
- Rental income
- $22,803
- − Mortgage interest
- −$13,444
- − Property taxes
- −$898
- − Insurance
- −$1,200
- − Repairs & maintenance
- −$1,824
- − Management
- −$1,824
- − Depreciation
- −$6,982
- Taxable loss
- −$3,369
- Est. tax savings @ 24.0%
- +$809
- After-tax cash flow
- $1,622/yr
For passive investors: Depreciation is non-cash, so a rental often shows a tax loss while cash-flowing — sheltering income. Rental losses are passive: they offset passive income freely, and up to $25,000/yr can offset ordinary (W-2) income if you actively participate and your MAGI is under $100k (phasing out to $0 by $150k); unused losses carry forward. On sale, claimed depreciation is recaptured at up to 25%, and gains may owe capital-gains tax (a 1031 exchange can defer both). Figures are a year-1 estimate at your 24.0% rate — not tax advice; consult a CPA.
Schools (NCES district)
- District
- Columbia County
- NCES district ID
- 1301410
- Math proficiency
- 49% ▼ -6.00%
- Reading proficiency
- 52% ▼ -4.00%
- Median HH income
- $69,358
- Composite
- 45.04/100
- National rank
- #2695
- State rank
- #13 of 174 in GA
Livability — Evans
- Score
- 77/100
- State rank
- #20
- US rank
- #3058
Category grades
Schools grade is shown separately in the Schools card above.
Census & demographics
- City population
- 54,743
- Population (ZIP)
- 6,375
Population outlook (Columbia County) Hauer SSP2
- Today (2025)
- 189,073 people
- By 2030
- 212,277 · +12.3%
- By 2040
- 259,480 · +37.2%
- By 2050
- 306,991 · +62.4%
- By 2075
- 421,213 · +122.8%
- By 2100
- 496,722 · +162.7%
Race, ethnicity, and origin ACS 2023
- Neighborhood character
- Predominantly White (74%)
- Race & ethnicity
- White 74% Black 17% Two or more races 7% Hispanic / Latino 3%
- Common ancestry
- Serbian 3% Slovak 1% Italian 1%
- Foreign-born
- 1% · Canada
- Languages at home
- 97% English-only · Spanish 2%
Political lean MEDSL · Columbia
- 2024 margin
- Strong R (+25.6) · D 36.8% · R 62.5%
- 2008→2024 swing
- +17.0pp toward D · 2008: -42.7pp · 2024: -25.6pp
- All cycles
- 2024: R+25.6 2020: R+25.8 2016: R+37.7 2012: R+43.0 2008: R+42.7
Not yet ingested
- Civics
- —
Market trends
- HPI YoY
- ▲ 15.67%
- Current HPI
- 339.0061
- Rent YoY
- —
- Metro
- —
- State GDP YoY
- ▲ 2.66%
- F500 in state
- 28
Industry mix (Fortune 500 HQ in GA)
| Industry | F500 HQs | Revenue |
|---|---|---|
| Paper / Packaging | 2 | $29B |
|
||
| Retail | 1 | $160B |
|
||
| Transportation / Logistics | 1 | $91B |
|
||
| Airlines | 1 | $62B |
|
||
| Consumer Goods | 1 | $47B |
|
||
| Utilities | 1 | $25B |
|
||
Price history
-11.1% since first listed15 events — show timeline
- 2026-05-28 Pending — Hive MLS
- 2026-05-23 Price Changed $240,000 Hive MLS
- 2026-05-11 Listing Removed — Hive MLS
- 2026-05-11 Listing Removed — Hive MLS
- 2026-05-11 Listing Removed — Hive MLS
- 2026-04-30 Price Changed $250,000 Hive MLS
- 2026-03-19 Price Changed $260,000 Hive MLS
- 2026-02-23 Listed $270,000 Hive MLS
- 2026-02-23 Listed $250,000 Hive MLS
- 2024-06-24 Listing Removed — Hive MLS
- 2024-01-24 Listed $230,000 Hive MLS
- 2024-01-24 Listed $230,000 Hive MLS
- 2022-08-11 Listing Removed — Hive MLS
- 2022-04-13 Listed $270,000 Hive MLS
- 2022-04-13 Listed $270,000 Hive MLS
Property tax history
+5.3%/yrLatest (2025): $898 · +18.4% YoY. Source: county tax records.
Cash-flow waterfall
monthlySold comps — $/sqft
last 12 mo · ≤1 miLoading sold comps…