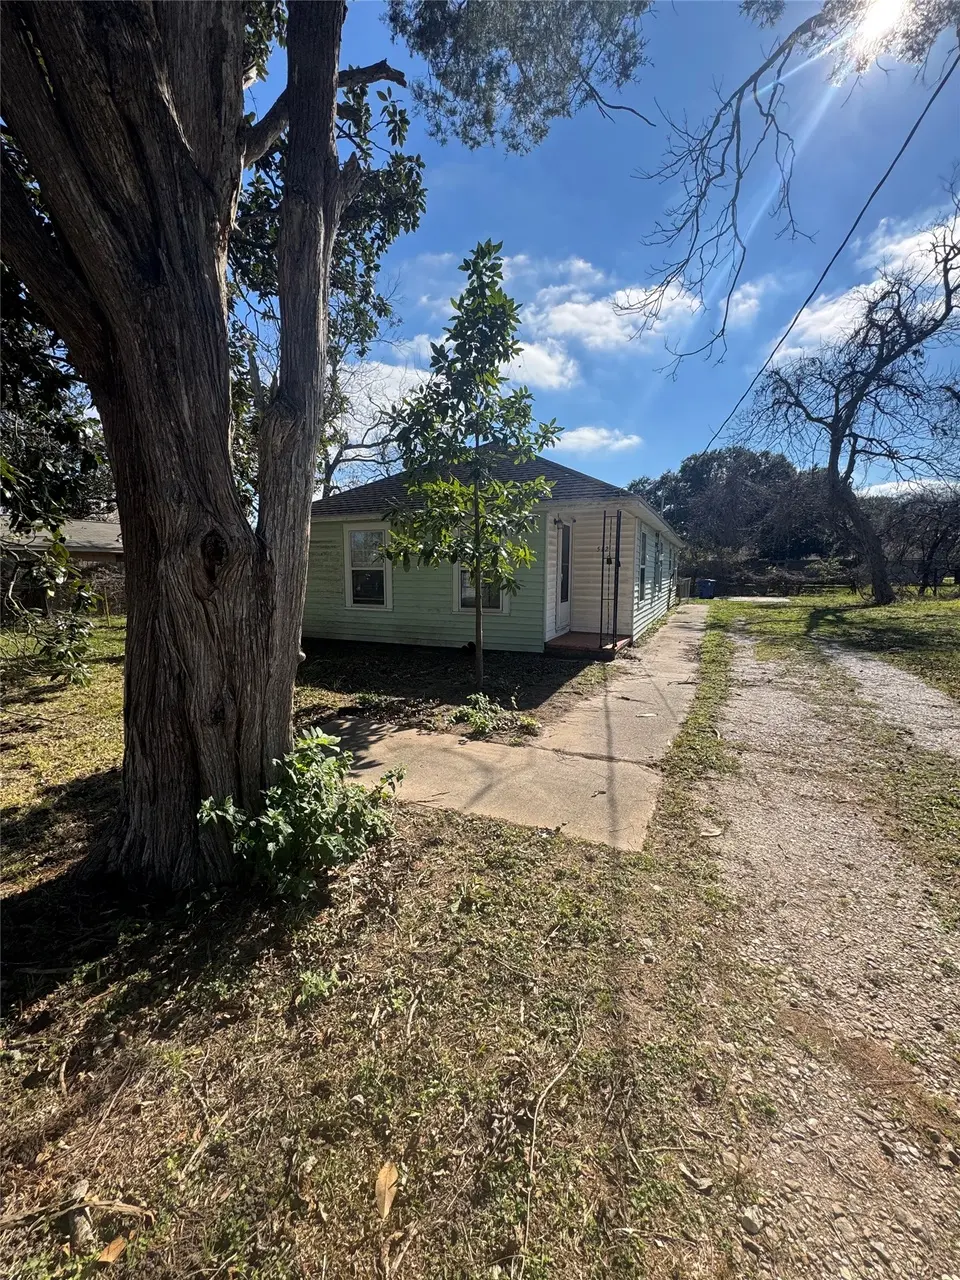
512 Rice St · Angleton, TX
Flood risk 1/10 · Minimal
- FEMA flood zone
- X (unshaded)
- Chance of flooding over 30 yrs
- 0.0%
- Est. flood insurance / yr
- $507 – $1,088
Fire risk 6/10 · Moderate
- Est. fire insurance / yr
- $1,222 – $2,270
Heat risk 10/10 · Severe
- Hot days now (above 111°F)
- 7 days/yr
- Hot days in 30 yrs
- 25 days/yr
Wind risk 9/10 · Severe
- Chance of severe wind over 30 yrs
- 99.0%
Air-quality risk 2/10 · Minimal
- Unhealthy air days now
- 1 days/yr
- Unhealthy air days in 30 yrs
- 1 days/yr
Risk factors via First Street. Map © Google.
Why this score? — see what drove the D- grade
The composite is a weighted blend of 9 inputs, each scored 0–100. Each bar is that input's sub-score; the figure is the points it added to the 100-point composite (weight × sub-score).
- ARV discount +14.3/15.0
- Cash flow +7.7/30.0
- Livability +3.7/5.0
- Schools +3.5/10.0
- 1% rule +3.4/10.0
- Rent growth +2.5/5.0
- Condition / age +2.5/5.0
- DSCR +1.8/10.0
- Appreciation +0.0/10.0
$165,000
🖨 Deal sheet (PDF) 📄 Offer letter ✓ Due diligence
Listing remarks MLS
Recently remodeled 3 bedroom, 2 bathroom home situated on a large lot with an additional adjacent lot included. Updates throughout provide a fresh, move-in-ready interior. The second lot offers excellent flexibility and may be used for a garage, workshop, RV or boat storage, or potential future construction (buyer to verify zoning and restrictions). Ideal for homeowners seeking extra space or investors looking for expansion potential. Convenient location with room to grow.
Key facts
- Recently remodeled
- Large lot
- 0.34 acre lot
Tags
Neighborhood map
What this means for you Summary
Snapshot
- This is a 3-bed/1.0-bath single-family listed at $165k.
Deal economics
- At list price, monthly cash flow is $-192 ($-2k/yr) — negative.
- To cash-flow at today's rent, offer at most $131k (20.5% below list).
- To meet the 1% rule (rent ≥ 1% of price), the offer needs to be $139k (15.5% below list).
- Recommended offer: $131k (20.5% below list) — sets the bar for cash-flow.
- Cap rate 4.9% vs local median 4.0% in Angleton — meaningfully above typical; check what's discounted (condition, days-on-market, listing class) to confirm the premium yield is real.
Location & tenants
- Location reads 74/100 on livability (#171 in TX, #4,520 nationally) — a middle-class / working-renter tenant base. Strengths: cost of living A+, housing A+, employment A-; Watch: amenities F, commute F.
- Angleton ISD (suburban): math 36% / reading 44% proficiency, ranked #375 of 826 in TX (top 45%) — families likely to look elsewhere, expect single-tenant / working-renter base with shorter leases.
- Zoned schools: Southside El (math 37% / reading 32%, grade F, #1,995 of 4,322 statewide, top 50%, 315 students, 82% FRL); Angleton J H School (math 26% / reading 41%, grade F, #911 of 1,662 statewide, top 56%, 1,561 students, 68% FRL); Angleton H S (math 22% / reading 45%, grade F, #1,011 of 1,632 statewide, top 63%, 2,066 students, 67% FRL) — zoned schools average 73% FRL vs 54% district-wide (18 pts higher); higher-poverty schools than district average — tighter screening recommended.
- Market conditions: 932 active listings in the ZIP; 10 comparable units currently listed for rent nearby; rentals at typical pace (median 26d on market — plan ~3-4 weeks tenant-placement turnaround); solid renter incomes; 3,960 units permitted in Brazoria County in 2024 (593 in 5+ unit buildings).
Forward outlook
- Local home prices are declining (-3.0%/yr); year-one equity from $1k of loan paydown is wiped out by about $5k of value loss. Plan a longer hold.
- Brazoria County population projected at +44% by 2050 — long-run rental-demand tailwind backs the buy-and-hold thesis.
Negotiation context
- It's been on market 164 days — a 12% lower offer ($145k) is reasonable based on typical stale-listing flexibility.
- 10 sale attempts since 4y ago; this cycle's ask is 10545% above the opening price — seller raised mid-cycle; expect resistance to lowballs.
Risks & watch-outs
- Watch-outs: property tax is 2.6% of price.
- Climate carrying-cost: severe wind risk, 99% chance of damaging wind over 30y; major wildfire risk; extreme-heat days projected 7→25/yr by 2055 (HVAC capex compounding) — expect insurance premiums to compound above CPI over the hold.
Questions for the listing agent
- What do current leases actually rent for vs. the listed asking? Can we see a recent rent roll and the last 12 months of T-12 income?
- It's been on market 164 days. Have you received any prior offers? Is the seller open to a 21% concession, seller financing, or rate buy-down credit?
- Built in 1960 — when were the roof, HVAC, electrical panel, plumbing, and water heater last replaced?
- Property tax is high relative to price — has the assessment been appealed recently, and will the sale trigger a re-assessment?
- Why hasn't it sold? Are there any deal-killer items the seller is aware of (foundation, flood, title, zoning, code violations)?
- Is there a deadline driving the sale (1031 exchange, divorce, estate, relocation)? That informs how much negotiation room exists.
- Schools are D-rated, which usually means shorter tenancies and higher turnover. Who's the typical renter profile here, and what's been the actual vacancy rate?
- The area grade is low — what's the realistic commute time and amenity access for the typical tenant pool here? Any planned neighborhood developments (good or bad) we should know about?
- What's the average days-on-market for RENTAL listings here right now (not sales)? A rising rental-DOM trend means longer vacancies and softer asking-rent achievability than the comps imply.
- What's the recent tenant-quality profile in this submarket — average credit score on applications, eviction rate, late-payment / NSF rate, and stable-employment percentage? A property-management company in the area should have these aggregated.
- How much new for-sale + rental construction is in the pipeline within 1–3 miles? Heavy new supply typically softens prices + rents 12–24 months out; constrained supply supports both.
Investment metrics
- 1% rule
- 0.84% ✗
- Cap rate
- 4.90%
- Cash-on-cash
- -4.98%
- DSCR
- 0.78
- GRM
- 9.9
CMA / ARV
- ARV (median comp)
- $194,354
- List price
- $165,000
- Delta
- -15.10%
- Verdict
- UNDERPRICED
- Comps
- 20 within 1.0 mi
Show comp detail 12 sales within ~0.75 mi
| Address | Dist | Beds/Ba | Sqft | Sold | Price | $/sf | Match |
|---|---|---|---|---|---|---|---|
| 1016 Grove St | 0.14mi | 3/1.5 | 1,294 (+6%) | 4mo | $180,000 | $139 | 79 |
| 429 E Kiber St | 0.30mi | 3/2.0 | 1,246 (+2%) | 1mo | $199,500 | $160 | 78 |
| 840 S Morgan St | 0.08mi | 3/1.0 | 1,102 (-10%) | 3mo | $179,000 | $162 | 77 |
| 809 S Morgan St | 0.12mi | 3/1.0 | 1,096 (-10%) | 4mo | $159,000 | $145 | 73 |
| 717 S Valderas St | 0.25mi | 3/1.0 | 1,084 (-11%) | 3mo | $79,000 | $73 | 67 |
| 401 Farrer St | 0.53mi | 3/1.0 | 1,260 (+3%) | 9mo | $169,749 | $135 | 63 |
| 408 Dwyer St | 0.19mi | 3/1.5 | 1,400 (+14%) | 3mo | $110,000 | $79 | 62 |
| 440 Bryan Way | 0.45mi | 3/2.0 | 1,348 (+10%) | 1mo | $229,900 | $171 | 58 |
| 517 Earls Ct | 0.39mi | 3/2.0 | 1,337 (+9%) | 8mo | $206,000 | $154 | 55 |
| 29 Greenbriar Loop | 0.52mi | 3/2.0 | 1,348 (+10%) | 2mo | $224,400 | $166 | 54 |
| 1220 Fairground Ln | 0.55mi | 3/2.0 | 1,344 (+10%) | 3mo | $210,000 | $156 | 51 |
| 511 Bryan St | 0.73mi | 3/1.5 | 1,344 (+10%) | 4mo | $199,000 | $148 | 44 |
Match score weights: distance 35% · size 25% · config 20% · recency 20%. Top-matched comps best support the ARV.
Projected returns pro-forma
-3.0% appreciation · 3.0% rent growth · sell at horizon
- IRR
- -24.7%
- Equity multiple
- 0.16×
- Total profit
- $-38,842
- Equity at exit
- $24,602
- IRR
- -20.1%
- Equity multiple
- -0.06×
- Total profit
- $-49,091
- Equity at exit
- $14,266
Cash invested: $46,200 (down + closing). Projections, not guarantees.
Landlord ↔ Tenant lean methodology
- Overall (STATE)
- 87 Strongly Landlord-Friendly
- State Texas
- 87 Strongly Landlord-Friendly · R+5
- County
- — inherits STATE
- City
- — inherits STATE
ZIP-level market 77515
- Home prices YoY
- -5.1%
- Active inventory
- 932
- Price-to-rent
- 9.9×
Monthly cashflow live
- Estimated rent
- $1,394 high interval (Pro) →
- Mortgage (P&I)
- −$865
- Tax from tax record
- −$359 /mo · $4,304/yr
- Insurance
- −$69
- HOA
- −$0
- Vacancy / Maint / Mgmt
- −$293
- Net cashflow
- $-192
Break-even live
Sensitivity live
| Price | -10% $-98 | -5% $-145 | +0% $-192 | +5% $-239 | +10% $-285 |
|---|---|---|---|---|---|
| Rent | -10% $-302 | -5% $-247 | +0% $-192 | +5% $-137 | +10% $-82 |
| Rate | -1.0pp $-109 | -0.5pp $-150 | base $-192 | +0.5pp $-235 | +1.0pp $-278 |
UW: 25.0% down · 7.5% · 30yr · 1.5% tax · 5.0% vac · 8.0% maint · 8.0% mgmt
Financing live
Cash to close
- Down payment
- $41,250
- Closing costs
- $4,950
- Reserves months
- —
- Total cash needed
- —
Loan-product check · same deal, 3 products live
Conventional
25% down · 7.5% · 30yr
- Down + closing
- —
- Monthly P&I
- —
- Monthly cashflow
- —
- DSCR
- —
- Eligible?
- —
Personal DTI + credit; lowest rate.
DSCR
20% down · 8.5% · 30yr
- Down + closing
- —
- Monthly P&I
- —
- Monthly cashflow
- —
- DSCR
- —
- Eligible?
- —
No personal income docs; deal must DSCR.
Hard money
10% down · 12.0% · 12mo
- Down + closing
- —
- Monthly P&I
- —
- Monthly cashflow
- —
- DSCR
- —
- Eligible?
- —
Short-term bridge; refi at stabilization.
Rent comps 10 comps
| Address | Beds | Baths | Sqft | Rent | $/sqft | DOM | Units | Dist |
|---|---|---|---|---|---|---|---|---|
| 832 S Anderson St Angleton, TX | 3.0 | 1.0 | 1104 | $1,495 | $1.35 | 9d | 1 | 0.06mi |
| 312 Rice St Angleton, TX | 2.0 | 2.0 | 1100 | $1,195 | $1.09 | 26d | 1 | 0.12mi |
| 312 Rice St Unit A Angleton, TX | 2.0 | 1.5 | 1100 | $1,195 | $1.09 | 26d | 1 | 0.12mi |
| 312 Rice St Angleton, TX | 2.0 | 2.0 | 1100 | $1,250 | $1.14 | 5d | 1 | 0.12mi |
| 312 Rice St Unit B Angleton, TX | 2.0 | 1.5 | 1100 | $1,250 | $1.14 | 13d | 1 | 0.12mi |
| 301 Sands St Angleton, TX | 2.0 | 1.0 | 950 | $800 | $0.84 | 45d | 1 | 0.25mi |
| 105 Cemetery Rd Unit ROAD228 Angleton, TX | 2.0 | 1.0 | 784 | $895 | $1.14 | 45d | 1 | 0.30mi |
| 105 Cemetary Rd Angleton, TX | 2.0 | 1.0 | 784 | $975 | $1.24 | 26d | 1 | 0.33mi |
| 941 S Walker St Angleton, TX | 3.0 | 1.0 | 1033 | $1,435 | $1.39 | 24d | 1 | 0.85mi |
| 409 N Parrish St Angleton, TX | 2.0 | 1.0 | 1000 | $875 | $0.88 | 4d | 1 | 1.11mi |
Listing history 44 events
-
2026-06-21days on market $165,000 Active 164 DOM
-
2026-06-18days on market $165,000 Active 161 DOM
-
2026-06-17days on market $165,000 Active 160 DOM
-
2026-06-16days on market $165,000 Active 159 DOM
-
2026-06-15days on market $165,000 Active 158 DOM
-
2026-06-13days on market $165,000 Active 156 DOM
-
2026-06-09days on market $165,000 Active 152 DOM
-
2026-06-08days on market $165,000 Active 151 DOM
-
2026-06-07days on market $165,000 Active 150 DOM
-
2026-06-04days on market $165,000 Active 147 DOM
-
2026-06-03days on market $165,000 Active 146 DOM
-
2026-06-02days on market $165,000 Active 145 DOM
-
2026-06-01days on market $165,000 Active 144 DOM
-
2026-05-31days on market $165,000 Active 143 DOM
-
2026-03-17price $165,000 477-char remark
Show marketing remark (477 chars)
Recently remodeled 3 bedroom, 2 bathroom home situated on a large lot with an additional adjacent lot included. Updates throughout provide a fresh, move-in-ready interior. The second lot offers excellent flexibility and may be used for a garage, workshop, RV or boat storage, or potential future construction (buyer to verify zoning and restrictions). Ideal for homeowners seeking extra space or investors looking for expansion potential. Convenient location with room to grow.
-
2026-02-19$1,550
-
2026-01-08$179,000 Active 477-char remark
Show marketing remark (477 chars)
Recently remodeled 3 bedroom, 2 bathroom home situated on a large lot with an additional adjacent lot included. Updates throughout provide a fresh, move-in-ready interior. The second lot offers excellent flexibility and may be used for a garage, workshop, RV or boat storage, or potential future construction (buyer to verify zoning and restrictions). Ideal for homeowners seeking extra space or investors looking for expansion potential. Convenient location with room to grow.
-
2025-12-17historical $1,550
-
2025-12-17historical
-
2025-12-06price $1,550
-
2025-12-04price $191,000
-
2025-10-28price $1,600
-
2025-10-09$1,625
-
2025-10-07price $195,000
-
2025-09-17$199,000 Active
-
2024-11-17historical $1,500
-
2024-11-12$1,500
-
2024-11-11historical $1,500
-
2024-11-07price $1,500
-
2024-10-29price $1,550
-
2024-10-10$1,695
-
2024-09-19historical $1,500
-
2024-08-16$1,500
-
2024-08-16historical $1,500
-
2024-07-31historical $1,500
-
2024-07-31$1,500
-
2024-07-15$1,450
-
2023-06-05historical
-
2022-11-03historical
-
2022-10-12$35,000 Active
-
2021-12-16soldstatus
-
2021-12-15soldstatus
-
2005-11-03soldstatus
-
2003-04-17soldstatus
ⓘ Source: listings_history table (triggers on properties + properties_extension) + one-shot
backfill from property_details.listing_events for pre-trigger history.
Tax reassessment forecast TX · Resets to sale price
- Current annual tax
- $4,304 · $359/mo
- Projected year-2 tax
- $4,304 · $359/mo
- Expected delta
- $0/yr ($0/mo · 0.0%)
ⓘ Screening estimate from a state-policy table — verify with the county assessor before closing.
Climate risk First Street
- Flood 1/10 Low FEMA zone X (unshaded) · 0% chance over 30 yrs
- Wildfire 6/10 Major
- Heat 10/10 Extreme 7 d/yr ≥111°F today · 25 d/yr by 30 yrs out
- Wind 9/10 Extreme 99% chance of damaging wind over 30 yrs
- Air quality 2/10 Low 1 unhealthy d/yr today · 1 by 30 yrs out
Nearby sold comps map
Loading sold comps map…
Walkable amenities ~0.75 mi
Loading nearby amenities…
Taxation est. · year 1
- Rental income
- $16,722
- − Mortgage interest
- −$9,243
- − Property taxes
- −$4,304
- − Insurance
- −$825
- − Repairs & maintenance
- −$1,338
- − Management
- −$1,338
- − Depreciation
- −$4,800
- Taxable loss
- −$5,125
- Est. tax savings @ 24.0%
- +$1,230
- After-tax cash flow
- $-1,072/yr
For passive investors: Depreciation is non-cash, so a rental often shows a tax loss while cash-flowing — sheltering income. Rental losses are passive: they offset passive income freely, and up to $25,000/yr can offset ordinary (W-2) income if you actively participate and your MAGI is under $100k (phasing out to $0 by $150k); unused losses carry forward. On sale, claimed depreciation is recaptured at up to 25%, and gains may owe capital-gains tax (a 1031 exchange can defer both). Figures are a year-1 estimate at your 24.0% rate — not tax advice; consult a CPA.
Schools (NCES district)
- District
- Angleton ISD
- NCES district ID
- 4808310
- Math proficiency
- 36% ▼ -8.00%
- Reading proficiency
- 44% ▲ 1.00%
- Median HH income
- $55,670
- Composite
- 35.01/100
- National rank
- #5046
- State rank
- #375 of 826 in TX
Livability — Angleton
- Score
- 74/100
- State rank
- #171
- US rank
- #4520
Category grades
Schools grade is shown separately in the Schools card above.
Census & demographics
- Census place
- Angleton, TX
- County
- Brazoria County · 374,982 people
- City population
- 34,088
- Metro
- Houston-The Woodlands-Sugar Land, TX
- Population (ZIP)
- 34,088
- Household income
- $88,787
- Rent vs Own
- Severe rent burden
- 785.0
Population outlook (Brazoria County) Hauer SSP2
- Today (2025)
- 420,414 people
- By 2030
- 457,585 · +8.8%
- By 2040
- 532,232 · +26.6%
- By 2050
- 605,399 · +44.0%
- By 2075
- 779,358 · +85.4%
- By 2100
- 883,759 · +110.2%
Race, ethnicity, and origin ACS 2023
- Neighborhood character
- Diverse neighborhood (Simpson 0.58)
- Race & ethnicity
- White 55% Hispanic / Latino 33% Two or more races 18% Black 8% Asian 2%
- Hispanic origin (detail)
- Mexican 28%
- Common ancestry
- Lithuanian 3% Romanian 2% Slovak 1%
- Foreign-born
- 8% · Canada, Vietnam
- Languages at home
- 78% English-only · Spanish 20% Other Asian/Pacific 1%
Political lean MEDSL · Brazoria
- 2024 margin
- R (+19.7) · D 39.5% · R 59.2% · Other 1.3%
- 2008→2024 swing
- +9.9pp toward D · 2008: -29.6pp · 2024: -19.7pp
- All cycles
- 2024: R+19.7 2020: R+18.2 2016: R+24.6 2012: R+34.2 2008: R+29.6
Not yet ingested
- Civics
- —
Market trends
- HPI YoY
- ▼ -15.59%
- Current HPI
- 288.7286
- Rent YoY
- —
- Metro
- Houston-The Woodlands-Sugar Land, TX
- State GDP YoY
- ▲ 3.95%
- F500 in state
- 110
Industry mix (Fortune 500 HQ in TX)
| Industry | F500 HQs | Revenue |
|---|---|---|
| Energy | 16 | $1,198B |
|
||
| Technology | 5 | $198B |
|
||
| Engineering / Construction | 4 | $72B |
|
||
| Energy Services | 3 | $60B |
|
||
| Utilities | 3 | $41B |
|
||
| Healthcare | 2 | $330B |
|
||
Price history
+371.4% since first listed30 events — show timeline
- 2026-03-17 Price Changed $165,000 HARMLS
- 2026-02-19 Listed for Rent $1,550 HARMLS
- 2026-01-08 Listed $179,000 HARMLS
- 2025-12-17 Rental Removed $1,550 HARMLS
- 2025-12-17 Listing Removed — HARMLS
- 2025-12-06 Price Changed $1,550 HARMLS
- 2025-12-04 Price Changed $191,000 HARMLS
- 2025-10-28 Price Changed $1,600 HARMLS
- 2025-10-09 Listed for Rent $1,625 HARMLS
- 2025-10-07 Price Changed $195,000 HARMLS
- 2025-09-17 Listed $199,000 HARMLS
- 2024-11-17 Rental Removed $1,500 RENTALBEAST
- 2024-11-12 Listed for Rent $1,500 RENTALBEAST
- 2024-11-11 Rental Removed $1,500 HARMLS
- 2024-11-07 Price Changed $1,500 HARMLS
- 2024-10-29 Price Changed $1,550 HARMLS
- 2024-10-10 Listed for Rent $1,695 HARMLS
- 2024-09-19 Rental Removed $1,500 APPFOLIO
- 2024-08-16 Listed for Rent $1,500 APPFOLIO
- 2024-08-16 Rental Removed $1,500 HARMLS
- 2024-07-31 Rental Removed $1,500 APPFOLIO
- 2024-07-31 Listed for Rent $1,500 HARMLS
- 2024-07-15 Listed for Rent $1,450 APPFOLIO
- 2023-06-05 Rental Removed — HARMLS
- 2022-11-03 Listing Removed — HARMLS
- 2022-10-12 Listed $35,000 HARMLS
- 2021-12-16 Sold (Public Records) — Public Records
- 2021-12-15 Sold (Public Records) — Public Records
- 2005-11-03 Sold (Public Records) — Public Records
- 2003-04-17 Sold (Public Records) — Public Records
Property tax history
+4.4%/yrLatest (2025): $4,304 · +7.4% YoY. Source: county tax records.
Cash-flow waterfall
monthlySold comps — $/sqft
last 12 mo · ≤1 miLoading sold comps…