7600 Palmetto (1/13th Share) Dr Unit 305-A · Isle of Palms, SC
Flood risk 9/10 · Severe
- FEMA flood zone
- AE
- Chance of flooding over 30 yrs
- 0.99%
- Est. flood insurance / yr
- $1,737 – $8,500
Fire risk 3/10 · Minor
- Est. fire insurance / yr
- $783 – $1,453
Heat risk No data
- Hot days now (above threshold)
- —
- Hot days in 30 yrs
- —
Wind risk 9/10 · Severe
- Chance of severe wind over 30 yrs
- 99.0%
Air-quality risk 2/10 · Minimal
- Unhealthy air days now
- 0 days/yr
- Unhealthy air days in 30 yrs
- 1 days/yr
Risk factors via First Street. Map © Google.
Why this score? — see what drove the C- grade
The composite is a weighted blend of 9 inputs, each scored 0–100. Each bar is that input's sub-score; the figure is the points it added to the 100-point composite (weight × sub-score).
- Cash flow +15.0/30.0
- Appreciation +8.4/10.0
- ARV discount +7.5/15.0
- 1% rule +5.0/10.0
- DSCR +5.0/10.0
- Schools +4.3/10.0
- Livability +3.1/5.0
- Rent growth +2.5/5.0
- Condition / age +2.5/5.0
$119,500
🖨 Deal sheet 📄 Offer letter ✓ Due diligence
Listing remarks MLS
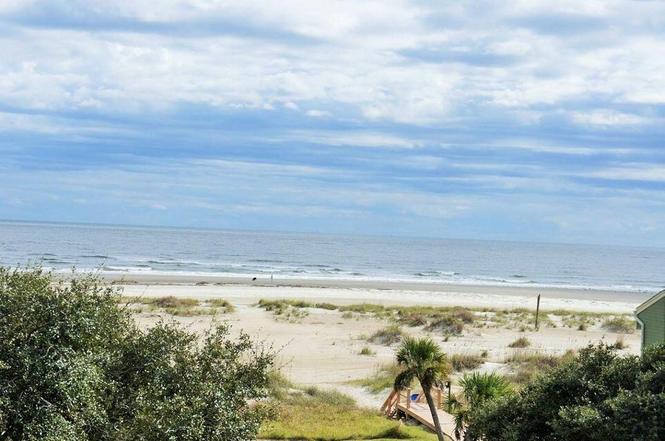
Enjoy sunrises, ships passing and endless views from the luxury of this superb oceanfront condo. With tile floors, white cabinetry, granite countertops, new baths and tasteful furnishings, this stylish three bedroom, three-bath condo is ready to enjoy!
Key facts
- Pool
- Built 1984
- Listed 101 days
Property features AI
Finance
- Other: Located in the Wild Dunes community on Isle of Palms
- HOA & community: HOA fee $250 per month; Community amenities: clubhouse, club membership available, elevators, gated entry, golf course with membership available, park, pool, tennis courts, walk/jog trails
Exterior
- Utilities: Public sewer
- Home design: Residential fractional ownership (1/13th share); One story
- Construction: Includes storage; No other outbuildings indicated
- Exterior features: Balcony; Beachfront setting; In-ground pool (community)
Interior
- Kitchen: Dishwasher; Electric cooktop / electric range; Refrigerator; Kitchen island
- Bedrooms: 3 bedrooms; Primary bedroom on lower level with ceiling fan
- Flooring: Carpet; Ceramic tile
- Bathrooms: 3 bathrooms
- Heating & cooling: Heat pump heating; Central air conditioning
- Interior features: Smooth ceilings; Elevator access; Kitchen island; Ceiling fans
- Laundry & utility: Washer and dryer included
Neighborhood map
What this means for you Summary
Snapshot
- This is a 3-bed/3.0-bath condo listed at $120k.
Deal economics
- At list price, monthly cash flow is $3k ($36k/yr) — positive.
- The deal already cash-flows at list — no discount required.
- Meets the 1% rule at list price ($6k rent vs $120k).
- Recommended offer: $109k (9.0% below list) — sets the bar for market timing.
Location & tenants
- Location reads 61/100 on livability (#217 in SC) — a middle-class / working-renter tenant base. Strengths: employment A+, crime A-; Watch: housing C-, amenities F, commute F.
- Charleston 01 (urban): math 48% / reading 53% proficiency, ranked #7 of 80 in SC (top 9%) — acceptable for families but not a draw, mixed tenant base, ~2y average lease.
- Zoned schools: Sullivan'S Island Elementary (math 88% / reading 81%, grade A+, #2 of 597 statewide, top 0%, 475 students, 9% FRL); Moultrie Middle (math 68% / reading 74%, grade A, #6 of 229 statewide, top 2%, 1,119 students, 22% FRL); Wando High (math 81% / reading 95%, grade A, #6 of 196 statewide, top 3%, 2,596 students, 19% FRL) — zoned schools average 17% FRL vs 44% district-wide (28 pts lower); this property's tenant base skews higher-income than the district average.
- Zoned-school proficiency averages 81% at this address vs 50% district-wide (+31 pts) — the actual schools serving this property are materially stronger than the Charleston 01 average implies; a family-tenant draw the district grade alone would hide.
- Market conditions: 121 active listings in the ZIP; high-income renter base; 4,156 units permitted in Charleston County in 2024 (857 in 5+ unit buildings).
Forward outlook
- In year one you build about $9k of equity ($826 loan paydown + $8k appreciation (6.8% local appreciation)).
- Charleston County population projected at +44% by 2050 — long-run rental-demand tailwind backs the buy-and-hold thesis.
- At projected returns (6.8% appreciation + 3.0% rent growth), your $33k cash investment doubles in ~1 year — after that, you're playing with house money.
- By year 4, paydown + projected appreciation supports a ~$31k cash-out refi (75% LTV) — recoverable capital for the next deal without selling this one.
Negotiation context
- It's been on market 101 days — a 9% lower offer ($109k) is reasonable based on typical stale-listing flexibility.
- 4 sale attempts since 22y ago; this cycle's ask has dropped $10k (8%) from the opening price — seller is motivated, your offer sets the floor, not the list.
Risks & watch-outs
- Watch-outs: flood insurance adds $427/mo.
- Climate carrying-cost: in FEMA flood zone AE (mandatory federal flood insurance); severe wind risk, 99% chance of damaging wind over 30y — expect insurance premiums to compound above CPI over the hold.
Questions for the listing agent
- It's been on market 101 days. Have you received any prior offers? Is the seller open to a 9% concession, seller financing, or rate buy-down credit?
- What's the actual annual flood-insurance premium (NFIP or private), and is the property in a SFHA with mandatory coverage?
- What does the HOA fee cover, when was the last increase, and are there any pending special assessments or reserve-fund shortfalls?
- Any open or pending special assessments — roof, HVAC, plumbing, elevator, façade? What's the per-unit balance and payoff schedule, and is the seller paying it off at close or rolling it to the buyer?
- Why hasn't it sold? Are there any deal-killer items the seller is aware of (foundation, flood, title, zoning, code violations)?
- Is there a deadline driving the sale (1031 exchange, divorce, estate, relocation)? That informs how much negotiation room exists.
- What's the average days-on-market for RENTAL listings here right now (not sales)? A rising rental-DOM trend means longer vacancies and softer asking-rent achievability than the comps imply.
- What's the recent tenant-quality profile in this submarket — average credit score on applications, eviction rate, late-payment / NSF rate, and stable-employment percentage? A property-management company in the area should have these aggregated.
- How much new apartment / multifamily construction is in the pipeline within 1–3 miles? Heavy new supply (>2% of stock underway) typically softens rents 12–24 months out; light construction supports rent growth.
Investment metrics
- 1% rule
- 5.08% ✓
- Cap rate
- 41.12%
- Cash-on-cash
- 124.37%
- DSCR
- 6.53
- GRM
- 1.6
CMA / ARV
No comps found within radius.
Projected returns pro-forma
6.84% appreciation · 3.0% rent growth · sell at horizon
- IRR
- —
- Equity multiple
- 8.02×
- Total profit
- $234,914
- Equity at exit
- $81,566
- IRR
- —
- Equity multiple
- 17.12×
- Total profit
- $539,358
- Equity at exit
- $153,823
Cash invested: $33,460 (down + closing). Projections, not guarantees.
Landlord ↔ Tenant lean methodology
- Overall (STATE)
- 90 Strongly Landlord-Friendly
- State South Carolina
- 90 Strongly Landlord-Friendly · R+6
- County
- — inherits STATE
- City
- — inherits STATE
ZIP-level market 29451
- Home prices YoY
- 2.0%
- Active inventory
- 121
- Price-to-rent
- 1.6×
Monthly cashflow live
- Estimated rent
- $6,068 medium interval (Pro) →
- Mortgage (P&I)
- −$627
- Tax est. 1.5%
- −$149 /mo · $1,792/yr
- Insurance
- −$50
- Flood insurance flood zone
- −$427 /mo · $5,118/yr
- HOA
- −$500
- Vacancy / Maint / Mgmt
- −$1,274
- Net cashflow
- $3,041
Break-even live
UW: 25.0% down · 7.5% · 30yr · 1.5% tax · 5.0% vac · 8.0% maint · 8.0% mgmt
Financing live
Cash to close
- Down payment
- $29,875
- Closing costs
- $3,585
- Reserves months
- —
- Total cash needed
- —
Loan-product check · same deal, 3 products live
Conventional
25% down · 7.5% · 30yr
- Down + closing
- —
- Monthly P&I
- —
- Monthly cashflow
- —
- DSCR
- —
- Eligible?
- —
Personal DTI + credit; lowest rate.
DSCR
20% down · 8.5% · 30yr
- Down + closing
- —
- Monthly P&I
- —
- Monthly cashflow
- —
- DSCR
- —
- Eligible?
- —
No personal income docs; deal must DSCR.
Hard money
10% down · 12.0% · 12mo
- Down + closing
- —
- Monthly P&I
- —
- Monthly cashflow
- —
- DSCR
- —
- Eligible?
- —
Short-term bridge; refi at stabilization.
HOA detail condo
- Monthly dues
- $500 · $6,000/yr
- Assessments
- None detected in remarks — confirm with the listing agent.
Listing history 21 events
-
2026-06-18days on market $119,500 Active 101 DOM
-
2026-06-17days on market $119,500 Active 100 DOM
-
2026-06-16days on market $119,500 Active 99 DOM
-
2026-06-15days on market $119,500 Active 98 DOM
-
2026-06-10days on market $119,500 Active 93 DOM
-
2026-06-09days on market $119,500 Active 92 DOM
-
2026-06-08days on market $119,500 Active 91 DOM
-
2026-06-07days on market $119,500 Active 90 DOM
-
2026-06-05days on market $119,500 Active 87 DOM
-
2026-06-03days on market $119,500 Active 86 DOM
-
2026-06-01days on market $119,500 Active 84 DOM
-
2026-05-31days on market $119,500 Active 83 DOM
-
2026-04-22price $124,500
-
2026-04-03price $127,500
-
2026-03-09$129,900 Active
-
2006-01-31soldstatus $1,115,000 252-char remark
Show marketing remark (252 chars)
Enjoy sunrises, ships passing and endless views from the luxury of this superb oceanfront condo. With tile floors, white cabinetry, granite countertops, new baths and tasteful furnishings, this stylish three bedroom, three-bath condo is ready to enjoy!
-
2005-10-24$1,165,000 252-char remark
Show marketing remark (252 chars)
Enjoy sunrises, ships passing and endless views from the luxury of this superb oceanfront condo. With tile floors, white cabinetry, granite countertops, new baths and tasteful furnishings, this stylish three bedroom, three-bath condo is ready to enjoy!
-
2004-09-23soldstatus $890,000 23-char remark
Show marketing remark (23 chars)
FOR COMP PURPOSES ONLY.
-
2004-09-23$890,000 23-char remark
Show marketing remark (23 chars)
FOR COMP PURPOSES ONLY.
-
2004-04-22soldstatus $622,500
-
2004-03-05$650,000
ⓘ Source: listings_history table (triggers on properties + properties_extension) + one-shot
backfill from property_details.listing_events for pre-trigger history.
Climate risk First Street
- Flood 9/10 Extreme FEMA zone AE · 99% chance over 30 yrs
- Wildfire 3/10 Moderate
- Wind 9/10 Extreme 99% chance of damaging wind over 30 yrs
- Air quality 2/10 Low 0 unhealthy d/yr today · 1 by 30 yrs out
Nearby sold comps map
Loading sold comps map…
Walkable amenities ~0.75 mi
Loading nearby amenities…
Taxation est. · year 1
- Rental income
- $72,813
- − Mortgage interest
- −$6,694
- − Property taxes
- −$1,792
- − Insurance
- −$5,716
- − Repairs & maintenance
- −$5,825
- − Management
- −$5,825
- − HOA
- −$6,000
- − Depreciation
- −$3,476
- Taxable income
- $37,485
- Est. tax owed @ 24.0%
- −$8,996
- After-tax cash flow
- $27,498/yr
For passive investors: Depreciation is non-cash, so a rental often shows a tax loss while cash-flowing — sheltering income. Rental losses are passive: they offset passive income freely, and up to $25,000/yr can offset ordinary (W-2) income if you actively participate and your MAGI is under $100k (phasing out to $0 by $150k); unused losses carry forward. On sale, claimed depreciation is recaptured at up to 25%, and gains may owe capital-gains tax (a 1031 exchange can defer both). Figures are a year-1 estimate at your 24.0% rate — not tax advice; consult a CPA.
Schools (NCES district)
- District
- Charleston 01
- NCES district ID
- 4501440
- Math proficiency
- 48% ▼ -2.00%
- Reading proficiency
- 53% ▬ 0.00%
- Median HH income
- $52,376
- Composite
- 43.41/100
- National rank
- #3018
- State rank
- #7 of 80 in SC
Livability — Isle of Palms
- Score
- 61/100
- State rank
- #217
- US rank
- #18296
Category grades
Schools grade is shown separately in the Schools card above.
Census & demographics
- Census place
- Isle of Palms, SC
- County
- Charleston County · 366,793 people
- City population
- 4,362
- Metro
- Charleston-North Charleston, SC
- Population (ZIP)
- 4,362
- Household income
- $156,979
- Rent vs Own
- Severe rent burden
- 20.0
Population outlook (Charleston County) Hauer SSP2
- Today (2025)
- 480,562 people
- By 2030
- 525,921 · +9.4%
- By 2040
- 612,189 · +27.4%
- By 2050
- 691,627 · +43.9%
- By 2075
- 847,979 · +76.5%
- By 2100
- 926,482 · +92.8%
Race, ethnicity, and origin ACS 2023
- Neighborhood character
- Predominantly White (97%)
- Race & ethnicity
- White 97% Asian 2%
- Common ancestry
- Lithuanian 5% Slovak 4% Scotch-Irish 2%
- Foreign-born
- 7% · China, Canada
- Languages at home
- 92% English-only · French/Haitian/Cajun 3% Other Asian/Pacific 3% Spanish 1%
Political lean MEDSL · Charleston
- 2024 margin
- Lean D (+5.7) · D 51.9% · R 46.3% · Other 1.8%
- 2008→2024 swing
- -2.7pp toward R · 2008: 8.3pp · 2024: 5.7pp
- All cycles
- 2024: D+5.7 2020: D+12.9 2016: D+7.9 2012: D+2.4 2008: D+8.3
Not yet ingested
- Civics
- —
Market trends
- HPI YoY
- ▲ 6.84%
- Current HPI
- 348.8655
- Rent YoY
- —
- Metro
- Charleston-North Charleston, SC
- State GDP YoY
- ▲ 4.51%
- F500 in state
- 2
Industry mix (Fortune 500 HQ in SC)
| Industry | F500 HQs | Revenue |
|---|---|---|
| Packaging | 1 | $7B |
|
||
Price history
-80.8% since first listed9 events — show timeline
- 2026-04-22 Price Changed $124,500 Charleston Trident MLS
- 2026-04-03 Price Changed $127,500 Charleston Trident MLS
- 2026-03-09 Listed $129,900 Charleston Trident MLS
- 2006-01-31 Sold (MLS) $1,115,000 Charleston Trident MLS
- 2005-10-24 Listed $1,165,000 Charleston Trident MLS
- 2004-09-23 Listed $890,000 Charleston Trident MLS
- 2004-09-23 Sold (MLS) $890,000 Charleston Trident MLS
- 2004-04-22 Sold (MLS) $622,500 Charleston Trident MLS
- 2004-03-05 Listed $650,000 Charleston Trident MLS
Cash-flow waterfall
monthlySold comps — $/sqft
last 12 mo · ≤1 miLoading sold comps…