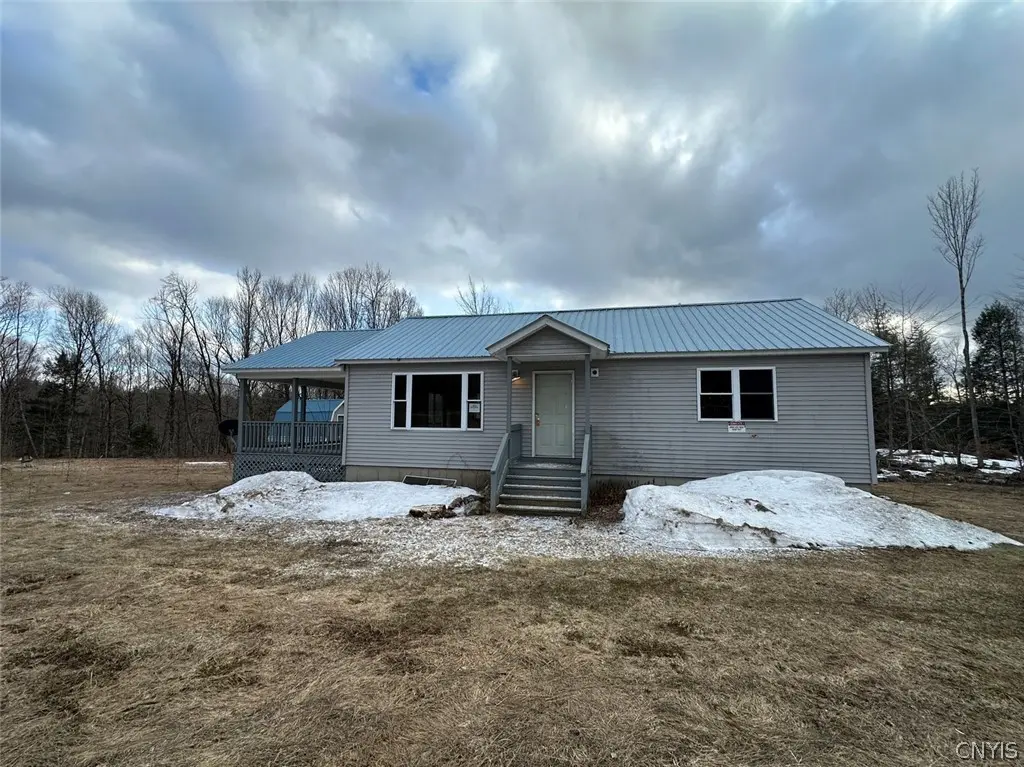
1899 County Highway 119 · Salisbury Center, NY
Flood risk 1/10 · Minimal
- FEMA flood zone
- X
- Chance of flooding over 30 yrs
- 0.0%
- Est. flood insurance / yr
- $473 – $860
Fire risk 3/10 · Minor
- Est. fire insurance / yr
- $691 – $1,283
Heat risk 1/10 · Minimal
- Hot days now (above 90°F)
- 7 days/yr
- Hot days in 30 yrs
- 16 days/yr
Wind risk 2/10 · Minimal
- Chance of severe wind over 30 yrs
- 1.0%
Air-quality risk 2/10 · Minimal
- Unhealthy air days now
- 0 days/yr
- Unhealthy air days in 30 yrs
- 1 days/yr
Risk factors via First Street. Map © Google.
Why this score? — see what drove the D grade
The composite is a weighted blend of 9 inputs, each scored 0–100. Each bar is that input's sub-score; the figure is the points it added to the 100-point composite (weight × sub-score).
- ARV discount +15.0/15.0
- Appreciation +10.0/10.0
- Cash flow +5.5/30.0
- Schools +3.2/10.0
- Rent growth +2.5/5.0
- Livability +2.5/5.0
- Condition / age +2.5/5.0
- 1% rule +1.9/10.0
- DSCR +0.0/10.0
$144,900
🖨 Deal sheet (PDF) 📄 Offer letter ✓ Due diligence
Listing remarks MLS
Nice ranch on a 5 acre lot surrounded by trees. The interior of the house needs some repairs and cosmetics, but has many quality features. There is a full basement with an overhead door for walkout and plenty of windows. Great space for finishing. The lot is level and there is a large two story shed. * * * Under FinCEN's new RRE Rule, transfers will be subject to reportng when buyers use entities ortrusts to take title to residenial real estate, when the transaction is all cash, privately financed or HELOC.
Key facts
- 5 acre lot
- Full basement
- Large two story shed
Tags
Neighborhood map
What this means for you Summary
Snapshot
- This is a 2-bed/1.0-bath single-family listed at $145k.
Deal economics
- At list price, monthly cash flow is $-310 ($-4k/yr) — negative.
- To cash-flow at today's rent, offer at most $90k (37.8% below list).
- To meet the 1% rule (rent ≥ 1% of price), the offer needs to be $100k (31.0% below list).
- Recommended offer: $90k (37.8% below list) — sets the bar for cash-flow.
Location & tenants
- Location reads: area grade D — affects rentability + tenant quality, not the cash-flow math above.
- Dolgeville Central School District (rural): math 30% / reading 47% proficiency, ranked #541 of 590 in NY (top 92%) — families likely to look elsewhere, expect single-tenant / working-renter base with shorter leases.
- Zoned schools: Dolgeville Elementary School (math 17% / reading 42%, grade F, #1,729 of 2,108 statewide, top 84%, 426 students, 63% FRL); Dolgeville Middle School (math 12% / reading 37%); James A Green Junior-Senior High School (math 92% / reading 82%, grade A, #311 of 1,100 statewide, top 30%, 371 students, 63% FRL) — zoned schools average 63% FRL vs 47% district-wide (16 pts higher); higher-poverty schools than district average — tighter screening recommended.
- Market conditions: 4 active listings in the ZIP; 112 units permitted in Fulton County in 2024 (50 in 5+ unit buildings).
Forward outlook
- In year one you build about $15k of equity ($1k loan paydown + $14k appreciation (10.0% local appreciation)).
- Fulton County population projected at -23% by 2050 — secular population decline; favor cash flow + early exit over multi-decade hold.
- By year 3, paydown + projected appreciation supports a ~$39k cash-out refi (75% LTV) — recoverable capital for the next deal without selling this one.
Negotiation context
- It's been on market 90 days — a 6% lower offer ($136k) is reasonable based on typical stale-listing flexibility.
- 3 sale attempts since 18y ago; this cycle's ask has dropped $40k (22%) from the opening price — seller is motivated, your offer sets the floor, not the list.
Questions for the listing agent
- What do current leases actually rent for vs. the listed asking? Can we see a recent rent roll and the last 12 months of T-12 income?
- It's been on market 90 days. Have you received any prior offers? Is the seller open to a 38% concession, seller financing, or rate buy-down credit?
- Why hasn't it sold? Are there any deal-killer items the seller is aware of (foundation, flood, title, zoning, code violations)?
- Is there a deadline driving the sale (1031 exchange, divorce, estate, relocation)? That informs how much negotiation room exists.
- The area grade is low — what's the realistic commute time and amenity access for the typical tenant pool here? Any planned neighborhood developments (good or bad) we should know about?
- What's the average days-on-market for RENTAL listings here right now (not sales)? A rising rental-DOM trend means longer vacancies and softer asking-rent achievability than the comps imply.
- What's the recent tenant-quality profile in this submarket — average credit score on applications, eviction rate, late-payment / NSF rate, and stable-employment percentage? A property-management company in the area should have these aggregated.
- How much new for-sale + rental construction is in the pipeline within 1–3 miles? Heavy new supply typically softens prices + rents 12–24 months out; constrained supply supports both.
Investment metrics
- 1% rule
- 0.69% ✗
- Cap rate
- 3.72%
- Cash-on-cash
- -9.18%
- DSCR
- 0.59
- GRM
- 12.1
CMA / ARV
- ARV (median comp)
- $269,199
- List price
- $144,900
- Delta
- -46.17%
- Verdict
- UNDERPRICED
- Comps
- 2 within 2.0 mi
Projected returns pro-forma
10.0% appreciation · 3.0% rent growth · sell at horizon
- IRR
- 17.8%
- Equity multiple
- 2.46×
- Total profit
- $59,234
- Equity at exit
- $130,537
- IRR
- 16.7%
- Equity multiple
- 5.69×
- Total profit
- $190,123
- Equity at exit
- $281,509
Cash invested: $40,572 (down + closing). Projections, not guarantees.
Landlord ↔ Tenant lean methodology
- Overall (STATE)
- 15 Strongly Tenant-Friendly
- State New York
- 15 Strongly Tenant-Friendly · D+10
- County
- — inherits STATE
- City
- — inherits STATE
ZIP-level market 13470
- Home prices YoY
- 4.4%
- Active inventory
- 4
- Price-to-rent
- 12.1×
Monthly cashflow live
- Estimated rent
- $1,000 medium interval (Pro) →
- Mortgage (P&I)
- −$760
- Tax from tax record
- −$280 /mo · $3,362/yr
- Insurance
- −$60
- HOA
- −$0
- Vacancy / Maint / Mgmt
- −$210
- Net cashflow
- $-310
Break-even live
Sensitivity live
| Price | -10% $-228 | -5% $-269 | +0% $-310 | +5% $-351 | +10% $-392 |
|---|---|---|---|---|---|
| Rent | -10% $-389 | -5% $-350 | +0% $-310 | +5% $-271 | +10% $-231 |
| Rate | -1.0pp $-237 | -0.5pp $-273 | base $-310 | +0.5pp $-348 | +1.0pp $-386 |
UW: 25.0% down · 7.5% · 30yr · 1.5% tax · 5.0% vac · 8.0% maint · 8.0% mgmt
Financing live
Cash to close
- Down payment
- $36,225
- Closing costs
- $4,347
- Reserves months
- —
- Total cash needed
- —
Loan-product check · same deal, 3 products live
Conventional
25% down · 7.5% · 30yr
- Down + closing
- —
- Monthly P&I
- —
- Monthly cashflow
- —
- DSCR
- —
- Eligible?
- —
Personal DTI + credit; lowest rate.
DSCR
20% down · 8.5% · 30yr
- Down + closing
- —
- Monthly P&I
- —
- Monthly cashflow
- —
- DSCR
- —
- Eligible?
- —
No personal income docs; deal must DSCR.
Hard money
10% down · 12.0% · 12mo
- Down + closing
- —
- Monthly P&I
- —
- Monthly cashflow
- —
- DSCR
- —
- Eligible?
- —
Short-term bridge; refi at stabilization.
Listing history 23 events
-
2026-06-22days on market $144,900 Active 90 DOM
-
2026-06-21days on market $144,900 Active 89 DOM
-
2026-06-21days on market $144,900 Active 88 DOM
-
2026-06-18days on market $144,900 Active 86 DOM
-
2026-06-17days on market $144,900 Active 85 DOM
-
2026-06-16days on market $144,900 Active 84 DOM
-
2026-06-15days on market $144,900 Active 83 DOM
-
2026-06-13days on market $144,900 Active 81 DOM
-
2026-06-12pricedays on market $144,900 Active 80 DOM
-
2026-06-09days on market $159,900 Active 77 DOM
-
2026-06-08days on market $159,900 Active 76 DOM
-
2026-06-07days on market $159,900 Active 75 DOM
-
2026-06-07days on market $159,900 Active 74 DOM
-
2026-06-04days on market $159,900 Active 71 DOM
-
2026-06-02days on market $159,900 Active 70 DOM
-
2026-06-01days on market $159,900 Active 69 DOM
-
2026-05-31days on market $159,900 Active 68 DOM
-
2026-05-05price $159,900 515-char remark
Show marketing remark (515 chars)
Nice ranch on a 5 acre lot surrounded by trees. The interior of the house needs some repairs and cosmetics, but has many quality features. There is a full basement with an overhead door for walkout and plenty of windows. Great space for finishing. The lot is level and there is a large two story shed. * * * Under FinCEN's new RRE Rule, transfers will be subject to reportng when buyers use entities ortrusts to take title to residenial real estate, when the transaction is all cash, privately financed or HELOC.
-
2026-03-23$184,900 Active 515-char remark
Show marketing remark (515 chars)
Nice ranch on a 5 acre lot surrounded by trees. The interior of the house needs some repairs and cosmetics, but has many quality features. There is a full basement with an overhead door for walkout and plenty of windows. Great space for finishing. The lot is level and there is a large two story shed. * * * Under FinCEN's new RRE Rule, transfers will be subject to reportng when buyers use entities ortrusts to take title to residenial real estate, when the transaction is all cash, privately financed or HELOC.
-
2022-12-10historical
-
2022-06-10$199,900 Active
-
2008-08-20historical
-
2008-02-22$149,900
ⓘ Source: listings_history table (triggers on properties + properties_extension) + one-shot
backfill from property_details.listing_events for pre-trigger history.
Tax reassessment forecast NY · Partial reset (capped growth)
- Current annual tax
- $3,362 · $280/mo
- Projected year-2 tax
- $3,362 · $280/mo
- Expected delta
- $0/yr ($0/mo · 0.0%)
ⓘ Screening estimate from a state-policy table — verify with the county assessor before closing.
Climate risk First Street
- Flood 1/10 Low FEMA zone X · 0% chance over 30 yrs
- Wildfire 3/10 Moderate
- Heat 1/10 Low 7 d/yr ≥90°F today · 16 d/yr by 30 yrs out
- Wind 2/10 Low 100% chance of damaging wind over 30 yrs
- Air quality 2/10 Low 0 unhealthy d/yr today · 1 by 30 yrs out
Nearby sold comps map
Loading sold comps map…
Walkable amenities ~0.75 mi
Loading nearby amenities…
Taxation est. · year 1
- Rental income
- $12,002
- − Mortgage interest
- −$8,117
- − Property taxes
- −$3,362
- − Insurance
- −$724
- − Repairs & maintenance
- −$960
- − Management
- −$960
- − Depreciation
- −$4,215
- Taxable loss
- −$6,336
- Est. tax savings @ 24.0%
- +$1,521
- After-tax cash flow
- $-2,202/yr
For passive investors: Depreciation is non-cash, so a rental often shows a tax loss while cash-flowing — sheltering income. Rental losses are passive: they offset passive income freely, and up to $25,000/yr can offset ordinary (W-2) income if you actively participate and your MAGI is under $100k (phasing out to $0 by $150k); unused losses carry forward. On sale, claimed depreciation is recaptured at up to 25%, and gains may owe capital-gains tax (a 1031 exchange can defer both). Figures are a year-1 estimate at your 24.0% rate — not tax advice; consult a CPA.
Schools (NCES district)
- District
- Dolgeville Central School District
- NCES district ID
- 3600001
- Math proficiency
- 30% ▼ -25.00%
- Reading proficiency
- 47% ▲ 2.00%
- Median HH income
- $42,460
- Composite
- 32.46/100
- National rank
- #5715
- State rank
- #541 of 590 in NY
Livability — Salisbury Center
No livability data for this city. (Only ~50 U.S. cities are tracked.)
Census & demographics
- Population (ZIP)
- 771
Population outlook (Fulton County) Hauer SSP2
- Today (2025)
- 51,132 people
- By 2030
- 49,114 · -3.9%
- By 2040
- 44,373 · -13.2%
- By 2050
- 39,321 · -23.1%
- By 2075
- 28,503 · -44.3%
- By 2100
- 19,268 · -62.3%
Race, ethnicity, and origin ACS 2023
- Neighborhood character
- Predominantly White (97%)
- Race & ethnicity
- White 97% Two or more races 3% Hispanic / Latino 2%
- Common ancestry
- Hungarian 5% Romanian 5% Iranian 2%
- Foreign-born
- 0%
Political lean MEDSL · Fulton
- 2024 margin
- Solid R (+35.9) · D 32.1% · R 67.9%
- 2008→2024 swing
- -26.6pp toward R · 2008: -9.2pp · 2024: -35.9pp
- All cycles
- 2024: R+35.9 2020: R+31.4 2016: R+35.5 2012: R+10.5 2008: R+9.2
Not yet ingested
- Civics
- —
Market trends
- HPI YoY
- ▲ 18.67%
- Current HPI
- 444.3402
- Rent YoY
- —
- Metro
- —
- State GDP YoY
- ▲ 2.60%
- F500 in state
- 92
Industry mix (Fortune 500 HQ in NY)
| Industry | F500 HQs | Revenue |
|---|---|---|
| Financial Services | 10 | $950B |
|
||
| Consumer Goods | 9 | $162B |
|
||
| Insurance | 4 | $225B |
|
||
| Telecommunications | 2 | $144B |
|
||
| Pharmaceuticals | 2 | $112B |
|
||
| Media / Entertainment | 2 | $69B |
|
||
Price history
+6.7% since first listed6 events — show timeline
- 2026-05-05 Price Changed $159,900 CNYIS
- 2026-03-23 Listed $184,900 CNYIS
- 2022-12-10 Listing Removed — CNYIS
- 2022-06-10 Listed $199,900 CNYIS
- 2008-08-20 Listing Removed — CNYIS
- 2008-02-22 Listed $149,900 CNYIS
Property tax history
+1.5%/yrLatest (2025): $3,362 · +2.9% YoY. Source: county tax records.
Cash-flow waterfall
monthlySold comps — $/sqft
last 12 mo · ≤1 miLoading sold comps…