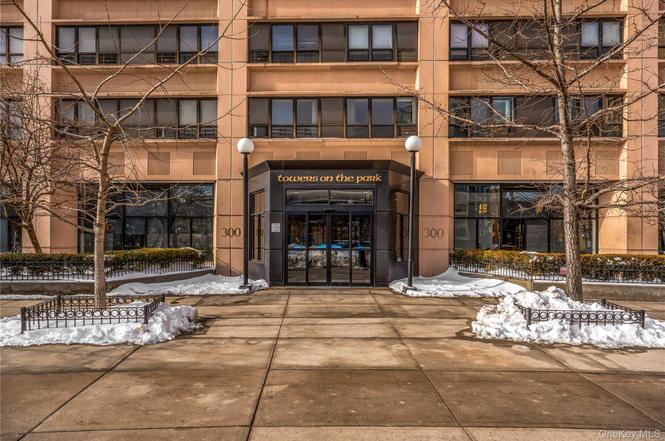
300 Cathedral Pkwy Unit 5K · New York, NY
Flood risk 1/10 · Minimal
- FEMA flood zone
- X (unshaded)
- Chance of flooding over 30 yrs
- 0.0%
- Est. flood insurance / yr
- $507 – $1,088
Fire risk 1/10 · Minimal
- Est. fire insurance / yr
- $691 – $1,283
Heat risk 6/10 · Moderate
- Hot days now (above 99°F)
- 7 days/yr
- Hot days in 30 yrs
- 15 days/yr
Wind risk 6/10 · Moderate
- Chance of severe wind over 30 yrs
- 27.0%
Air-quality risk 4/10 · Minor
- Unhealthy air days now
- 5 days/yr
- Unhealthy air days in 30 yrs
- 6 days/yr
Risk factors via First Street. Map © Google.
Why this score? — see what drove the C- grade
The composite is a weighted blend of 9 inputs, each scored 0–100. Each bar is that input's sub-score; the figure is the points it added to the 100-point composite (weight × sub-score).
- Cash flow +14.8/30.0
- Appreciation +7.6/10.0
- ARV discount +7.5/15.0
- 1% rule +5.4/10.0
- Schools +5.0/10.0
- DSCR +4.5/10.0
- Livability +3.8/5.0
- Rent growth +3.1/5.0
- Condition / age +2.5/5.0
$530,000
🖨 Deal sheet 📄 Offer letter ✓ Due diligence
Listing remarks
Unlock the potential of this one-bedroom condo located in vibrant Harlem, New York. This unit is a true blank canvas, needing a full renovation—perfect for investors or buyers looking to customize and add significant value. Situated in a well-established building, the condo offers a solid layout and the opportunity to reimagine the space from the ground up. The building also features a laundry room and concierge service. Enjoy all that Harlem has to offer, including rich culture, historic architecture, renowned dining, convenient transportation, and close proximity to major Manhattan attractions. With strong rental demand and continued neighborhood growth, this property presents an ex
Key facts
- Laundry room
- Full renovation
- Concierge service
Tags
Property features AI
Finance
- HOA & community: Has homeowners association; Monthly association fee of $530.15
Exterior
- Parking: Assigned parking; Attached parking
- Utilities: Public sewer; Cable connected; Electricity connected; Natural gas connected
- Home design: Condominium; Entry on level 5
- Construction: Stone construction
- Exterior features: Stone exterior; Not waterfront
Interior
- Kitchen: Other appliances (details not specified)
- Bedrooms: 3 total rooms (bedroom count not specified)
- Bathrooms: 1 full bathroom
- Heating & cooling: Central air conditioning; Other heating
- Interior features: Other interior features
- Laundry & utility: Dedicated laundry room
Neighborhood map
What this means for you Summary
Snapshot
- This is a 1-bed/1.0-bath condo listed at $530k.
Deal economics
- At list price, monthly cash flow is $145 ($2k/yr) — positive.
- The deal already cash-flows at list — no discount required.
- Meets the 1% rule at list price ($5k rent vs $530k).
- Recommended offer: $466k (12.0% below list) — sets the bar for market timing.
- Cap rate 6.6% vs local median 2.6% in New York — top-decile yield for the area; either an underpriced asset or a hidden risk that comps aren't pricing in. Stress-test before assuming the spread holds.
Location & tenants
- Location reads 75/100 on livability (#268 in NY, #4,188 nationally) — a middle-class / working-renter tenant base. Strengths: amenities A+, commute A+, health & safety A; Watch: crime F, cost of living F.
- Market conditions: Rents rising (+2.5%/yr); 96 active listings in the ZIP; 31 comparable units currently listed for rent nearby; rentals leasing fast (median 4d on market — plan ~1-2 weeks tenant-placement turnaround); solid renter incomes; 4,467 units permitted in New York County in 2024 (4,463 in 5+ unit buildings).
- At $5,490/mo this rent would consume 81% of the median local household income ($81k/yr) (locally 2685% of renters already pay >50% of income on rent) — very limited rent-growth headroom before tenants either downsize or default.
Forward outlook
- In year one you build about $32k of equity ($4k loan paydown + $28k appreciation (5.3% local appreciation)).
- New York County population projected at +21% by 2050 — long-run rental-demand tailwind backs the buy-and-hold thesis.
- At projected returns (5.3% appreciation + 2.5% rent growth), your $148k cash investment doubles in ~4 years — after that, you're playing with house money.
- By year 2, paydown + projected appreciation supports a ~$51k cash-out refi (75% LTV) — recoverable capital for the next deal without selling this one.
Negotiation context
- It's been on market 134 days — a 12% lower offer ($466k) is reasonable based on typical stale-listing flexibility.
Risks & watch-outs
- Climate carrying-cost: major wind risk, 27% chance of damaging wind over 30y; extreme-heat days projected 7→15/yr by 2055 (HVAC capex compounding) — expect insurance premiums to compound above CPI over the hold.
Questions for the listing agent
- It's been on market 134 days. Have you received any prior offers? Is the seller open to a 12% concession, seller financing, or rate buy-down credit?
- What does the HOA fee cover, when was the last increase, and are there any pending special assessments or reserve-fund shortfalls?
- Any open or pending special assessments — roof, HVAC, plumbing, elevator, façade? What's the per-unit balance and payoff schedule, and is the seller paying it off at close or rolling it to the buyer?
- Why hasn't it sold? Are there any deal-killer items the seller is aware of (foundation, flood, title, zoning, code violations)?
- Is there a deadline driving the sale (1031 exchange, divorce, estate, relocation)? That informs how much negotiation room exists.
- Schools are B-rated — typically a magnet for longer-tenancy family renters. What's the average tenant stay here, and is there a school-zone premium baked into asking?
- Crime grade is F in this area — have there been break-ins, vandalism, or insurance claims at this property in the last 3 years? What carrier currently insures it and at what premium?
- What's the average days-on-market for RENTAL listings here right now (not sales)? A rising rental-DOM trend means longer vacancies and softer asking-rent achievability than the comps imply.
- What's the recent tenant-quality profile in this submarket — average credit score on applications, eviction rate, late-payment / NSF rate, and stable-employment percentage? A property-management company in the area should have these aggregated.
- How much new apartment / multifamily construction is in the pipeline within 1–3 miles? Heavy new supply (>2% of stock underway) typically softens rents 12–24 months out; light construction supports rent growth.
Investment metrics
- 1% rule
- 1.04% ✓
- Cap rate
- 6.62%
- Cash-on-cash
- 1.17%
- DSCR
- 1.05
- GRM
- 8.0
CMA / ARV
No comps found within radius.
Projected returns pro-forma
5.26% appreciation · 2.46% rent growth · sell at horizon
- IRR
- 14.3%
- Equity multiple
- 1.92×
- Total profit
- $136,660
- Equity at exit
- $308,689
- IRR
- 14.7%
- Equity multiple
- 3.67×
- Total profit
- $396,821
- Equity at exit
- $539,787
Cash invested: $148,400 (down + closing). Projections, not guarantees.
Landlord ↔ Tenant lean methodology
- Overall (CITY)
- 0 Strongly Tenant-Friendly
- State New York
- 15 Strongly Tenant-Friendly · D+10
- County
- — inherits STATE
- City New York
- 0 Strongly Tenant-Friendly · D+34
ZIP-level market 10026
- Home prices YoY
- 1.6%
- Rents YoY
- 2.5%
- Active inventory
- 96
- Price-to-rent
- 8.0×
Monthly cashflow live
- Estimated rent
- $5,490 high interval (Pro) →
- Mortgage (P&I)
- −$2,779
- Tax est. 1.5%
- −$662 /mo · $7,950/yr
- Insurance
- −$221
- HOA
- −$530
- Vacancy / Maint / Mgmt
- −$1,153
- Net cashflow
- $145
Break-even live
UW: 25.0% down · 7.5% · 30yr · 1.5% tax · 5.0% vac · 8.0% maint · 8.0% mgmt
Financing live
Cash to close
- Down payment
- $132,500
- Closing costs
- $15,900
- Reserves months
- —
- Total cash needed
- —
Loan-product check · same deal, 3 products live
Conventional
25% down · 7.5% · 30yr
- Down + closing
- —
- Monthly P&I
- —
- Monthly cashflow
- —
- DSCR
- —
- Eligible?
- —
Personal DTI + credit; lowest rate.
DSCR
20% down · 8.5% · 30yr
- Down + closing
- —
- Monthly P&I
- —
- Monthly cashflow
- —
- DSCR
- —
- Eligible?
- —
No personal income docs; deal must DSCR.
Hard money
10% down · 12.0% · 12mo
- Down + closing
- —
- Monthly P&I
- —
- Monthly cashflow
- —
- DSCR
- —
- Eligible?
- —
Short-term bridge; refi at stabilization.
Rent comps 31 comps
| Address | Beds | Baths | Sqft | Rent | $/sqft | DOM | Units | Dist |
|---|---|---|---|---|---|---|---|---|
| 1 Morningside Dr New York, NY | 3.0 | 1.0–2.0 | 1655 | $6,310 | $3.81 | 1d | 1 | 0.22mi |
| 30 Morningside Dr #2096 New York, NY | 1.0–2.0 | 1.0–2.0 | 780 | $5,550 | $7.11 | 3d | 2 | 0.31mi |
| 202 W 102nd St Unit 1053014P New York, NY | 2.0 | 2.0 | 538 | $10,000 | $18.59 | 22d | 1 | 0.50mi |
| 308 W 107th St Unit 1239985P New York, NY | 1.0 | 1.0 | 559 | $8,500 | $15.21 | 22d | 1 | 0.54mi |
| 808 Columbus Ave New York, NY | 2.0 | 1.0–2.0 | 773 | $6,906 | $8.93 | 1d | 31 | 0.55mi |
| 915 W End Ave #1020 New York, NY | 1.0–3.0 | 1.0–2.0 | 851 | $6,210 | $7.30 | 2d | 2 | 0.55mi |
| 814 Amsterdam Ave #1019 New York, NY | 1.0–2.0 | 1.0–2.0 | 800 | $4,800 | $6.00 | 24d | 2 | 0.57mi |
| 788 Columbus Ave #1323 New York, NY | 1.0–3.0 | 1.0–1.5 | 900 | $3,660 | $4.07 | 24d | 2 | 0.57mi |
| 70 W 95th St New York, NY | 1.0–4.0 | 1.0–2.0 | 1095 | $9,999 | $9.13 | 17d | 1 | 0.73mi |
| 266 W 96th St #2030 New York, NY | 1.0 | 1.0 | 512 | $5,800 | $11.33 | 6d | 1 | 0.80mi |
| 255 W 94th St #686 New York, NY | 1.0–2.0 | 1.0–2.0 | 750 | $6,300 | $8.40 | 2d | 2 | 0.84mi |
| 122 E 102nd St Unit 1021896P New York, NY | 2.0 | 1.0 | 742 | $5,429 | $7.32 | 16d | 1 | 0.89mi |
| 212 W 91st St New York, NY | 1.0–2.0 | 1.0–2.0 | 825 | $4,695 | $5.69 | 3d | 4 | 0.99mi |
| 212 W 91st St New York, NY | 1.0–2.0 | 1.0–2.0 | 825 | $4,725 | $5.73 | 3d | 3 | 0.99mi |
| 212 W 91st St #416 New York, NY | 1.0–2.0 | 1.0–2.0 | 825 | $6,270 | $7.60 | 6d | 2 | 0.99mi |
| 189 W 89th St New York, NY | 2.0 | 1.0–2.0 | 716 | $6,414 | $8.95 | 1d | 13 | 1.01mi |
| 1501 Lexington Ave #932 New York, NY | 1.0 | 1.0 | 583 | $5,580 | $9.56 | 3d | 2 | 1.05mi |
| 210 W 89th St #165 New York, NY | 1.0 | 1.0 | 675 | $7,520 | $11.14 | 2d | 2 | 1.08mi |
| 175 E 96th St Unit 1251683P New York, NY | 2.0 | 1.0 | 600 | $5,305 | $8.84 | 3d | 2 | 1.11mi |
| 215 E 96th St Unit 688 New York, NY | 1.0 | 1.0 | 717 | $7,960 | $11.10 | 3d | 1 | 1.17mi |
| 43 W 85th St Unit 1470323P New York, NY | 1.0 | 1.0 | 699 | $6,466 | $9.25 | 5d | 1 | 1.19mi |
| 215 E 95th St #1293 New York, NY | 1.0–2.0 | 1.0–1.5 | 740 | $5,520 | $7.46 | 2d | 2 | 1.21mi |
| 132 W 134th St New York, NY | 2.0 | 1.0 | 750 | $4,500 | $6.00 | 24d | 1 | 1.27mi |
| 160 E 88th St #1332 New York, NY | 1.0 | 1.0 | 560 | $5,670 | $10.12 | 6d | 1 | 1.37mi |
| 200 E 89th St Unit 12G New York, NY | 1.0 | 1.0 | 650 | $5,000 | $7.69 | 18d | 1 | 1.39mi |
| 45 W 81st St Unit 2011 New York, NY | 1.0 | 1.0 | 450 | $4,710 | $10.47 | 24d | 1 | 1.39mi |
| 345 E 94th St #1470 New York, NY | 2.0 | 1.0–2.0 | 710 | $5,645 | $7.95 | 3d | 3 | 1.40mi |
| 235 E 89th St Unit 1495783P New York, NY | 2.0 | 1.0 | 699 | $7,443 | $10.65 | 20d | 1 | 1.45mi |
| 201 E 86th St #298 New York, NY | 1.0–2.0 | 1.0–1.5 | 700 | $7,210 | $10.30 | 3d | 2 | 1.47mi |
| 1001 5th Ave Unit 3 New York, NY | 1.0 | 1.0 | 450 | $5,400 | $12.00 | 24d | 1 | 1.49mi |
| 354 E 91st St #648 New York, NY | 1.0–2.0 | 1.0 | 692 | $5,600 | $8.09 | 2d | 2 | 1.50mi |
HOA detail condo
- Monthly dues
- $530 · $6,360/yr
- Likely covers
- doorman
- Assessments
- None detected in remarks — confirm with the listing agent.
Listing history 11 events
-
2026-06-18days on market $530,000 Active 134 DOM
-
2026-06-17days on market $530,000 Active 133 DOM
-
2026-06-15days on market $530,000 Active 131 DOM
-
2026-06-13days on market $530,000 Active 129 DOM
-
2026-06-10days on market $530,000 Active 125 DOM
-
2026-06-08days on market $530,000 Active 124 DOM
-
2026-06-04days on market $530,000 Active 120 DOM
-
2026-06-03days on market $530,000 Active 119 DOM
-
2026-06-01days on market $530,000 Active 117 DOM
-
2026-05-31days on market $530,000 Active 116 DOM
-
2026-02-04$530,000 Active
ⓘ Source: listings_history table (triggers on properties + properties_extension) + one-shot
backfill from property_details.listing_events for pre-trigger history.
Climate risk First Street
- Flood 1/10 Low FEMA zone X (unshaded) · 0% chance over 30 yrs
- Wildfire 1/10 Low
- Heat 6/10 Major 7 d/yr ≥99°F today · 15 d/yr by 30 yrs out
- Wind 6/10 Major 27% chance of damaging wind over 30 yrs
- Air quality 4/10 Moderate 5 unhealthy d/yr today · 6 by 30 yrs out
Nearby sold comps map
Loading sold comps map…
Walkable amenities ~0.75 mi
Loading nearby amenities…
Taxation est. · year 1
- Rental income
- $65,885
- − Mortgage interest
- −$29,688
- − Property taxes
- −$7,950
- − Insurance
- −$2,650
- − Repairs & maintenance
- −$5,271
- − Management
- −$5,271
- − HOA
- −$6,360
- − Depreciation
- −$15,418
- Taxable loss
- −$6,723
- Est. tax savings @ 24.0%
- +$1,614
- After-tax cash flow
- $3,350/yr
For passive investors: Depreciation is non-cash, so a rental often shows a tax loss while cash-flowing — sheltering income. Rental losses are passive: they offset passive income freely, and up to $25,000/yr can offset ordinary (W-2) income if you actively participate and your MAGI is under $100k (phasing out to $0 by $150k); unused losses carry forward. On sale, claimed depreciation is recaptured at up to 25%, and gains may owe capital-gains tax (a 1031 exchange can defer both). Figures are a year-1 estimate at your 24.0% rate — not tax advice; consult a CPA.
Schools (NCES district)
No district data.
Livability — New York
- Score
- 75/100
- State rank
- #268
- US rank
- #4188
Category grades
Schools grade is shown separately in the Schools card above.
Census & demographics
- Census place
- New York, NY
- County
- New York County · 1,599,927 people
- City population
- 7,731,280
- Metro
- New York-Newark-Jersey City, NY-NJ-PA
- Population (ZIP)
- 37,123
- Household income
- $81,244
- Rent vs Own
- Severe rent burden
- 2685.0
Population outlook (New York County) Hauer SSP2
- Today (2025)
- 1,825,725 people
- By 2030
- 1,904,611 · +4.3%
- By 2040
- 2,052,719 · +12.4%
- By 2050
- 2,206,601 · +20.9%
- By 2075
- 2,509,427 · +37.4%
- By 2100
- 2,702,933 · +48.0%
Race, ethnicity, and origin ACS 2023
- Neighborhood character
- Diverse neighborhood (Simpson 0.69)
- Race & ethnicity
- Black 45% White 25% Hispanic / Latino 18% Two or more races 11% Asian 6%
- Hispanic origin (detail)
- Mexican 1% Puerto Rican 4% Dominican 8%
- Common ancestry
- Lithuanian 2% Hispanic 2% Scotch-Irish 1%
- Foreign-born
- 27% · Canada, China, Vietnam
- Languages at home
- 67% English-only · Spanish 14% French/Haitian/Cajun 8% Other Indo-European 2%
Political lean MEDSL · New York
- 2024 margin
- Solid D (+64.8) · D 82.4% · R 17.6%
- 2008→2024 swing
- -7.4pp toward R · 2008: 72.2pp · 2024: 64.8pp
- All cycles
- 2024: D+64.8 2020: D+74.5 2016: D+77.2 2012: D+69.6 2008: D+72.2
Not yet ingested
- Civics
- —
Market trends
- HPI YoY
- ▲ 5.26%
- Current HPI
- 330.628
- Rent YoY
- ▲ 2.46%
- Metro
- New York-Newark-Jersey City, NY-NJ-PA
- State GDP YoY
- ▲ 2.60%
- F500 in state
- 92
Industry mix (Fortune 500 HQ in NY)
| Industry | F500 HQs | Revenue |
|---|---|---|
| Financial Services | 10 | $950B |
|
||
| Consumer Goods | 9 | $162B |
|
||
| Insurance | 4 | $225B |
|
||
| Telecommunications | 2 | $144B |
|
||
| Pharmaceuticals | 2 | $112B |
|
||
| Media / Entertainment | 2 | $69B |
|
||
Price history
1 event — show timeline
- 2026-02-04 Listed $530,000 OneKey® MLS as Distributed by MLS Grid
Cash-flow waterfall
monthlySold comps — $/sqft
last 12 mo · ≤1 miLoading sold comps…