 🏗️ New Construction
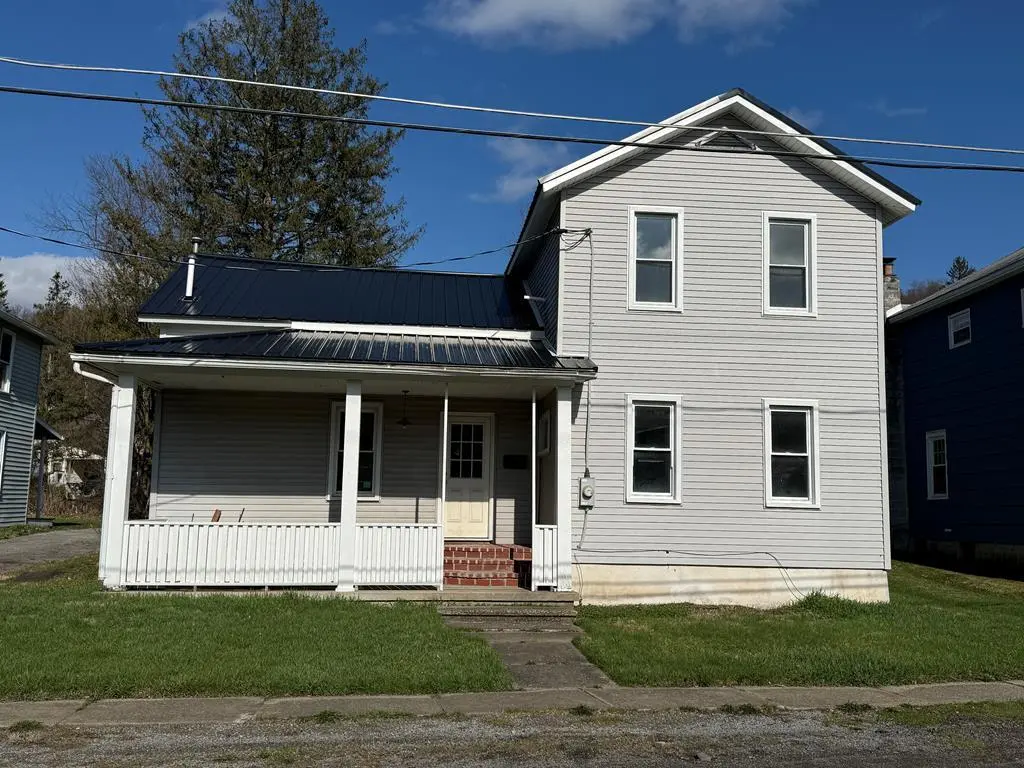
120 Morris St · Blossburg, PA
Flood risk 1/10 · Minimal
- FEMA flood zone
- X (unshaded)
- Chance of flooding over 30 yrs
- 0.0%
- Est. flood insurance / yr
- $473 – $860
Fire risk 2/10 · Minimal
- Est. fire insurance / yr
- $511 – $949
Heat risk 3/10 · Minor
- Hot days now (above 91°F)
- 8 days/yr
- Hot days in 30 yrs
- 17 days/yr
Wind risk 2/10 · Minimal
- Chance of severe wind over 30 yrs
- 1.0%
Air-quality risk 2/10 · Minimal
- Unhealthy air days now
- 0 days/yr
- Unhealthy air days in 30 yrs
- 1 days/yr
Risk factors via First Street. Map © Google.
Why this score? — see what drove the D- grade
The composite is a weighted blend of 9 inputs, each scored 0–100. Each bar is that input's sub-score; the figure is the points it added to the 100-point composite (weight × sub-score).
- ARV discount +7.5/15.0
- Appreciation +7.4/10.0
- Cash flow +6.8/30.0
- Livability +3.6/5.0
- Schools +3.0/10.0
- Rent growth +2.5/5.0
- Condition / age +2.5/5.0
- 1% rule +1.7/10.0
- DSCR +1.1/10.0
$79,900
🖨 Deal sheet 📄 Offer letter ✓ Due diligence
Listing remarks MLS
This 4 bedroom 2 bathroom home is in need of a vision and some finishing. The main items are already done. The home was totally gutted and rebuilt. New electrical, drywall, windows, subfloors, etc. New siding and roof. With some TLC, this home could be a super flip or personal home.
Key facts
- New drywall
- New siding
- New electrical
Tags
Property features AI
Exterior
- Parking: No designated parking
- Utilities: Public water; 200+ amp electrical service
- Home design: Residential property; Under construction
- Construction: Stone and vinyl siding construction; Stone foundation (see remarks); Metal roof; Built recently / under construction
- Exterior features: Covered porch; Level, cleared lot; Has view
Interior
- Kitchen: Range; Dishwasher; Refrigerator
- Bedrooms: 6 total rooms (bedrooms included)
- Flooring: Other
- Bathrooms: 2 full bathrooms
- Heating & cooling: No central cooling; Heating: see remarks
- Interior features: Pantry; Covered porch
- Laundry & utility: Washer and Dryer included; Laundry on main level
Neighborhood map
What this means for you Summary
Snapshot
- This is a 3-bed/2.0-bath single-family listed at $80k.
Deal economics
- At list price, monthly cash flow is $-238 ($-3k/yr) — negative.
- The deal already cash-flows at list — no discount required.
- Meets the 1% rule at list price ($1k rent vs $80k).
Location & tenants
- Location reads 71/100 on livability (#671 in PA) — a middle-class / working-renter tenant base. Strengths: crime A+, cost of living A+, housing A+; Watch: health & safety D, schools F, amenities F.
- Southern Tioga SD (rural): math 25% / reading 45% proficiency, ranked #421 of 539 in PA (top 78%) — families likely to look elsewhere, expect single-tenant / working-renter base with shorter leases.
- Market conditions: 14 active listings in the ZIP; 32 units permitted in Tioga County in 2024 (0 in 5+ unit buildings).
Forward outlook
- In year one you build about $9k of equity ($1k loan paydown + $7k appreciation (4.8% local appreciation)).
- Tioga County population projected at -20% by 2050 — secular population decline; favor cash flow + early exit over multi-decade hold.
- By year 5, paydown + projected appreciation supports a ~$37k cash-out refi (75% LTV) — recoverable capital for the next deal without selling this one.
Negotiation context
- Only 9 days on market — expect competitive offers; lowballing is unlikely to land.
- 5 sale attempts since 8y ago with the ask held roughly flat each time — persistent listings suggest the price (not the market) is what's stuck; bring a comps-based counter.
Risks & watch-outs
- Watch-outs: property tax is 2.7% of price; built in 1901 — expect roof / HVAC / electrical / plumbing capex.
Questions for the listing agent
- What do current leases actually rent for vs. the listed asking? Can we see a recent rent roll and the last 12 months of T-12 income?
- Built in 1901 — when were the roof, HVAC, electrical panel, plumbing, and water heater last replaced?
- Property tax is high relative to price — has the assessment been appealed recently, and will the sale trigger a re-assessment?
- Is there a deadline driving the sale (1031 exchange, divorce, estate, relocation)? That informs how much negotiation room exists.
- Schools are F-rated, which usually means shorter tenancies and higher turnover. Who's the typical renter profile here, and what's been the actual vacancy rate?
- The area grade is low — what's the realistic commute time and amenity access for the typical tenant pool here? Any planned neighborhood developments (good or bad) we should know about?
- What's the average days-on-market for RENTAL listings here right now (not sales)? A rising rental-DOM trend means longer vacancies and softer asking-rent achievability than the comps imply.
- What's the recent tenant-quality profile in this submarket — average credit score on applications, eviction rate, late-payment / NSF rate, and stable-employment percentage? A property-management company in the area should have these aggregated.
- How much new for-sale + rental construction is in the pipeline within 1–3 miles? Heavy new supply typically softens prices + rents 12–24 months out; constrained supply supports both.
Investment metrics
- 1% rule
- 0.67% ✗
- Cap rate
- 4.45%
- Cash-on-cash
- -6.60%
- DSCR
- 0.71
- GRM
- 12.5
CMA / ARV
- ARV (median comp)
- $154,875
- List price
- $79,900
- Delta
- -48.41%
- Verdict
- UNDERPRICED
- Comps
- 16 within 1.0 mi
Show comp detail 5 sales within ~0.75 mi
| Address | Dist | Beds/Ba | Sqft | Sold | Price | $/sf | Match |
|---|---|---|---|---|---|---|---|
| 105 Mcintyre St | 0.11mi | 2/1.0 (-1) | 1,464 (+1%) | 18mo | $138,000 | $94 | 69 |
| 101 Bleeker St | 0.06mi | 3/2.0 | 1,636 (+13%) | 16mo | $168,000 | $103 | 62 |
| 311 Ruah St | 0.39mi | 3/1.5 | 1,636 (+13%) | 9mo | $166,000 | $101 | 50 |
| 138 Taber St | 0.48mi | 3/1.0 | 1,292 (-11%) | 13mo | $92,000 | $71 | 45 |
| 143 Hanibal St | 0.26mi | 4/1.0 (+1) | 1,272 (-12%) | 16mo | $120,000 | $94 | 45 |
Match score weights: distance 35% · size 25% · config 20% · recency 20%. Top-matched comps best support the ARV.
Projected returns pro-forma
4.84% appreciation · 3.0% rent growth · sell at horizon
- IRR
- 6.9%
- Equity multiple
- 1.44×
- Total profit
- $19,098
- Equity at exit
- $86,250
- IRR
- 9.0%
- Equity multiple
- 2.65×
- Total profit
- $71,584
- Equity at exit
- $147,618
Cash invested: $43,365 (down + closing). Projections, not guarantees.
Landlord ↔ Tenant lean methodology
- Overall (STATE)
- 62 Landlord-Friendly
- State Pennsylvania
- 62 Landlord-Friendly · EVEN
- County
- — inherits STATE
- City
- — inherits STATE
ZIP-level market 16912
- Home prices YoY
- 2.1%
- Active inventory
- 14
- Price-to-rent
- 6.4×
Monthly cashflow live
- Estimated rent
- $1,033 medium interval (Pro) →
- Mortgage (P&I)
- −$812
- Tax from tax record
- −$177 /mo · $2,130/yr
- Insurance
- −$65
- HOA
- −$0
- Vacancy / Maint / Mgmt
- −$217
- Net cashflow
- $-238
Break-even live
UW: 25.0% down · 7.5% · 30yr · 1.5% tax · 5.0% vac · 8.0% maint · 8.0% mgmt
Financing live
Cash to close
- Down payment
- $38,719
- Closing costs
- $4,646
- Reserves months
- —
- Total cash needed
- —
Loan-product check · same deal, 3 products live
Conventional
25% down · 7.5% · 30yr
- Down + closing
- —
- Monthly P&I
- —
- Monthly cashflow
- —
- DSCR
- —
- Eligible?
- —
Personal DTI + credit; lowest rate.
DSCR
20% down · 8.5% · 30yr
- Down + closing
- —
- Monthly P&I
- —
- Monthly cashflow
- —
- DSCR
- —
- Eligible?
- —
No personal income docs; deal must DSCR.
Hard money
10% down · 12.0% · 12mo
- Down + closing
- —
- Monthly P&I
- —
- Monthly cashflow
- —
- DSCR
- —
- Eligible?
- —
Short-term bridge; refi at stabilization.
Listing history 10 events
-
2026-05-10status Pending 283-char remark
Show marketing remark (283 chars)
This 4 bedroom 2 bathroom home is in need of a vision and some finishing. The main items are already done. The home was totally gutted and rebuilt. New electrical, drywall, windows, subfloors, etc. New siding and roof. With some TLC, this home could be a super flip or personal home.
-
2026-05-09status Pending 283-char remark
-
2026-04-29$79,900 Active 283-char remark
Show marketing remark (283 chars)
This 4 bedroom 2 bathroom home is in need of a vision and some finishing. The main items are already done. The home was totally gutted and rebuilt. New electrical, drywall, windows, subfloors, etc. New siding and roof. With some TLC, this home could be a super flip or personal home.
-
2025-10-19status Active
-
2025-04-18price $89,000
-
2024-10-21$99,000 Active
-
2019-03-22soldstatus
-
2018-09-10$12,500
-
2001-11-09soldstatus $49,700
ⓘ Source: listings_history table (triggers on properties + properties_extension) + one-shot
backfill from property_details.listing_events for pre-trigger history.
Tax reassessment forecast PA · Partial reset (capped growth)
- Current annual tax
- $2,130 · $177/mo
- Projected year-2 tax
- $2,130 · $177/mo
- Expected delta
- $0/yr ($0/mo · 0.0%)
ⓘ Screening estimate from a state-policy table — verify with the county assessor before closing.
Climate risk First Street
- Flood 1/10 Low FEMA zone X (unshaded) · 0% chance over 30 yrs
- Wildfire 2/10 Low
- Heat 3/10 Moderate 8 d/yr ≥91°F today · 17 d/yr by 30 yrs out
- Wind 2/10 Low 100% chance of damaging wind over 30 yrs
- Air quality 2/10 Low 0 unhealthy d/yr today · 1 by 30 yrs out
Nearby sold comps map
Loading sold comps map…
Walkable amenities ~0.75 mi
Loading nearby amenities…
Taxation est. · year 1
- Rental income
- $12,393
- − Mortgage interest
- −$8,675
- − Property taxes
- −$2,130
- − Insurance
- −$774
- − Repairs & maintenance
- −$991
- − Management
- −$991
- − Depreciation
- −$4,505
- Taxable loss
- −$5,675
- Est. tax savings @ 24.0%
- +$1,362
- After-tax cash flow
- $-1,498/yr
For passive investors: Depreciation is non-cash, so a rental often shows a tax loss while cash-flowing — sheltering income. Rental losses are passive: they offset passive income freely, and up to $25,000/yr can offset ordinary (W-2) income if you actively participate and your MAGI is under $100k (phasing out to $0 by $150k); unused losses carry forward. On sale, claimed depreciation is recaptured at up to 25%, and gains may owe capital-gains tax (a 1031 exchange can defer both). Figures are a year-1 estimate at your 24.0% rate — not tax advice; consult a CPA.
Schools (NCES district)
- District
- Southern Tioga SD
- NCES district ID
- 4222370
- Math proficiency
- 25% ▼ -15.00%
- Reading proficiency
- 45% ▼ -10.00%
- Median HH income
- $44,260
- Composite
- 29.72/100
- National rank
- #6451
- State rank
- #421 of 539 in PA
Livability — Blossburg
- Score
- 71/100
- State rank
- #671
- US rank
- #6538
Category grades
Schools grade is shown separately in the Schools card above.
Census & demographics
- Census place
- Blossburg, PA
- City population
- 2,524
- Population (ZIP)
- 2,524
Population outlook (Tioga County) Hauer SSP2
- Today (2025)
- 40,253 people
- By 2030
- 38,795 · -3.6%
- By 2040
- 35,376 · -12.1%
- By 2050
- 32,081 · -20.3%
- By 2075
- 24,341 · -39.5%
- By 2100
- 17,180 · -57.3%
Race, ethnicity, and origin ACS 2023
- Neighborhood character
- Predominantly White (95%)
- Race & ethnicity
- White 95% Two or more races 2% Black 1% Asian 1%
- Common ancestry
- Romanian 11% Slovak 2% Polish 2%
- Foreign-born
- 2% · South Korea
- Languages at home
- 98% English-only · German/W. Germanic 1% Other Indo-European 1%
Political lean MEDSL · Tioga
- 2024 margin
- Solid R (+51.8) · D 23.6% · R 75.4% · Other 1.0%
- 2008→2024 swing
- -24.3pp toward R · 2008: -27.4pp · 2024: -51.8pp
- All cycles
- 2024: R+51.8 2020: R+51.2 2016: R+53.6 2012: R+34.8 2008: R+27.4
Not yet ingested
- Civics
- —
Market trends
- HPI YoY
- ▲ 4.84%
- Current HPI
- 233.5174
- Rent YoY
- —
- Metro
- —
- State GDP YoY
- ▲ 1.68%
- F500 in state
- 34
Industry mix (Fortune 500 HQ in PA)
| Industry | F500 HQs | Revenue |
|---|---|---|
| Healthcare | 2 | $309B |
|
||
| Insurance | 2 | $27B |
|
||
| Telecommunications / Media | 1 | $124B |
|
||
| Industrial Distribution | 1 | $22B |
|
||
| Financial Services | 1 | $20B |
|
||
| Chemicals / Materials | 1 | $18B |
|
||
Price history
+40.8% since first listed12 events — show timeline
- 2026-06-09 Sold (MLS) $70,000 NMPA
- 2026-06-09 Sold (MLS) — WBVAR
- 2026-05-10 Pending — NMPA
- 2026-05-09 Pending — WBVAR
- 2026-04-29 Listed $79,900 WBVAR
- 2026-04-29 Listed $79,900 NMPA
- 2025-10-19 Relisted — NMPA
- 2025-04-18 Price Changed $89,000 NMPA
- 2024-10-21 Listed $99,000 NMPA
- 2019-03-22 Sold (MLS) — WBVAR
- 2018-09-10 Listed $12,500 WBVAR
- 2001-11-09 Sold (Public Records) $49,700 Public Records
Property tax history
+5.3%/yrLatest (2026): $2,130 · +1.0% YoY. Source: county tax records.
Cash-flow waterfall
monthlySold comps — $/sqft
last 12 mo · ≤1 miLoading sold comps…