 🏗️ New Construction
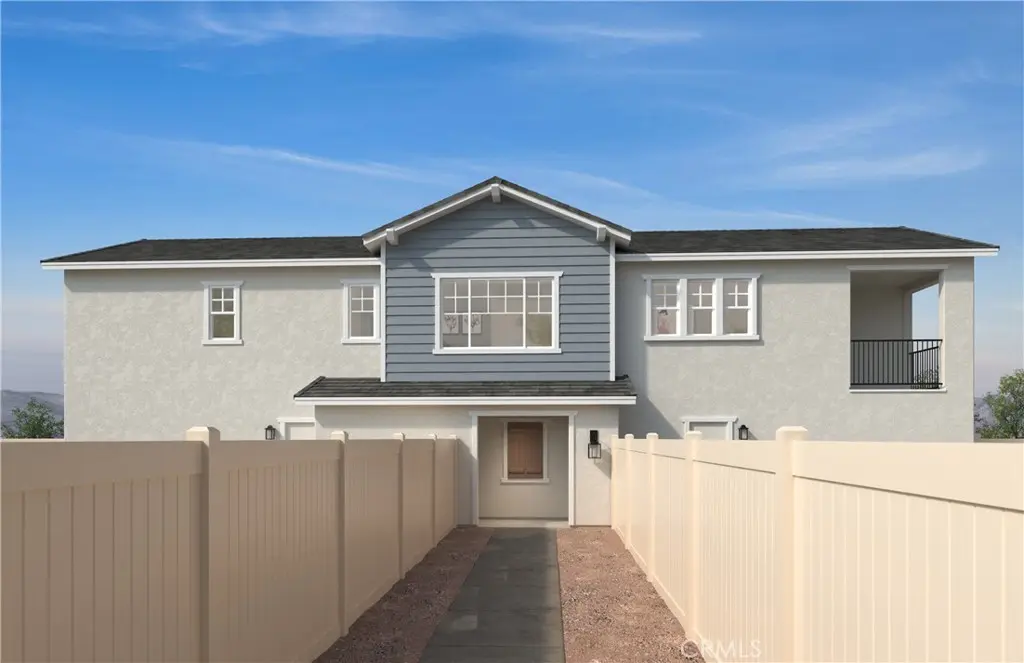
30916 Mossy Brook St · Winchester, CA
Flood risk 1/10 · Minimal
- FEMA flood zone
- X (unshaded)
- Chance of flooding over 30 yrs
- 0.0%
- Est. flood insurance / yr
- $507 – $1,088
Fire risk 7/10 · Major
- Est. fire insurance / yr
- $659 – $1,223
Heat risk 8/10 · Major
- Hot days now (above 105°F)
- 7 days/yr
- Hot days in 30 yrs
- 21 days/yr
Wind risk 1/10 · Minimal
- Chance of severe wind over 30 yrs
- —
Air-quality risk 6/10 · Moderate
- Unhealthy air days now
- 10 days/yr
- Unhealthy air days in 30 yrs
- 14 days/yr
Risk factors via First Street. Map © Google.
Why this score? — see what drove the F grade
The composite is a weighted blend of 9 inputs, each scored 0–100. Each bar is that input's sub-score; the figure is the points it added to the 100-point composite (weight × sub-score).
- Appreciation +10.0/10.0
- ARV discount +7.5/15.0
- Cash flow +4.6/30.0
- Livability +2.6/5.0
- Schools +2.5/10.0
- Condition / age +2.5/5.0
- Rent growth +2.3/5.0
- 1% rule +1.5/10.0
- DSCR +0.0/10.0
$475,729
🖨 Deal sheet (PDF) 📄 Offer letter ✓ Due diligence
Listing remarks
Beautiful Deerfield community Craftsman style 2 story home, single level living. Featuring beautiful white cabinets, granite kitchen countertops, and stainless whirlpool appliances. Primary bathroom includes a walk-in shower and walk-in closet. Enjoy your spacious living space and a private balcony. Residents at Creekstone will have access to a recreational area with pool and spa, a multi-purpose lawn and a BBQ/picnic area. The community is located adjacent to the new Willow Glen public park. Homeowners can also enjoy nearby recreation at Diamond Lake Community Park and the convenience to Hwy. 79. Plus, Creekstone is only minutes to shopping, dining, and entertainment at Menifee Town Center
Key facts
- White cabinets
- Walk-in closet
- Walk-in shower
Tags
Property features AI
Finance
- Other: Property is one unit in the community; No accessory dwelling unit
- Financial info: Assessments: Mello-Roos
- HOA & community: Part of Prime homeowners association; Monthly association fee of $397; Community amenities include pool, spa, dog park and barbecue; Community features include curbs, street lighting, sidewalks and storm drains; Community of 99 units
Exterior
- Parking: Attached garage; 2 garage parking spaces (total 2 spaces)
- Utilities: Public sewer; District/public water
- Home design: Condominium; Two stories; Entry on front at level 1; No shared/common walls; Under construction
- Construction: Builder-listed year built source; Energy-efficient construction elements (insulation, roofing, electrical/lighting, doors, HVAC, windows)
- Exterior features: House structure; Association pool and spa; Sprinklers (drip system); Flow control water conservation
Interior
- Kitchen: Granite counters; Energy Star appliances; Microwave; Electric range and oven; Energy Star water heater
- Bedrooms: Primary bedroom (upstairs); All bedrooms located upstairs
- Flooring: See remarks
- Bathrooms: 2 full bathrooms; Walk-in shower in primary bath
- Heating & cooling: Energy Star heating; Central cooling (Energy Star)
- Interior features: High ceilings (9 feet+); Open floor plan; Granite counters; Energy Star doors; Energy Star windows; Walk-in closet; Association spa
- Laundry & utility: Indoor laundry room (individual room)
Neighborhood map
What this means for you Summary
Snapshot
- This is a 3-bed/2.0-bath condo listed at $476k.
Deal economics
- At list price, monthly cash flow is $-1k ($-16k/yr) — negative.
- To cash-flow at today's rent, offer at most $340k (28.6% below list).
- To meet the 1% rule (rent ≥ 1% of price), the offer needs to be $347k (27.0% below list).
- Recommended offer: $340k (28.6% below list) — sets the bar for cash-flow.
Location & tenants
- Location reads 52/100 on livability (#992 in CA) — a working-class tenant base; expect higher turnover. Strengths: crime B; Watch: amenities F, commute F, cost of living F.
- Hemet Unified (suburban): math 19% / reading 41% proficiency, ranked #360 of 517 in CA (top 70%) — families likely to look elsewhere, expect single-tenant / working-renter base with shorter leases; 66% free/reduced lunch — lower-income household profile, screen leases tightly.
- Zoned schools: Winchester Elementary (683 students, 79% FRL); Rancho Viejo Middle (math 24% / reading 24%, grade F, #277 of 498 statewide, top 73%, 975 students, 88% FRL); Tahquitz High (math 14% / reading 42%, grade F, #777 of 1,170 statewide, top 67%, 1,727 students, 88% FRL) — zoned schools average 85% FRL vs 66% district-wide (19 pts higher); higher-poverty schools than district average — tighter screening recommended.
- Market conditions: Rents soft (-0.8%/yr); 353 active listings in the ZIP; 22 comparable units currently listed for rent nearby; rentals leasing fast (median 14d on market — plan ~1-2 weeks tenant-placement turnaround); high-income renter base; 9,195 units permitted in Riverside County in 2024 (1,512 in 5+ unit buildings).
- This rent runs 31% of the median local income ($133k/yr) — at the standard rent-burdened threshold; future hikes will face affordability resistance.
Forward outlook
- In year one you build about $58k of equity ($4k loan paydown + $54k appreciation (10.0% local appreciation)).
- Riverside County population projected at +22% by 2050 — long-run rental-demand tailwind backs the buy-and-hold thesis.
- By year 2, paydown + projected appreciation supports a ~$92k cash-out refi (75% LTV) — recoverable capital for the next deal without selling this one.
Negotiation context
- It's been on market 46 days — a 3% lower offer ($461k) is reasonable based on typical stale-listing flexibility.
- 2 sale attempts; this cycle's ask is 6% above the opening price — seller raised mid-cycle; expect resistance to lowballs.
Risks & watch-outs
- Climate carrying-cost: major wildfire risk; extreme-heat days projected 7→21/yr by 2055 (HVAC capex compounding) — expect insurance premiums to compound above CPI over the hold.
Questions for the listing agent
- What do current leases actually rent for vs. the listed asking? Can we see a recent rent roll and the last 12 months of T-12 income?
- It's been on market 46 days. Have you received any prior offers? Is the seller open to a 29% concession, seller financing, or rate buy-down credit?
- What does the HOA fee cover, when was the last increase, and are there any pending special assessments or reserve-fund shortfalls?
- Any open or pending special assessments — roof, HVAC, plumbing, elevator, façade? What's the per-unit balance and payoff schedule, and is the seller paying it off at close or rolling it to the buyer?
- Is there a deadline driving the sale (1031 exchange, divorce, estate, relocation)? That informs how much negotiation room exists.
- Schools are D-rated, which usually means shorter tenancies and higher turnover. Who's the typical renter profile here, and what's been the actual vacancy rate?
- The area grade is low — what's the realistic commute time and amenity access for the typical tenant pool here? Any planned neighborhood developments (good or bad) we should know about?
- What's the average days-on-market for RENTAL listings here right now (not sales)? A rising rental-DOM trend means longer vacancies and softer asking-rent achievability than the comps imply.
- What's the recent tenant-quality profile in this submarket — average credit score on applications, eviction rate, late-payment / NSF rate, and stable-employment percentage? A property-management company in the area should have these aggregated.
- How much new apartment / multifamily construction is in the pipeline within 1–3 miles? Heavy new supply (>2% of stock underway) typically softens rents 12–24 months out; light construction supports rent growth.
Investment metrics
- 1% rule
- 0.65% ✗
- Cap rate
- 3.23%
- Cash-on-cash
- -10.93%
- DSCR
- 0.51
- GRM
- 12.9
CMA / ARV
- ARV (median comp)
- $538,106
- List price
- $475,729
- Delta
- -11.59%
- Verdict
- UNDERPRICED
- Comps
- 20 within 1.0 mi
Projected returns pro-forma
10.0% appreciation · 0.0% rent growth · sell at horizon
- IRR
- 15.9%
- Equity multiple
- 2.30×
- Total profit
- $195,816
- Equity at exit
- $484,769
- IRR
- 14.9%
- Equity multiple
- 5.17×
- Total profit
- $627,714
- Equity at exit
- $1,045,422
Cash invested: $150,670 (down + closing). Projections, not guarantees.
Landlord ↔ Tenant lean methodology
- Overall (STATE)
- 18 Strongly Tenant-Friendly
- State California
- 18 Strongly Tenant-Friendly · D+13
- County
- — inherits STATE
- City
- — inherits STATE
ZIP-level market 92596
- Home prices YoY
- 3.9%
- Rents YoY
- -0.8%
- Active inventory
- 353
- Price-to-rent
- 11.4×
Monthly cashflow live
- Estimated rent
- $3,473 high interval (Pro) →
- Mortgage (P&I)
- −$2,822
- Tax est. 1.5%
- −$673 /mo · $8,072/yr
- Insurance
- −$224
- HOA
- −$397
- Vacancy / Maint / Mgmt
- −$729
- Net cashflow
- $-1,372
Break-even live
Sensitivity live
| Price | -10% $-1,000 | -5% $-1,186 | +0% $-1,372 | +5% $-1,558 | +10% $-1,744 |
|---|---|---|---|---|---|
| Rent | -10% $-1,646 | -5% $-1,509 | +0% $-1,372 | +5% $-1,235 | +10% $-1,097 |
| Rate | -1.0pp $-1,101 | -0.5pp $-1,235 | base $-1,372 | +0.5pp $-1,511 | +1.0pp $-1,653 |
UW: 25.0% down · 7.5% · 30yr · 1.5% tax · 5.0% vac · 8.0% maint · 8.0% mgmt
Financing live
Cash to close
- Down payment
- $134,527
- Closing costs
- $16,143
- Reserves months
- —
- Total cash needed
- —
Loan-product check · same deal, 3 products live
Conventional
25% down · 7.5% · 30yr
- Down + closing
- —
- Monthly P&I
- —
- Monthly cashflow
- —
- DSCR
- —
- Eligible?
- —
Personal DTI + credit; lowest rate.
DSCR
20% down · 8.5% · 30yr
- Down + closing
- —
- Monthly P&I
- —
- Monthly cashflow
- —
- DSCR
- —
- Eligible?
- —
No personal income docs; deal must DSCR.
Hard money
10% down · 12.0% · 12mo
- Down + closing
- —
- Monthly P&I
- —
- Monthly cashflow
- —
- DSCR
- —
- Eligible?
- —
Short-term bridge; refi at stabilization.
Rent comps 22 comps
| Address | Beds | Baths | Sqft | Rent | $/sqft | DOM | Units | Dist |
|---|---|---|---|---|---|---|---|---|
| 30816 Viper Ct Winchester, CA | 3.0 | 2.5 | 1583 | $3,249 | $2.05 | 6d | 1 | 0.57mi |
| 30622 Dart Ct Winchester, CA | 3.0 | 2.5 | 1378 | $4,300 | $3.12 | 3d | 1 | 0.61mi |
| 28635 Matador Rd Winchester, CA | 4.0 | 2.5 | 1775 | $3,395 | $1.91 | 0d | 1 | 0.62mi |
| 30826 Grand Prix Ct Winchester, CA | 3.0 | 2.5 | 1375 | $2,850 | $2.07 | 26d | 1 | 0.62mi |
| 29502 Marx Way Menifee, CA | 3.0 | 2.5 | 1469 | $3,150 | $2.14 | 0d | 1 | 0.64mi |
| 30812 Malibu Dr Winchester, CA | 3.0 | 2.5 | 1375 | $2,995 | $2.18 | 26d | 1 | 0.65mi |
| 30547 Operetta St Winchester, CA | 3.0 | 2.5 | 1567 | $3,100 | $1.98 | 20d | 1 | 0.65mi |
| 29505 Bovenzi Way Winchester, CA | 4.0 | 2.0 | 1754 | $3,100 | $1.77 | 16d | 1 | 0.76mi |
| 29587 Winterstorm Ct Winchester, CA | 3.0 | 2.5 | 2054 | $3,195 | $1.56 | 13d | 1 | 0.81mi |
| 29429 Cumaru Ct Winchester, CA | 4.0 | 2.5 | 1699 | $3,349 | $1.97 | 0d | 1 | 0.82mi |
| 29424 Cumaru Ct Winchester, CA | 4.0 | 2.5 | 1771 | $3,459 | $1.95 | 22d | 1 | 0.83mi |
| 29430 Cumaru Ct Winchester, CA | 4.0 | 2.5 | 1699 | $3,379 | $1.99 | 0d | 1 | 0.84mi |
| 29471 Granadillo Ct Winchester, CA | 4.0 | 2.5 | 1699 | $3,349 | $1.97 | 22d | 1 | 0.85mi |
| 29449 White Ash Ct Winchester, CA | 3.0 | 2.5 | 1532 | $3,379 | $2.21 | 16d | 1 | 0.85mi |
| 29472 Granadillo Ct Winchester, CA | 4.0 | 2.5 | 1699 | $3,349 | $1.97 | 22d | 1 | 0.86mi |
| 29467 Monterey Pine Ct Winchester, CA | 4.0 | 2.5 | 1771 | $3,429 | $1.94 | 22d | 1 | 0.87mi |
| 29474 Monterey Pine Ct Winchester, CA | 4.0 | 2.5 | 1699 | $3,349 | $1.97 | 9d | 1 | 0.89mi |
| 29475 Jack Pine Ct Winchester, CA | 4.0 | 2.5 | 1699 | $3,269 | $1.92 | 45d | 1 | 0.90mi |
| 29790 Cottonwood Cove Dr Menifee, CA | 3.0 | 2.0 | 1979 | $2,950 | $1.49 | 0d | 1 | 1.09mi |
| 29555 Copper Hill Ct Winchester, CA | 4.0 | 2.5 | 1823 | $3,195 | $1.75 | 3d | 1 | 1.30mi |
| 29406 Grande Vista Ave Menifee, CA | 4.0 | 3.0 | 2152 | $3,350 | $1.56 | 4d | 1 | 1.41mi |
| 32202 Prairie Crossing Dr Winchester, CA | 3.0 | 2.0 | 1948 | $2,950 | $1.51 | 0d | 1 | 1.41mi |
HOA detail condo
- Monthly dues
- $397 · $4,764/yr
- Likely covers
- pool
- Assessments
- None detected in remarks — confirm with the listing agent.
Listing history 19 events
-
2026-06-21pricedays on market $475,729 Active 46 DOM
-
2026-06-18days on market $473,729 Active 43 DOM
-
2026-06-17days on market $473,729 Active 42 DOM
-
2026-06-16days on market $473,729 Active 41 DOM
-
2026-06-15days on market $473,729 Active 40 DOM
-
2026-06-13pricedays on market $473,729 Active 38 DOM
-
2026-06-09days on market $453,990 Active 34 DOM
-
2026-06-08days on market $453,990 Active 33 DOM
-
2026-06-07pricedays on market $453,990 Active 32 DOM
-
2026-06-04days on market $449,990 Active 29 DOM
-
2026-06-03days on market $449,990 Active 28 DOM
-
2026-06-02days on market $449,990 Active 27 DOM
-
2026-06-01days on market $449,990 Active 26 DOM
-
2026-05-31days on market $449,990 Active 25 DOM
-
2026-05-06historical
-
2026-05-06$449,990 Active 804-char remark
-
2026-05-02price $449,990
-
2026-04-25price $459,990
-
2026-04-15$454,990 Active
ⓘ Source: listings_history table (triggers on properties + properties_extension) + one-shot
backfill from property_details.listing_events for pre-trigger history.
Climate risk First Street
- Flood 1/10 Low FEMA zone X (unshaded) · 0% chance over 30 yrs
- Wildfire 7/10 Severe
- Heat 8/10 Severe 7 d/yr ≥105°F today · 21 d/yr by 30 yrs out
- Wind 1/10 Low
- Air quality 6/10 Major 10 unhealthy d/yr today · 14 by 30 yrs out
Nearby sold comps map
Loading sold comps map…
Walkable amenities ~0.75 mi
Loading nearby amenities…
Taxation est. · year 1
- Rental income
- $41,681
- − Mortgage interest
- −$30,142
- − Property taxes
- −$8,072
- − Insurance
- −$2,691
- − Repairs & maintenance
- −$3,334
- − Management
- −$3,334
- − HOA
- −$4,764
- − Depreciation
- −$15,654
- Taxable loss
- −$26,311
- Est. tax savings @ 24.0%
- +$6,315
- After-tax cash flow
- $-10,147/yr
For passive investors: Depreciation is non-cash, so a rental often shows a tax loss while cash-flowing — sheltering income. Rental losses are passive: they offset passive income freely, and up to $25,000/yr can offset ordinary (W-2) income if you actively participate and your MAGI is under $100k (phasing out to $0 by $150k); unused losses carry forward. On sale, claimed depreciation is recaptured at up to 25%, and gains may owe capital-gains tax (a 1031 exchange can defer both). Figures are a year-1 estimate at your 24.0% rate — not tax advice; consult a CPA.
Schools (NCES district)
- District
- Hemet Unified
- NCES district ID
- 0616920
- Math proficiency
- 19% ▼ -3.00%
- Reading proficiency
- 41% ▲ 4.00%
- Median HH income
- $39,962
- Composite
- 25.16/100
- National rank
- #7517
- State rank
- #360 of 517 in CA
Livability — Winchester
- Score
- 52/100
- State rank
- #992
- US rank
- #24750
Category grades
Schools grade is shown separately in the Schools card above.
Census & demographics
- County
- Riverside County · 2,287,001 people
- Metro
- Riverside-San Bernardino-Ontario, CA
- Population (ZIP)
- 38,981
- Household income
- $132,538
- Rent vs Own
- Severe rent burden
- 591.0
Population outlook (Riverside County) Hauer SSP2
- Today (2025)
- 2,664,475 people
- By 2030
- 2,802,692 · +5.2%
- By 2040
- 3,050,904 · +14.5%
- By 2050
- 3,256,783 · +22.2%
- By 2075
- 3,655,058 · +37.2%
- By 2100
- 3,766,594 · +41.4%
Race, ethnicity, and origin ACS 2023
- Neighborhood character
- Highly diverse neighborhood (Simpson 0.72)
- Race & ethnicity
- White 38% Hispanic / Latino 34% Two or more races 16% Asian 12% Black 6% Pacific Islander 2%
- Hispanic origin (detail)
- Mexican 29%
- Common ancestry
- Slovak 3% Italian 2% Portuguese 1%
- Foreign-born
- 14% · Canada, Vietnam
- Languages at home
- 76% English-only · Spanish 16% Tagalog/Filipino 4% Vietnamese 1%
Political lean MEDSL · Riverside
- 2024 margin
- Toss-up / Even · D 48.0% · R 49.3% · Other 2.6%
- 2008→2024 swing
- -3.6pp toward R · 2008: 2.3pp · 2024: -1.3pp
- All cycles
- 2024: R+1.3 2020: D+8.0 2016: D+4.3 2012: R+0.4 2008: D+2.3
Not yet ingested
- Civics
- —
Market trends
- HPI YoY
- ▲ 12.43%
- Current HPI
- 332.169
- Rent YoY
- ▼ -0.79%
- Metro
- Riverside-San Bernardino-Ontario, CA
- State GDP YoY
- ▲ 3.21%
- F500 in state
- 116
Industry mix (Fortune 500 HQ in CA)
| Industry | F500 HQs | Revenue |
|---|---|---|
| Technology | 27 | $1,492B |
|
||
| Financial Services | 3 | $174B |
|
||
| Retail | 3 | $44B |
|
||
| Insurance | 3 | $26B |
|
||
| Media / Entertainment | 2 | $115B |
|
||
| Pharmaceuticals / Biotech | 2 | $62B |
|
||
Price history
+4.1% since first listed7 events — show timeline
- 2026-06-13 Price Changed $473,729 CRMLS
- 2026-06-06 Price Changed $453,990 CRMLS
- 2026-05-06 Listing Removed — CRMLS
- 2026-05-06 Listed $449,990 CRMLS
- 2026-05-02 Price Changed $449,990 CRMLS
- 2026-04-25 Price Changed $459,990 CRMLS
- 2026-04-15 Listed $454,990 CRMLS
Cash-flow waterfall
monthlySold comps — $/sqft
last 12 mo · ≤1 miLoading sold comps…