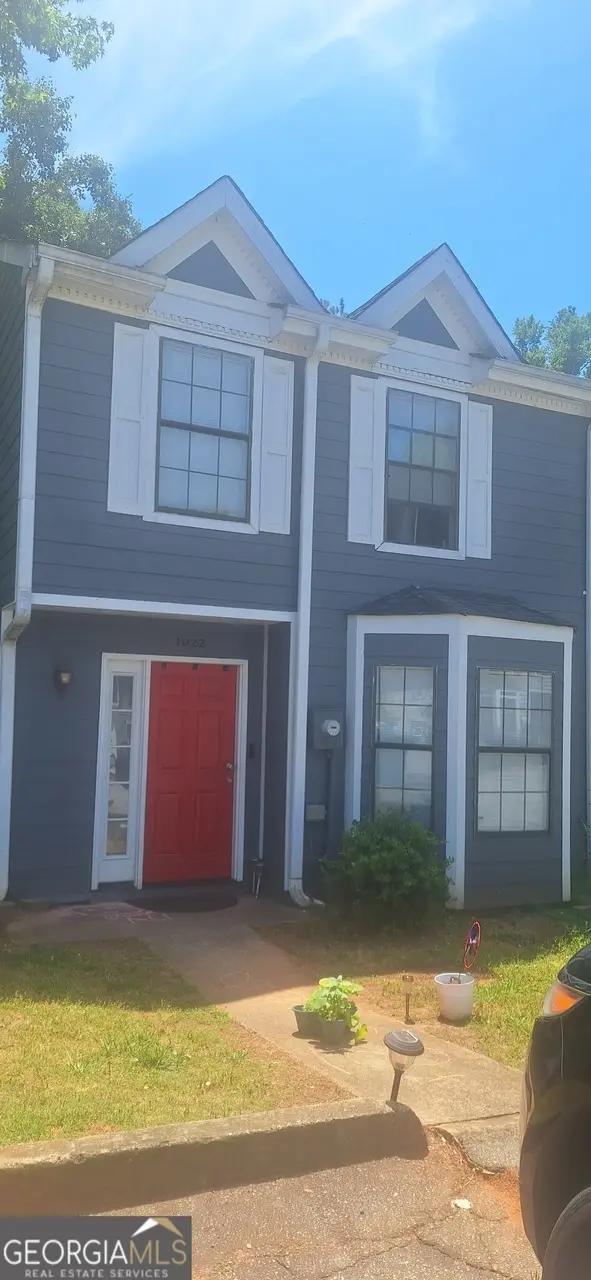
1022 Thornwoode Ln · Stone Mountain, GA
Flood risk 1/10 · Minimal
- FEMA flood zone
- X (unshaded)
- Chance of flooding over 30 yrs
- 0.0%
- Est. flood insurance / yr
- $507 – $1,088
Fire risk 1/10 · Minimal
- Est. fire insurance / yr
- $963 – $1,789
Heat risk 6/10 · Moderate
- Hot days now (above 104°F)
- 7 days/yr
- Hot days in 30 yrs
- 19 days/yr
Wind risk 5/10 · Moderate
- Chance of severe wind over 30 yrs
- 23.0%
Air-quality risk 6/10 · Moderate
- Unhealthy air days now
- 8 days/yr
- Unhealthy air days in 30 yrs
- 11 days/yr
Risk factors via First Street. Map © Google.
Why this score? — see what drove the C- grade
The composite is a weighted blend of 9 inputs, each scored 0–100. Each bar is that input's sub-score; the figure is the points it added to the 100-point composite (weight × sub-score).
- Cash flow +15.9/30.0
- ARV discount +14.8/15.0
- 1% rule +5.4/10.0
- DSCR +4.9/10.0
- Livability +4.0/5.0
- Rent growth +2.8/5.0
- Condition / age +2.5/5.0
- Schools +2.1/10.0
- Appreciation +0.0/10.0
$140,000
🖨 Deal sheet 📄 Offer letter ✓ Due diligence
Listing remarks MLS
Great Townhome. End Unit, Need some minor TLC and it will be ready to move in.
Key facts
- Built 1984
- Listed 28 days
Property features AI
Finance
- Other: Lot about 0.07 acres
- Financial info: Investor owned
- HOA & community: Has an association (includes grounds maintenance)
Exterior
- Parking: Parking pad with open parking
- Utilities: Public water; Public sewer; Electricity available on property
- Home design: Residential townhouse; House structure; Two levels; Resale property
- Construction: Built in 1984
- Exterior features: Composition roof; Aluminum siding; No notable lot features
Interior
- Kitchen: Other appliances
- Bedrooms: 2 bedrooms
- Flooring: Laminate flooring
- Bathrooms: 2 full bathrooms and 1 half bathroom (3 total)
- Heating & cooling: Heat pump for heating and cooling
- Interior features: Fireplace (1); Other interior features
- Laundry & utility: Laundry located in the kitchen
Neighborhood map
What this means for you Summary
Snapshot
- This is a 2-bed/2.5-bath townhouse listed at $140k.
Deal economics
- At list price, monthly cash flow is $68 ($810/yr) — positive.
- The deal already cash-flows at list — no discount required.
- Meets the 1% rule at list price ($1k rent vs $140k).
- Recommended offer: $138k (1.5% below list) — sets the bar for market timing.
- Cap rate 6.9% vs local median 5.1% in Stone Mountain — top-decile yield for the area; either an underpriced asset or a hidden risk that comps aren't pricing in. Stress-test before assuming the spread holds.
Location & tenants
- Location reads 79/100 on livability (#11 in GA, #1,977 nationally) — a middle-class / working-renter tenant base. Strengths: commute A+, cost of living A+, housing A+; Watch: employment D+, crime F.
- Dekalb County (suburban): math 19% / reading 28% proficiency, ranked #125 of 174 in GA (top 72%) — low school quality limits family demand, transient renter base, plan for 1-2y turnover; 68% free/reduced lunch — lower-income household profile, screen leases tightly.
- Zoned schools: Stone Mill Elementary School (math 2% / reading 17%, grade F, #1,092 of 1,228 statewide, top 91%, 592 students, 100% FRL); Stone Mountain Middle School (math 12% / reading 15%, grade F, #407 of 470 statewide, top 87%, 1,072 students, 100% FRL); Stone Mountain High School (math 8% / reading 12%, grade F, #365 of 424 statewide, top 88%, 1,202 students, 100% FRL) — zoned schools average 100% FRL vs 68% district-wide (32 pts higher); higher-poverty schools than district average — tighter screening recommended.
- Zoned-school proficiency averages 11% at this address vs 24% district-wide (-12 pts) — the specific schools serving this property underperform the Dekalb County average; the district grade overstates school quality for this exact location.
- Market conditions: Rents rising (+1.3%/yr); 257 active listings in the ZIP; 40 comparable units currently listed for rent nearby; rentals at typical pace (median 15d on market — plan ~3-4 weeks tenant-placement turnaround); 1,240 units permitted in DeKalb County in 2024 (385 in 5+ unit buildings).
Forward outlook
- Local home prices are declining (-3.0%/yr); year-one equity from $968 of loan paydown is wiped out by about $4k of value loss. Plan a longer hold.
- DeKalb County population projected at +28% by 2050 — long-run rental-demand tailwind backs the buy-and-hold thesis.
Negotiation context
- It's been on market 29 days — a 2% lower offer ($138k) is reasonable based on typical stale-listing flexibility.
- 6 sale attempts since 12y ago with the ask held roughly flat each time — persistent listings suggest the price (not the market) is what's stuck; bring a comps-based counter.
- Current owner paid $35k; list at $140k implies a 300% gain — meaningful room to come down on a strong offer.
Risks & watch-outs
- Watch-outs: property tax is 2.5% of price.
- Climate carrying-cost: moderate wind risk, 23% chance of damaging wind over 30y; extreme-heat days projected 7→19/yr by 2055 (HVAC capex compounding) — expect insurance premiums to compound above CPI over the hold.
Questions for the listing agent
- Property tax is high relative to price — has the assessment been appealed recently, and will the sale trigger a re-assessment?
- Is there a deadline driving the sale (1031 exchange, divorce, estate, relocation)? That informs how much negotiation room exists.
- Schools are F-rated, which usually means shorter tenancies and higher turnover. Who's the typical renter profile here, and what's been the actual vacancy rate?
- Crime grade is F in this area — have there been break-ins, vandalism, or insurance claims at this property in the last 3 years? What carrier currently insures it and at what premium?
- What's the average days-on-market for RENTAL listings here right now (not sales)? A rising rental-DOM trend means longer vacancies and softer asking-rent achievability than the comps imply.
- What's the recent tenant-quality profile in this submarket — average credit score on applications, eviction rate, late-payment / NSF rate, and stable-employment percentage? A property-management company in the area should have these aggregated.
- How much new for-sale + rental construction is in the pipeline within 1–3 miles? Heavy new supply typically softens prices + rents 12–24 months out; constrained supply supports both.
Investment metrics
- 1% rule
- 1.04% ✓
- Cap rate
- 6.87%
- Cash-on-cash
- 2.07%
- DSCR
- 1.09
- GRM
- 8.0
CMA / ARV
- ARV (median comp)
- $167,048
- List price
- $140,000
- Delta
- -16.19%
- Verdict
- UNDERPRICED
- Comps
- 20 within 1.0 mi
Show comp detail 12 sales within ~0.75 mi
| Address | Dist | Beds/Ba | Sqft | Sold | Price | $/sf | Match |
|---|---|---|---|---|---|---|---|
| 1023 Thornwoode Ln | 0.02mi | 2/2.5 | 1,184 (-1%) | 14mo | $98,500 | $83 | 85 |
| 1055 Lancashire Cir Unit A 2 | 0.10mi | 2/2.0 | 1,124 (-6%) | 14mo | $265,000 | $236 | 72 |
| 1055 Lancashire Cir Unit A 1 | 0.10mi | 2/2.0 | 1,124 (-6%) | 14mo | $265,000 | $236 | 72 |
| 1055 Lancashire Cir Unit B 8 | 0.10mi | 2/2.0 | 1,124 (-6%) | 14mo | $265,000 | $236 | 72 |
| 1001 Park Gate Pl | 0.38mi | 2/2.5 | 1,280 (+7%) | 5mo | $195,000 | $152 | 66 |
| 4707 Mariners Way | 0.26mi | 2/1.0 | 1,328 (+11%) | 5mo | $60,000 | $45 | 60 |
| 1070 Thornwoode Ln #1070 | 0.06mi | 3/2.5 (+1) | 1,320 (+10%) | 19mo | $121,000 | $92 | 59 |
| 1014 Park Gate Pl | 0.35mi | 2/2.5 | 1,280 (+7%) | 19mo | $235,000 | $184 | 56 |
| 1054 Park Gate Pl | 0.35mi | 2/2.5 | 1,280 (+7%) | 21mo | $225,000 | $176 | 54 |
| 979 Park Gate Pl | 0.39mi | 2/2.5 | 1,280 (+7%) | 24mo | $192,500 | $150 | 50 |
| 4712 Rockstile Way | 0.33mi | 2/2.0 | 1,032 (-14%) | 12mo | $216,000 | $209 | 50 |
| 1097 Old Saybrook Ct | 0.52mi | 2/1.0 | 1,033 (-14%) | 5mo | $140,000 | $136 | 43 |
Match score weights: distance 35% · size 25% · config 20% · recency 20%. Top-matched comps best support the ARV.
Projected returns pro-forma
-3.0% appreciation · 1.31% rent growth · sell at horizon
- IRR
- -15.1%
- Equity multiple
- 0.47×
- Total profit
- $-20,734
- Equity at exit
- $20,874
- IRR
- -9.9%
- Equity multiple
- 0.44×
- Total profit
- $-21,826
- Equity at exit
- $12,105
Cash invested: $39,200 (down + closing). Projections, not guarantees.
Landlord ↔ Tenant lean methodology
- Overall (STATE)
- 90 Strongly Landlord-Friendly
- State Georgia
- 90 Strongly Landlord-Friendly · R+3
- County
- — inherits STATE
- City
- — inherits STATE
ZIP-level market 30083
- Rents YoY
- 1.3%
- Active inventory
- 257
- Price-to-rent
- 8.0×
Monthly cashflow live
- Estimated rent
- $1,462 high interval (Pro) →
- Mortgage (P&I)
- −$734
- Tax from tax record
- −$295 /mo · $3,542/yr
- Insurance
- −$58
- HOA
- −$0
- Vacancy / Maint / Mgmt
- −$307
- Net cashflow
- $68
Break-even live
UW: 25.0% down · 7.5% · 30yr · 1.5% tax · 5.0% vac · 8.0% maint · 8.0% mgmt
Financing live
Cash to close
- Down payment
- $35,000
- Closing costs
- $4,200
- Reserves months
- —
- Total cash needed
- —
Loan-product check · same deal, 3 products live
Conventional
25% down · 7.5% · 30yr
- Down + closing
- —
- Monthly P&I
- —
- Monthly cashflow
- —
- DSCR
- —
- Eligible?
- —
Personal DTI + credit; lowest rate.
DSCR
20% down · 8.5% · 30yr
- Down + closing
- —
- Monthly P&I
- —
- Monthly cashflow
- —
- DSCR
- —
- Eligible?
- —
No personal income docs; deal must DSCR.
Hard money
10% down · 12.0% · 12mo
- Down + closing
- —
- Monthly P&I
- —
- Monthly cashflow
- —
- DSCR
- —
- Eligible?
- —
Short-term bridge; refi at stabilization.
Rent comps 40 comps
| Address | Beds | Baths | Sqft | Rent | $/sqft | DOM | Units | Dist |
|---|---|---|---|---|---|---|---|---|
| 1073 Thornwoode Ln Stone Mountain, GA | 3.0 | 2.5 | 1235 | $697 | $0.56 | 22d | 1 | 0.14mi |
| 1075 N Hairston Rd Stone Mountain, GA | 1.0–3.0 | 1.0–2.0 | 992 | $1,348 | $1.36 | 5d | 12 | 0.15mi |
| 1059 Mariners Dr Stone Mountain, GA | 2.0 | 1.5 | 1328 | $1,600 | $1.20 | 43d | 1 | 0.31mi |
| 4958 Central Dr Apt D Stone Mountain, GA | 2.0 | 1.0 | 900 | $995 | $1.11 | 22d | 1 | 0.39mi |
| 4900 Central Dr Stone Mountain, GA | 1.0–3.0 | 1.0–2.0 | 1100 | $1,388 | $1.26 | 1d | 15 | 0.39mi |
| 5030 W Mountain St Stone Mountain, GA | 2.0 | 1.0 | 1175 | $1,199 | $1.02 | 43d | 1 | 0.41mi |
| 1173 N Hairston Rd Stone Mountain, GA | 2.0 | 1.0–2.0 | 1161 | $1,426 | $1.23 | 1d | 30 | 0.41mi |
| 6097 Memorial Dr Stone Mountain, GA | 2.0–3.0 | 1.0–2.0 | 1123 | $1,341 | $1.19 | 3d | 9 | 0.45mi |
| 5100 W Mountain St Stone Mountain, GA | 1.0–3.0 | 1.0–2.0 | 1150 | $1,252 | $1.09 | 3d | 11 | 0.49mi |
| 4923 Sheila Ln Stone Mountain, GA | 3.0 | 2.0 | 1266 | $1,200 | $0.95 | 43d | 1 | 0.51mi |
| 1 Chatfield Dr Stone Mountain, GA | 1.0–3.0 | 1.0–2.5 | 1060 | $1,282 | $1.21 | 2d | 20 | 0.52mi |
| 967 Pine Roc Dr Stone Mountain, GA | 3.0 | 2.0 | 1206 | $1,900 | $1.58 | 10d | 1 | 0.56mi |
| 1259 Old Countryside Cir Stone Mountain, GA | 3.0 | 2.0 | 1309 | $1,795 | $1.37 | 43d | 1 | 0.57mi |
| 1311 Old Countryside Cir Stone Mountain, GA | 3.0 | 2.5 | 1381 | $2,101 | $1.52 | 5d | 1 | 0.62mi |
| 5025 Brittany Dr Stone Mountain, GA | 3.0 | 2.5 | 1484 | $1,845 | $1.24 | 12d | 1 | 0.64mi |
| 1305 Old Countryside Cir W Stone Mountain, GA | 3.0 | 2.0 | 1132 | $1,719 | $1.52 | 16d | 1 | 0.70mi |
| 1010 Sexton Dr Stone Mountain, GA | 2.0 | 2.0 | 1000 | $1,250 | $1.25 | 12d | 1 | 0.73mi |
| 1700 Weatherly Dr Stone Mountain, GA | 1.0–2.0 | 1.0–2.0 | 769 | $1,215 | $1.58 | 5d | 1 | 0.80mi |
| 1310 Wood Bend Dr Stone Mountain, GA | 1.0–2.0 | 1.0–2.0 | 909 | $1,500 | $1.65 | 1d | 78 | 0.87mi |
| 2700 Summit Creek Dr Stone Mountain, GA | 2.0 | 1.0–2.0 | 926 | $1,279 | $1.38 | 2d | 34 | 0.87mi |
| 205 Summit Lake Dr Stone Mountain, GA | 2.0 | 2.0 | 1175 | $1,559 | $1.33 | 12d | 1 | 0.93mi |
| 205 Summit Lake Dr Stone Mountain, GA | 1.0 | 2.0 | 1004 | $1,377 | $1.37 | 24d | 1 | 0.93mi |
| 205 Summit Lake Dr Stone Mountain, GA | 2.0 | 2.0 | 1155 | $1,634 | $1.41 | 43d | 1 | 0.93mi |
| 200 Summit Lake Dr Stone Mountain, GA | 2.0 | 2.0 | 1175 | $1,389 | $1.18 | 12d | 1 | 0.95mi |
| 200 Summit Lake Dr Stone Mountain, GA | 1.0 | 1.0 | 880 | $1,188 | $1.35 | 4d | 1 | 0.95mi |
| 200 Summit Lake Dr Stone Mountain, GA | 3.0 | 2.0 | 1486 | $1,809 | $1.22 | 22d | 1 | 0.95mi |
| 200 Summit Lake Dr Stone Mountain, GA | 1.0 | 1.0 | 1004 | $1,184 | $1.18 | 15d | 1 | 0.95mi |
| 1047 Ridge Ave Stone Mountain, GA | 3.0 | 1.0 | 1402 | $2,150 | $1.53 | 24d | 1 | 1.03mi |
| 1900 Tree Mountain Pkwy Stone Mountain, GA | 1.0–2.0 | 1.0–2.5 | 1118 | $1,200 | $1.07 | 1d | 25 | 1.07mi |
| 827 San Miguel Dr Stone Mountain, GA | 3.0 | 2.0 | 1272 | $1,550 | $1.22 | 16d | 1 | 1.17mi |
| 1313 Stone Mill Way Stone Mountain, GA | 1.0–4.0 | 1.0–2.5 | 1004 | $1,392 | $1.39 | 15d | 12 | 1.22mi |
| 1509 Kilmuir Way Stone Mountain, GA | 2.0 | 2.5 | 1160 | $1,550 | $1.34 | 43d | 1 | 1.28mi |
| 1150 Rankin St Stone Mountain, GA | 2.0 | 2.5 | 1495 | $1,850 | $1.24 | 24d | 1 | 1.34mi |
| 1150 Rankin St Stone Mountain, GA | 2.0–3.0 | 2.5 | 1437 | $1,600 | $1.11 | 43d | 2 | 1.35mi |
| 5280 Ridge Forest Dr Stone Mountain, GA | 2.0 | 2.5 | 1170 | $1,325 | $1.13 | 43d | 1 | 1.40mi |
| 768 Fourth St Stone Mountain, GA | 3.0 | 2.0 | 1200 | $2,100 | $1.75 | 5d | 1 | 1.42mi |
| 621 Windchase Ln Stone Mountain, GA | 2.0 | 2.0 | 912 | $1,200 | $1.32 | 43d | 1 | 1.47mi |
| 5351 Ridgemere Ct Stone Mountain, GA | 3.0 | 2.5 | 1160 | $1,465 | $1.26 | 5d | 1 | 1.47mi |
| 5353 Ridgemere Ct Stone Mountain, GA | 3.0 | 2.5 | 1160 | $1,465 | $1.26 | 5d | 1 | 1.47mi |
| 5290 Stonebush Ter Unit A Stone Mountain, GA | 2.0 | 2.5 | 1200 | $1,450 | $1.21 | 18d | 1 | 1.49mi |
Listing history 32 events
-
2026-06-18days on market $140,000 Active 29 DOM
-
2026-06-17days on market $140,000 Active 28 DOM
-
2026-06-16days on market $140,000 Active 27 DOM
-
2026-06-15days on market $140,000 Active 26 DOM
-
2026-06-13days on market $140,000 Active 24 DOM
-
2026-06-09days on market $140,000 Active 20 DOM
-
2026-06-08days on market $140,000 Active 19 DOM
-
2026-06-07days on market $140,000 Active 18 DOM
-
2026-06-04statusdays on market $140,000 Active 15 DOM
-
2026-06-03days on market $140,000 New 14 DOM
-
2026-06-02days on market $140,000 New 13 DOM
-
2026-06-01days on market $140,000 New 12 DOM
-
2026-05-31days on market $140,000 New 11 DOM
-
2026-04-28historical $140,000 66-char remark
-
2023-09-26historical $1,275
-
2023-08-31price $1,275
-
2023-08-24$1,300
-
2023-08-11historical
-
2017-11-08historical
-
2017-11-07status Back on Market
-
2017-10-16status Under Contract
-
2017-08-26$60,000 New
-
2015-03-20soldstatus $35,000 Sold
Show marketing remark (78 chars)
Great Townhome. End Unit, Need some minor TLC and it will be ready to move in.
-
2015-03-10status Under Contract
Show marketing remark (78 chars)
Great Townhome. End Unit, Need some minor TLC and it will be ready to move in.
-
2015-03-06$35,000 New
Show marketing remark (78 chars)
Great Townhome. End Unit, Need some minor TLC and it will be ready to move in.
-
2015-01-23historical
-
2014-12-03price $35,000
-
2014-10-23$37,000 New
-
2005-09-06soldstatus $76,000
-
1999-12-13soldstatus $67,000
-
1994-05-23soldstatus $34,500
-
1991-08-01soldstatus $35,000
ⓘ Source: listings_history table (triggers on properties + properties_extension) + one-shot
backfill from property_details.listing_events for pre-trigger history.
Tax reassessment forecast GA · Resets to sale price
- Current annual tax
- $3,542 · $295/mo
- Projected year-2 tax
- $3,542 · $295/mo
- Expected delta
- $0/yr ($0/mo · 0.0%)
ⓘ Screening estimate from a state-policy table — verify with the county assessor before closing.
Climate risk First Street
- Flood 1/10 Low FEMA zone X (unshaded) · 0% chance over 30 yrs
- Wildfire 1/10 Low
- Heat 6/10 Major 7 d/yr ≥104°F today · 19 d/yr by 30 yrs out
- Wind 5/10 Major 23% chance of damaging wind over 30 yrs
- Air quality 6/10 Major 8 unhealthy d/yr today · 11 by 30 yrs out
Nearby sold comps map
Loading sold comps map…
Walkable amenities ~0.75 mi
Loading nearby amenities…
Taxation est. · year 1
- Rental income
- $17,548
- − Mortgage interest
- −$7,842
- − Property taxes
- −$3,542
- − Insurance
- −$700
- − Repairs & maintenance
- −$1,404
- − Management
- −$1,404
- − Depreciation
- −$4,073
- Taxable loss
- −$1,417
- Est. tax savings @ 24.0%
- +$340
- After-tax cash flow
- $1,150/yr
For passive investors: Depreciation is non-cash, so a rental often shows a tax loss while cash-flowing — sheltering income. Rental losses are passive: they offset passive income freely, and up to $25,000/yr can offset ordinary (W-2) income if you actively participate and your MAGI is under $100k (phasing out to $0 by $150k); unused losses carry forward. On sale, claimed depreciation is recaptured at up to 25%, and gains may owe capital-gains tax (a 1031 exchange can defer both). Figures are a year-1 estimate at your 24.0% rate — not tax advice; consult a CPA.
Schools (NCES district)
- District
- Dekalb County
- NCES district ID
- 1301740
- Math proficiency
- 19% ▼ -12.00%
- Reading proficiency
- 28% ▼ -7.00%
- Median HH income
- $51,448
- Composite
- 20.92/100
- National rank
- #8482
- State rank
- #125 of 174 in GA
Livability — Stone Mountain
- Score
- 79/100
- State rank
- #11
- US rank
- #1977
Category grades
Schools grade is shown separately in the Schools card above.
Census & demographics
- County
- Dekalb County · 782,738 people
- City population
- 130,941
- Metro
- Atlanta-Sandy Springs-Alpharetta, GA
- Population (ZIP)
- 62,724
- Household income
- $55,307
- Rent vs Own
- Severe rent burden
- 3574.0
Population outlook (DeKalb County) Hauer SSP2
- Today (2025)
- 839,977 people
- By 2030
- 891,768 · +6.2%
- By 2040
- 988,894 · +17.7%
- By 2050
- 1,074,583 · +27.9%
- By 2075
- 1,245,026 · +48.2%
- By 2100
- 1,303,135 · +55.1%
Race, ethnicity, and origin ACS 2023
- Neighborhood character
- Predominantly Black (75%)
- Race & ethnicity
- Black 75% White 8% Asian 8% Hispanic / Latino 5% Two or more races 5%
- Common ancestry
- Arab 1%
- Foreign-born
- 24% · Canada, Vietnam, India
- Languages at home
- 71% English-only · Spanish 4% Other Indo-European 4% Vietnamese 2%
Political lean MEDSL · DeKalb
- 2024 margin
- Solid D (+64.8) · D 81.9% · R 17.1% · Other 1.0%
- 2008→2024 swing
- +6.1pp toward D · 2008: 58.6pp · 2024: 64.8pp
- All cycles
- 2024: D+64.8 2020: D+67.4 2016: D+64.8 2012: D+56.8 2008: D+58.6
Not yet ingested
- Civics
- —
Market trends
- HPI YoY
- ▼ -213.61%
- Current HPI
- 216.2527
- Rent YoY
- ▲ 1.31%
- Metro
- Atlanta-Sandy Springs-Alpharetta, GA
- State GDP YoY
- ▲ 2.66%
- F500 in state
- 28
Industry mix (Fortune 500 HQ in GA)
| Industry | F500 HQs | Revenue |
|---|---|---|
| Paper / Packaging | 2 | $29B |
|
||
| Retail | 1 | $160B |
|
||
| Transportation / Logistics | 1 | $91B |
|
||
| Airlines | 1 | $62B |
|
||
| Consumer Goods | 1 | $47B |
|
||
| Utilities | 1 | $25B |
|
||
Price history
+300.0% since first listed20 events — show timeline
- 2026-05-21 Listed $140,000 GAMLS
- 2026-04-28 Coming Soon $140,000 GAMLS
- 2023-09-26 Rental Removed $1,275 APPFOLIO
- 2023-08-31 Price Changed $1,275 APPFOLIO
- 2023-08-24 Listed for Rent $1,300 APPFOLIO
- 2023-08-11 Rental Removed — APPFOLIO
- 2017-11-08 Listing Removed — GAMLS
- 2017-11-07 Relisted — GAMLS
- 2017-10-16 Pending — GAMLS
- 2017-08-26 Listed $60,000 GAMLS
- 2015-03-20 Sold (MLS) $35,000 GAMLS
- 2015-03-10 Pending — GAMLS
- 2015-03-06 Listed $35,000 GAMLS
- 2015-01-23 Listing Removed — GAMLS
- 2014-12-03 Price Changed $35,000 GAMLS
- 2014-10-23 Listed $37,000 GAMLS
- 2005-09-06 Sold (Public Records) $76,000 Public Records
- 1999-12-13 Sold (Public Records) $67,000 Public Records
- 1994-05-23 Sold (Public Records) $34,500 Public Records
- 1991-08-01 Sold (Public Records) $35,000 Public Records
Property tax history
+4.2%/yrLatest (2025): $3,542 · +0.0% YoY. Source: county tax records.
Cash-flow waterfall
monthlySold comps — $/sqft
last 12 mo · ≤1 miLoading sold comps…