 🔨 Auction
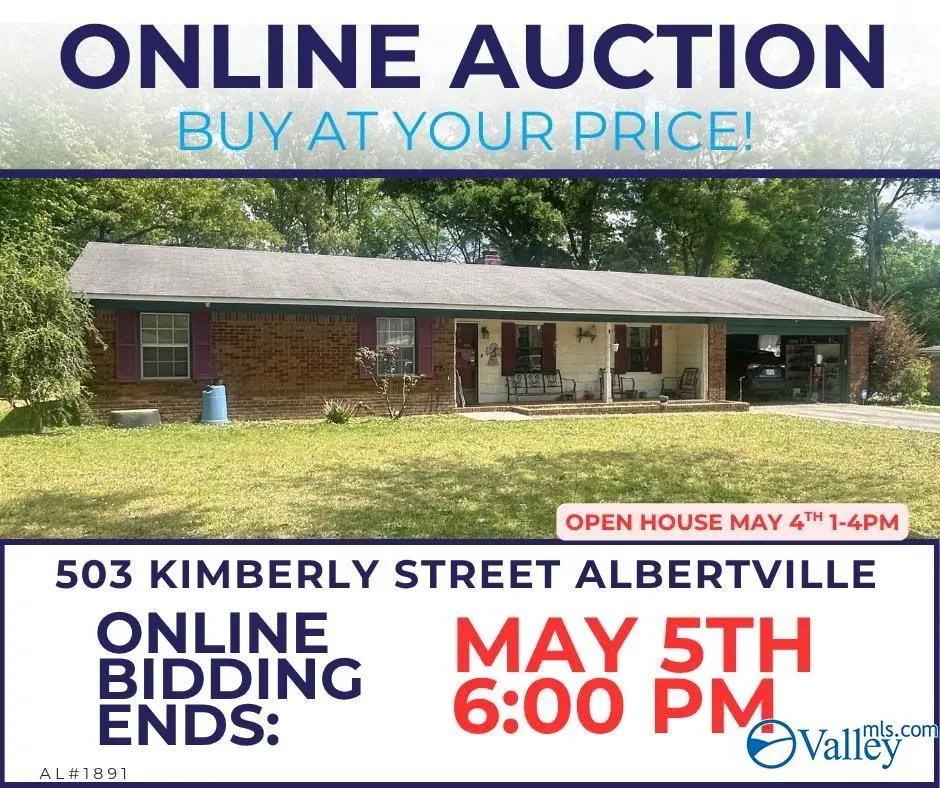
503 Kimberly St · Albertville, AL
Flood risk 1/10 · Minimal
- FEMA flood zone
- X (unshaded)
- Chance of flooding over 30 yrs
- 0.0%
- Est. flood insurance / yr
- $507 – $1,088
Fire risk 3/10 · Minor
- Est. fire insurance / yr
- $916 – $1,700
Heat risk 5/10 · Moderate
- Hot days now (above 104°F)
- 7 days/yr
- Hot days in 30 yrs
- 20 days/yr
Wind risk 4/10 · Minor
- Chance of severe wind over 30 yrs
- 21.0%
Air-quality risk 2/10 · Minimal
- Unhealthy air days now
- 0 days/yr
- Unhealthy air days in 30 yrs
- 1 days/yr
Risk factors via First Street. Map © Google.
Why this score? — see what drove the F grade
The composite is a weighted blend of 9 inputs, each scored 0–100. Each bar is that input's sub-score; the figure is the points it added to the 100-point composite (weight × sub-score).
- ARV discount +7.5/15.0
- Cash flow +6.1/30.0
- Livability +3.2/5.0
- Rent growth +2.5/5.0
- Condition / age +2.5/5.0
- Schools +2.3/10.0
- 1% rule +1.4/10.0
- DSCR +0.4/10.0
- Appreciation +0.0/10.0
$1
🖨 Deal sheet (PDF) 📄 Offer letter ✓ Due diligence
Listing remarks
Bid and Buy at Your Price! 3Bed / 2Bath Home in Albertville - Online Auction Open House - Monday, May 4th 1-4PM
Key facts
- 1.41 acre lot
- Garage
- Built 1978
Property features AI
Finance
- Other: Directions: Take a right off of Rose Rd onto W. McKinney Ave, then right onto Kimberly St; property will be on the right
- HOA & community: No homeowners association; Subdivision: Parklane
Exterior
- Parking: Attached one-car garage
- Utilities: Public water; Public sewer
- Home design: Single-family residence; One-story; Built in 1978; Residential property
- Construction: Living area approximately 1,400 square feet; One fireplace
- Exterior features: Covered patio
Interior
- Bathrooms: 1 full bathroom; 1 three-quarter bathroom
- Heating & cooling: Central heating; Central cooling
- Interior features: Fireplace (1) with standard features; Crawl space basement
Neighborhood map
What this means for you Summary
Snapshot
- This is a 3-bed/2.0-bath single-family listed at $1.
Deal economics
- At list price, monthly cash flow is $-329 ($-4k/yr) — negative.
- The deal already cash-flows at list — no discount required.
- Meets the 1% rule at list price ($1k rent vs $1).
- Cap rate 4.0% vs local median 2.6% in Albertville — top-decile yield for the area; either an underpriced asset or a hidden risk that comps aren't pricing in. Stress-test before assuming the spread holds.
Location & tenants
- Location reads 65/100 on livability (#141 in AL) — a middle-class / working-renter tenant base. Strengths: cost of living A+, housing A+; Watch: amenities F, commute F, health & safety F.
- Albertville City (town): math 17% / reading 39% proficiency, ranked #79 of 129 in AL (top 61%) — low school quality limits family demand, transient renter base, plan for 1-2y turnover.
- Zoned schools: Albertville Primary School (944 students, 82% FRL); Albertville Middle School (math 11% / reading 42%, grade F, #150 of 257 statewide, top 60%, 890 students, 78% FRL); Albertville High School (math 19% / reading 22%, grade F, #159 of 305 statewide, top 53%, 1,712 students, 73% FRL) — zoned schools average 78% FRL vs 59% district-wide (19 pts higher); higher-poverty schools than district average — tighter screening recommended.
- Market conditions: 110 active listings in the ZIP; 3 comparable units currently listed for rent nearby; rentals at typical pace (median 15d on market — plan ~3-4 weeks tenant-placement turnaround); 163 units permitted in Marshall County in 2024 (0 in 5+ unit buildings).
Forward outlook
- Local home prices are declining (-3.0%/yr); year-one equity from $1k of loan paydown is wiped out by about $5k of value loss. Plan a longer hold.
Negotiation context
- Only 6 days on market — expect competitive offers; lowballing is unlikely to land.
Risks & watch-outs
- Watch-outs: property tax is 263158.5% of price.
- Climate carrying-cost: extreme-heat days projected 7→20/yr by 2055 (HVAC capex compounding) — expect insurance premiums to compound above CPI over the hold.
Questions for the listing agent
- What do current leases actually rent for vs. the listed asking? Can we see a recent rent roll and the last 12 months of T-12 income?
- Built in 1978 — when were the roof, HVAC, electrical panel, plumbing, and water heater last replaced?
- Property tax is high relative to price — has the assessment been appealed recently, and will the sale trigger a re-assessment?
- Is there a deadline driving the sale (1031 exchange, divorce, estate, relocation)? That informs how much negotiation room exists.
- Schools are D-rated, which usually means shorter tenancies and higher turnover. Who's the typical renter profile here, and what's been the actual vacancy rate?
- The area grade is low — what's the realistic commute time and amenity access for the typical tenant pool here? Any planned neighborhood developments (good or bad) we should know about?
- What's the average days-on-market for RENTAL listings here right now (not sales)? A rising rental-DOM trend means longer vacancies and softer asking-rent achievability than the comps imply.
- What's the recent tenant-quality profile in this submarket — average credit score on applications, eviction rate, late-payment / NSF rate, and stable-employment percentage? A property-management company in the area should have these aggregated.
- How much new for-sale + rental construction is in the pipeline within 1–3 miles? Heavy new supply typically softens prices + rents 12–24 months out; constrained supply supports both.
Investment metrics
- 1% rule
- 0.64% ✗
- Cap rate
- 4.04%
- Cash-on-cash
- -8.04%
- DSCR
- 0.64
- GRM
- 13.1
CMA / ARV
- ARV (median comp)
- $175,439
- List price
- $1
- Delta
- -100.00%
- Verdict
- UNDERPRICED
- Comps
- 20 within 1.0 mi
Show comp detail 12 sales within ~0.75 mi
| Address | Dist | Beds/Ba | Sqft | Sold | Price | $/sf | Match |
|---|---|---|---|---|---|---|---|
| 503 Kimberly St | 0.00mi | 3/2.0 | 1,400 (0%) | 0mo | $172,150 | $123 | 100 |
| 140 Ivy Park Cir | 0.31mi | 3/2.0 | 1,344 (-4%) | 10mo | $231,465 | $172 | 70 |
| 144 Ivy Park Cir | 0.31mi | 3/2.0 | 1,335 (-5%) | 10mo | $239,400 | $179 | 70 |
| 136 Ivy Park Cir | 0.31mi | 3/2.0 | 1,335 (-5%) | 10mo | $235,900 | $177 | 69 |
| 102 N Willow St | 0.21mi | 3/2.0 | 1,250 (-11%) | 5mo | $189,000 | $151 | 68 |
| 418 Briarwood Ave | 0.57mi | 3/2.0 | 1,437 (+3%) | 2mo | $230,000 | $160 | 67 |
| 813 Nelson Rd | 0.64mi | 3/2.0 | 1,450 (+4%) | 1mo | $240,000 | $166 | 63 |
| 142 Ivy Park Cir | 0.29mi | 2/2.0 (-1) | 1,507 (+8%) | 8mo | $224,900 | $149 | 62 |
| 614 Rose Rd | 0.35mi | 3/2.0 | 1,250 (-11%) | 8mo | $199,900 | $160 | 59 |
| 134 Ivy Park Cir | 0.31mi | 4/2.0 (+1) | 1,558 (+11%) | 9mo | $253,900 | $163 | 54 |
| 118 Ivy Park Cir | 0.34mi | 4/2.0 (+1) | 1,558 (+11%) | 10mo | $248,900 | $160 | 52 |
| 205 E Alabama Ave E | 0.74mi | 2/1.0 (-1) | 1,451 (+4%) | 7mo | $190,000 | $131 | 44 |
Match score weights: distance 35% · size 25% · config 20% · recency 20%. Top-matched comps best support the ARV.
Projected returns pro-forma
-3.0% appreciation · 3.0% rent growth · sell at horizon
- IRR
- -30.4%
- Equity multiple
- -0.01×
- Total profit
- $-49,373
- Equity at exit
- $26,159
- IRR
- -32.4%
- Equity multiple
- -0.42×
- Total profit
- $-69,916
- Equity at exit
- $15,169
Cash invested: $49,123 (down + closing). Projections, not guarantees.
Landlord ↔ Tenant lean methodology
- Overall (STATE)
- 90 Strongly Landlord-Friendly
- State Alabama
- 90 Strongly Landlord-Friendly · R+15
- County
- — inherits STATE
- City
- — inherits STATE
ZIP-level market 35950
- Home prices YoY
- -20.4%
- Active inventory
- 110
Monthly cashflow live
- Estimated rent
- $1,118 medium interval (Pro) →
- Mortgage (P&I)
- −$920
- Tax est. 1.5%
- −$219 /mo · $2,632/yr
- Insurance
- −$73
- HOA
- −$0
- Vacancy / Maint / Mgmt
- −$235
- Net cashflow
- $-329
Break-even live
Sensitivity live
| Price | -10% $-208 | -5% $-268 | +0% $-329 | +5% $-390 | +10% $-450 |
|---|---|---|---|---|---|
| Rent | -10% $-417 | -5% $-373 | +0% $-329 | +5% $-285 | +10% $-241 |
| Rate | -1.0pp $-241 | -0.5pp $-284 | base $-329 | +0.5pp $-375 | +1.0pp $-421 |
UW: 25.0% down · 7.5% · 30yr · 1.5% tax · 5.0% vac · 8.0% maint · 8.0% mgmt
Financing live
Cash to close
- Down payment
- $43,860
- Closing costs
- $5,263
- Reserves months
- —
- Total cash needed
- —
Loan-product check · same deal, 3 products live
Conventional
25% down · 7.5% · 30yr
- Down + closing
- —
- Monthly P&I
- —
- Monthly cashflow
- —
- DSCR
- —
- Eligible?
- —
Personal DTI + credit; lowest rate.
DSCR
20% down · 8.5% · 30yr
- Down + closing
- —
- Monthly P&I
- —
- Monthly cashflow
- —
- DSCR
- —
- Eligible?
- —
No personal income docs; deal must DSCR.
Hard money
10% down · 12.0% · 12mo
- Down + closing
- —
- Monthly P&I
- —
- Monthly cashflow
- —
- DSCR
- —
- Eligible?
- —
Short-term bridge; refi at stabilization.
Rent comps 3 comps
| Address | Beds | Baths | Sqft | Rent | $/sqft | DOM | Units | Dist |
|---|---|---|---|---|---|---|---|---|
| 206 N Emmett St Albertville, AL | 2.0 | 1.0 | 1000 | $895 | $0.90 | 14d | 1 | 0.36mi |
| 1100 Corbin St Albertville, AL | 4.0 | 2.0 | 1423 | $1,475 | $1.04 | 24d | 1 | 1.15mi |
| 1116 Compton Ave Albertville, AL | 3.0 | 1.5 | 1200 | $1,350 | $1.12 | 14d | 1 | 1.40mi |
Listing history 2 events
-
2026-05-07status Pending 112-char remark
-
2026-05-01$1 Active 112-char remark
ⓘ Source: listings_history table (triggers on properties + properties_extension) + one-shot
backfill from property_details.listing_events for pre-trigger history.
Climate risk First Street
- Flood 1/10 Low FEMA zone X (unshaded) · 0% chance over 30 yrs
- Wildfire 3/10 Moderate
- Heat 5/10 Major 7 d/yr ≥104°F today · 20 d/yr by 30 yrs out
- Wind 4/10 Moderate 21% chance of damaging wind over 30 yrs
- Air quality 2/10 Low 0 unhealthy d/yr today · 1 by 30 yrs out
Nearby sold comps map
Loading sold comps map…
Walkable amenities ~0.75 mi
Loading nearby amenities…
Taxation est. · year 1
- Rental income
- $13,417
- − Mortgage interest
- −$9,827
- − Property taxes
- −$2,632
- − Insurance
- −$877
- − Repairs & maintenance
- −$1,073
- − Management
- −$1,073
- − Depreciation
- −$5,104
- Taxable loss
- −$7,169
- Est. tax savings @ 24.0%
- +$1,721
- After-tax cash flow
- $-2,229/yr
For passive investors: Depreciation is non-cash, so a rental often shows a tax loss while cash-flowing — sheltering income. Rental losses are passive: they offset passive income freely, and up to $25,000/yr can offset ordinary (W-2) income if you actively participate and your MAGI is under $100k (phasing out to $0 by $150k); unused losses carry forward. On sale, claimed depreciation is recaptured at up to 25%, and gains may owe capital-gains tax (a 1031 exchange can defer both). Figures are a year-1 estimate at your 24.0% rate — not tax advice; consult a CPA.
Schools (NCES district)
- District
- Albertville City
- NCES district ID
- 0100005
- Math proficiency
- 17% ▼ -29.00%
- Reading proficiency
- 39% ▲ 1.00%
- Median HH income
- $36,890
- Composite
- 23.21/100
- National rank
- #7940
- State rank
- #79 of 129 in AL
Livability — Albertville
- Score
- 65/100
- State rank
- #141
- US rank
- #13438
Category grades
Schools grade is shown separately in the Schools card above.
Census & demographics
- Census place
- Albertville, AL
- Population (ZIP)
- 21,173
Population outlook (Marshall County) Hauer SSP2
- Today (2025)
- 97,402 people
- By 2030
- 98,138 · +0.8%
- By 2040
- 98,502 · +1.1%
- By 2050
- 97,024 · -0.4%
- By 2075
- 89,334 · -8.3%
- By 2100
- 74,749 · -23.3%
Race, ethnicity, and origin ACS 2023
- Neighborhood character
- Majority White (64%)
- Race & ethnicity
- White 64% Hispanic / Latino 31% Two or more races 10% Native American 5% Black 3%
- Hispanic origin (detail)
- Mexican 15%
- Common ancestry
- Slovak 1% Italian 1% Hispanic 1%
- Foreign-born
- 13% · Canada
- Languages at home
- 71% English-only · Spanish 28% French/Haitian/Cajun 1%
Political lean MEDSL · Marshall
- 2024 margin
- Solid R (+71.7) · D 13.8% · R 85.5%
- 2008→2024 swing
- -15.4pp toward R · 2008: -56.4pp · 2024: -71.7pp
- All cycles
- 2024: R+71.7 2020: R+68.7 2016: R+69.5 2012: R+60.1 2008: R+56.4
Not yet ingested
- Civics
- —
Market trends
- HPI YoY
- ▼ -56.37%
- Current HPI
- 220.4214
- Rent YoY
- —
- Metro
- —
- State GDP YoY
- ▲ 2.94%
- F500 in state
- 4
Industry mix (Fortune 500 HQ in AL)
| Industry | F500 HQs | Revenue |
|---|---|---|
| Financial Services | 1 | $8B |
|
||
| Healthcare | 1 | $5B |
|
||
Price history
3 events — show timeline
- 2026-06-08 Sold (MLS) $172,150 VMLS
- 2026-05-07 Pending — VMLS
- 2026-05-01 Listed $1 VMLS
Property tax history
+5.0%/yrLatest (2025): $565 · +7.6% YoY. Source: county tax records.
Cash-flow waterfall
monthlySold comps — $/sqft
last 12 mo · ≤1 miLoading sold comps…