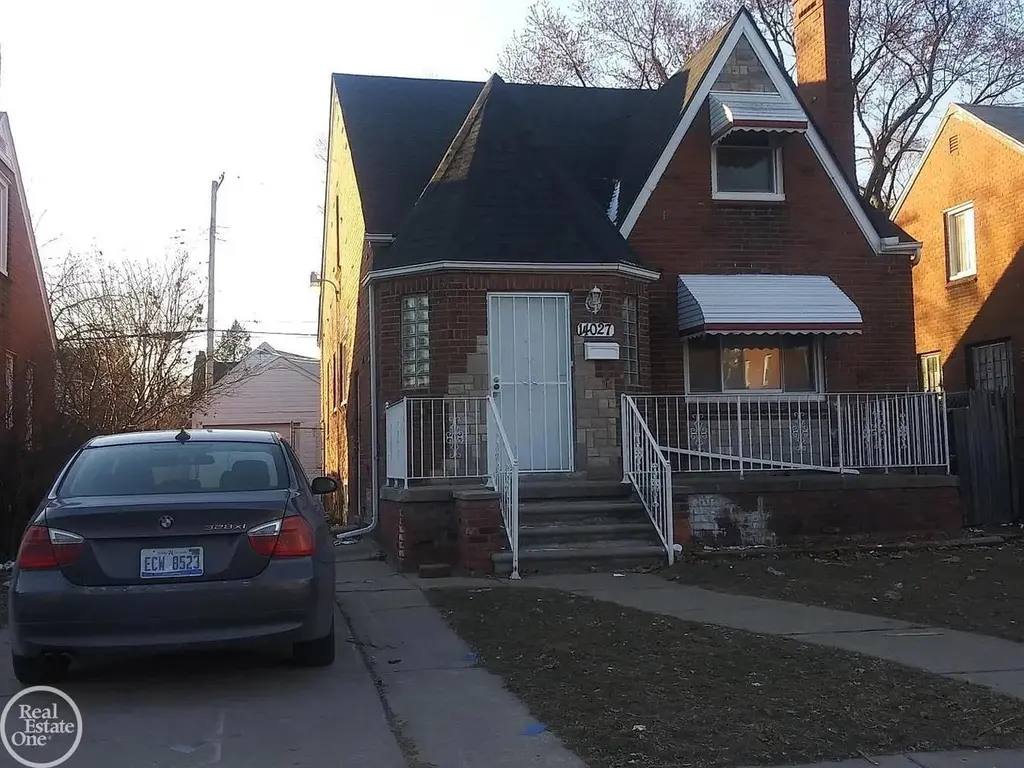
14027 Rutherford St · Detroit, MI
Flood risk 1/10 · Minimal
- FEMA flood zone
- X (unshaded)
- Chance of flooding over 30 yrs
- 0.0%
- Est. flood insurance / yr
- $473 – $860
Fire risk 1/10 · Minimal
- Est. fire insurance / yr
- $784 – $1,456
Heat risk 3/10 · Minor
- Hot days now (above 98°F)
- 7 days/yr
- Hot days in 30 yrs
- 15 days/yr
Wind risk 2/10 · Minimal
- Chance of severe wind over 30 yrs
- —
Air-quality risk 3/10 · Minor
- Unhealthy air days now
- 2 days/yr
- Unhealthy air days in 30 yrs
- 5 days/yr
Risk factors via First Street. Map © Google.
Why this score? — see what drove the D+ grade
The composite is a weighted blend of 9 inputs, each scored 0–100. Each bar is that input's sub-score; the figure is the points it added to the 100-point composite (weight × sub-score).
- Cash flow +20.8/30.0
- 1% rule +7.1/10.0
- DSCR +6.6/10.0
- Rent growth +3.9/5.0
- Livability +3.7/5.0
- Condition / age +2.5/5.0
- Schools +1.3/10.0
- ARV discount +1.2/15.0
- Appreciation +0.0/10.0
$110,000
🖨 Deal sheet (PDF) 📄 Offer letter ✓ Due diligence
Listing remarks
Solid brick bungalow offering comfort, convenience, and low-maintenance living! This well-built home features 3 bedrooms, a spacious living room with a cozy fireplace, and a full basement with a convenient half bath, providing additional living and storage space. The fenced backyard is perfect for pets, play, or outdoor entertaining. A great opportunity for homeowners or investors alike-call today to schedule your private tour!
Key facts
- Brick bungalow
- Full basement
- Cozy fireplace
Tags
Property features AI
Exterior
- Parking: Detached garage with 1 parking space
- Utilities: Natural gas heat; Public water at street; Public sewer at street; Electric service available
- Home design: Residential property; One-story; Built in 1936; Below-grade area present (finished area not listed)
- Construction: Brick construction; Poured foundation; Basement
- Exterior features: Brick exterior; Fenced yard; Sidewalks; Subdivision frontage on a road
Interior
- Kitchen: Range/Oven; Refrigerator
- Bedrooms: Bedroom 1 (Entry level) — approximately 10 x 10; Bedroom 2 (Entry level) — approximately 10 x 9; Bedroom 3 (Entry level) — approximately 9 wide
- Bathrooms: 1 full bathroom (Entry level)
- Heating & cooling: Forced air heating; No central air conditioning
- Interior features: Range/Oven; Refrigerator; Finished below-grade area not indicated (basement present, poured)
- Laundry & utility: Basement present (poured foundation)
Neighborhood map
What this means for you Summary
Snapshot
- This is a 3-bed/1.0-bath single-family listed at $110k.
Deal economics
- At list price, monthly cash flow is $151 ($2k/yr) — positive.
- The deal already cash-flows at list — no discount required.
- Meets the 1% rule at list price ($1k rent vs $110k).
- Cap rate 7.9% vs local median 10.0% in Detroit — below-typical yield; the buyer is paying a premium for something (appreciation thesis, condition, location) that the cap rate doesn't capture.
Location & tenants
- Location reads 73/100 on livability (#218 in MI) — a middle-class / working-renter tenant base. Strengths: amenities A+, commute A+, cost of living A+; Watch: crime F, employment F.
- Detroit Public Schools Community District (urban): math 10% / reading 24% proficiency, ranked #499 of 540 in MI (top 92%) — low school quality limits family demand, transient renter base, plan for 1-2y turnover; 90% free/reduced lunch — lower-income household profile, screen leases tightly.
- Zoned schools: Dossin Elementarymiddle School (319 students, 89% FRL); Cody High School (math 24% / reading 24%, grade F, #481 of 713 statewide, top 81%, 466 students, 88% FRL) — zoned schools at 88% FRL track the district average.
- Market conditions: Rents rising fast (+5.6%/yr); 392 active listings in the ZIP; 40 comparable units currently listed for rent nearby; rentals at typical pace (median 27d on market — plan ~3-4 weeks tenant-placement turnaround); 42% of comp listings sitting > 30 days — soft ceiling on asking rent; lower-income renter base — watch delinquency; 2,639 units permitted in Wayne County in 2024 (1,216 in 5+ unit buildings).
- This rent runs 44% of the median local income ($37k/yr) — at the standard rent-burdened threshold; future hikes will face affordability resistance.
Forward outlook
- Local home prices are declining (-3.0%/yr); year-one equity from $761 of loan paydown is wiped out by about $3k of value loss. Plan a longer hold.
- Wayne County population projected at -17% by 2050 — secular population decline; favor cash flow + early exit over multi-decade hold.
- At projected returns (-3.0% appreciation + 5.6% rent growth), your $31k cash investment doubles in ~10 years — after that, you're playing with house money.
Negotiation context
- Only 7 days on market — expect competitive offers; lowballing is unlikely to land.
- Current owner paid $85k; 29% above their basis — modest negotiation headroom, anchor on the comps not their cost.
Risks & watch-outs
- Watch-outs: property tax is 3.1% of price; built in 1936 — expect roof / HVAC / electrical / plumbing capex.
Questions for the listing agent
- Built in 1936 — when were the roof, HVAC, electrical panel, plumbing, and water heater last replaced?
- Property tax is high relative to price — has the assessment been appealed recently, and will the sale trigger a re-assessment?
- Is there a deadline driving the sale (1031 exchange, divorce, estate, relocation)? That informs how much negotiation room exists.
- Schools are F-rated, which usually means shorter tenancies and higher turnover. Who's the typical renter profile here, and what's been the actual vacancy rate?
- Crime grade is F in this area — have there been break-ins, vandalism, or insurance claims at this property in the last 3 years? What carrier currently insures it and at what premium?
- The area grade is low — what's the realistic commute time and amenity access for the typical tenant pool here? Any planned neighborhood developments (good or bad) we should know about?
- What's the average days-on-market for RENTAL listings here right now (not sales)? A rising rental-DOM trend means longer vacancies and softer asking-rent achievability than the comps imply.
- What's the recent tenant-quality profile in this submarket — average credit score on applications, eviction rate, late-payment / NSF rate, and stable-employment percentage? A property-management company in the area should have these aggregated.
- How much new for-sale + rental construction is in the pipeline within 1–3 miles? Heavy new supply typically softens prices + rents 12–24 months out; constrained supply supports both.
Investment metrics
- 1% rule
- 1.21% ✓
- Cap rate
- 7.94%
- Cash-on-cash
- 5.89%
- DSCR
- 1.26
- GRM
- 6.9
CMA / ARV
- ARV (on-the-fly)
- $96,460
- Comps found
- 12
Show comp detail 12 sales within ~0.75 mi
| Address | Dist | Beds/Ba | Sqft | Sold | Price | $/sf | Match |
|---|---|---|---|---|---|---|---|
| 13995 Montrose St | 0.17mi | 3/1.5 | 1,468 (-1%) | 4mo | $116,600 | $79 | 85 |
| 14018 Prevost St | 0.08mi | 3/2.0 | 1,532 (+3%) | 5mo | $75,000 | $49 | 83 |
| 14100 Winthrop St | 0.25mi | 3/1.0 | 1,411 (-5%) | 4mo | $90,000 | $64 | 76 |
| 14000 Rutland St | 0.47mi | 3/1.5 | 1,461 (-2%) | 1mo | $95,000 | $65 | 73 |
| 13566 Longacre St | 0.60mi | 3/1.0 | 1,510 (+2%) | 2mo | $100,000 | $66 | 67 |
| 14124 Sussex St | 0.47mi | 3/1.0 | 1,646 (+11%) | 3mo | $70,000 | $43 | 57 |
| 13618 Grandmont Ave | 0.35mi | 3/1.0 | 1,267 (-15%) | 3mo | $90,500 | $71 | 56 |
| 14689 Forrer St | 0.54mi | 3/1.5 | 1,627 (+10%) | 3mo | $65,000 | $40 | 54 |
| 14736 Mansfield St | 0.59mi | 3/1.0 | 1,318 (-11%) | 0mo | $62,000 | $47 | 54 |
| 14634 Abington Ave | 0.65mi | 3/1.5 | 1,618 (+9%) | 4mo | $165,000 | $102 | 49 |
| 14529 Asbury Park | 0.46mi | 4/2.0 (+1) | 1,688 (+14%) | 4mo | $127,500 | $76 | 43 |
| 14232 Lauder St | 0.72mi | 3/1.0 | 1,272 (-14%) | 2mo | $60,000 | $47 | 41 |
Match score weights: distance 35% · size 25% · config 20% · recency 20%. Top-matched comps best support the ARV.
Projected returns pro-forma
-3.0% appreciation · 5.59% rent growth · sell at horizon
- IRR
- -3.8%
- Equity multiple
- 0.85×
- Total profit
- $-4,531
- Equity at exit
- $16,401
- IRR
- 9.0%
- Equity multiple
- 1.79×
- Total profit
- $24,308
- Equity at exit
- $9,511
Cash invested: $30,800 (down + closing). Projections, not guarantees.
Landlord ↔ Tenant lean methodology
- Overall (STATE)
- 62 Landlord-Friendly
- State Michigan
- 62 Landlord-Friendly · EVEN
- County
- — inherits STATE
- City
- — inherits STATE
ZIP-level market 48227
- Rents YoY
- 5.6%
- Active inventory
- 392
- Price-to-rent
- 6.9×
Monthly cashflow live
- Estimated rent
- $1,334 high interval (Pro) →
- Mortgage (P&I)
- −$577
- Tax from tax record
- −$280 /mo · $3,358/yr
- Insurance
- −$46
- HOA
- −$0
- Vacancy / Maint / Mgmt
- −$280
- Net cashflow
- $151
Break-even live
Sensitivity live
| Price | -10% $213 | -5% $182 | +0% $151 | +5% $120 | +10% $89 |
|---|---|---|---|---|---|
| Rent | -10% $46 | -5% $98 | +0% $151 | +5% $204 | +10% $256 |
| Rate | -1.0pp $206 | -0.5pp $179 | base $151 | +0.5pp $123 | +1.0pp $94 |
UW: 25.0% down · 7.5% · 30yr · 1.5% tax · 5.0% vac · 8.0% maint · 8.0% mgmt
Financing live
Cash to close
- Down payment
- $27,500
- Closing costs
- $3,300
- Reserves months
- —
- Total cash needed
- —
Loan-product check · same deal, 3 products live
Conventional
25% down · 7.5% · 30yr
- Down + closing
- —
- Monthly P&I
- —
- Monthly cashflow
- —
- DSCR
- —
- Eligible?
- —
Personal DTI + credit; lowest rate.
DSCR
20% down · 8.5% · 30yr
- Down + closing
- —
- Monthly P&I
- —
- Monthly cashflow
- —
- DSCR
- —
- Eligible?
- —
No personal income docs; deal must DSCR.
Hard money
10% down · 12.0% · 12mo
- Down + closing
- —
- Monthly P&I
- —
- Monthly cashflow
- —
- DSCR
- —
- Eligible?
- —
Short-term bridge; refi at stabilization.
Rent comps 40 comps
| Address | Beds | Baths | Sqft | Rent | $/sqft | DOM | Units | Dist |
|---|---|---|---|---|---|---|---|---|
| 14504 Saint Marys St Detroit, MI | 4.0 | 1.0 | 1362 | $1,473 | $1.08 | 45d | 1 | 0.38mi |
| 14510 Asbury Park Detroit, MI | 2.0 | 1.0 | 1771 | $1,250 | $0.71 | 45d | 1 | 0.42mi |
| 14535 Mettetal St Unit 1 Detroit, MI | 2.0 | 1.0 | 965 | $1,000 | $1.04 | 45d | 1 | 0.43mi |
| 14580 Forrer St Unit Unit Detroit, MI | 2.0 | 1.0 | 1300 | $900 | $0.69 | 22d | 1 | 0.45mi |
| 14615 Winthrop St Detroit, MI | 2.0 | 1.0 | 1217 | $1,300 | $1.07 | 18d | 1 | 0.45mi |
| 12840 Grandmont Ave Detroit, MI | 3.0 | 1.0 | 1100 | $1,200 | $1.09 | 45d | 1 | 0.51mi |
| 14104 Coyle St Detroit, MI | 3.0 | 1.0 | 1327 | $1,350 | $1.02 | 7d | 1 | 0.53mi |
| 14836 Rutherford St Unit 2 Detroit, MI | 2.0 | 1.0 | 1104 | $950 | $0.86 | 45d | 1 | 0.56mi |
| 14753 Saint Marys St Detroit, MI | 2.0 | 1.0 | 900 | $1,150 | $1.28 | 14d | 1 | 0.56mi |
| 14753 Saint Marys St Detroit, MI | 2.0 | 1.0 | 900 | $1,150 | $1.28 | 7d | 1 | 0.56mi |
| 13279 Coyle St Detroit, MI | 3.0 | 1.0 | 1444 | $1,373 | $0.95 | 45d | 1 | 0.58mi |
| 14264 Coyle St Detroit, MI | 2.0 | 1.0 | 1000 | $1,150 | $1.15 | 45d | 1 | 0.59mi |
| 12711 Grandmont Ave Detroit, MI | 3.0 | 1.0 | 1000 | $1,400 | $1.40 | 20d | 1 | 0.61mi |
| 16014 Hackett St Detroit, MI | 4.0 | 2.0 | 1142 | $1,500 | $1.31 | 45d | 1 | 0.65mi |
| 14375 Terry St Detroit, MI | 3.0 | 2.0 | 1300 | $1,425 | $1.10 | 45d | 1 | 0.69mi |
| 14800 Woodmont Ave Detroit, MI | 3.0 | 2.0 | 1612 | $1,525 | $0.95 | 17d | 1 | 0.70mi |
| 14893 Prest St Detroit, MI | 3.0 | 1.0 | 1100 | $1,000 | $0.91 | 17d | 1 | 0.70mi |
| 14814 Sussex St Unit 2 Detroit, MI | 3.0 | 1.0 | 1100 | $1,000 | $0.91 | 45d | 1 | 0.74mi |
| 14716 Archdale St Detroit, MI | 2.0 | 1.0 | 900 | $1,100 | $1.22 | 45d | 1 | 0.85mi |
| 13331 Strathmoor St Detroit, MI | 3.0 | 1.0 | 1084 | $1,100 | $1.01 | 18d | 1 | 0.86mi |
| 12754 Marlowe St Detroit, MI | 3.0 | 2.0 | 1008 | $1,400 | $1.39 | 18d | 1 | 0.90mi |
| 15332 Saint Marys St Detroit, MI | 3.0 | 1.0 | 1200 | $1,200 | $1.00 | 18d | 1 | 0.91mi |
| 13581 Penrod St Detroit, MI | 4.0 | 1.0 | 1152 | $1,200 | $1.04 | 45d | 1 | 0.92mi |
| 15065 Gilchrist St Detroit, MI | 3.0 | 1.0 | 1100 | $1,250 | $1.14 | 45d | 1 | 0.92mi |
| 12941 Penrod St Detroit, MI | 2.0 | 1.0 | 1000 | $1,275 | $1.27 | 45d | 1 | 0.95mi |
| 14559 Strathmoor St Detroit, MI | 2.0 | 1.0 | 1033 | $1,150 | $1.11 | 22d | 1 | 0.95mi |
| 15375 Prevost St Detroit, MI | 4.0 | 1.0 | 907 | $1,300 | $1.43 | 18d | 1 | 0.97mi |
| 13591 Faust Ave Detroit, MI | 2.0 | 1.0 | 1000 | $1,275 | $1.27 | 45d | 1 | 0.98mi |
| 12778 Strathmoor St Detroit, MI | 3.0 | 1.0 | 1597 | $1,150 | $0.72 | 7d | 1 | 0.98mi |
| 14600 Strathmoor St Detroit, MI | 4.0 | 1.0 | 1300 | $1,450 | $1.12 | 45d | 1 | 0.99mi |
| 15330 Coyle St Unit 1 Detroit, MI | 3.0 | 1.0 | 1000 | $1,375 | $1.38 | 26d | 1 | 1.06mi |
| 15330 Coyle St Unit 1 Detroit, MI | 3.0 | 1.0 | 1000 | $1,425 | $1.43 | 14d | 1 | 1.06mi |
| 15330 Coyle St Unit 2 Detroit, MI | 3.0 | 1.0 | 1000 | $1,450 | $1.45 | 26d | 1 | 1.06mi |
| 15328 Coyle St Detroit, MI | 3.0 | 1.0 | 1000 | $1,450 | $1.45 | 20d | 1 | 1.07mi |
| 11641 Mansfield St Unit 2 Detroit, MI | 3.0 | 1.0 | 1449 | $1,300 | $0.90 | 45d | 1 | 1.09mi |
| 12950 Glastonbury Ave Detroit, MI | 3.0 | 1.0 | 1000 | $1,400 | $1.40 | 26d | 1 | 1.10mi |
| 14284 Cruse St Detroit, MI | 3.0 | 1.0 | 1121 | $1,150 | $1.03 | 18d | 1 | 1.11mi |
| 15341 Lauder St Detroit, MI | 4.0 | 1.5 | 1080 | $1,475 | $1.37 | 18d | 1 | 1.13mi |
| 14590 Ardmore St Detroit, MI | 3.0 | 1.0 | 1200 | $1,195 | $1.00 | 5d | 1 | 1.13mi |
| 13514 Stahelin Ave Detroit, MI | 3.0 | 1.0 | 1000 | $1,400 | $1.40 | 20d | 1 | 1.15mi |
Listing history 8 events
-
2026-06-21days on market $110,000 Active 7 DOM
-
2026-06-18days on market $110,000 Active 4 DOM
-
2026-06-17days on market $110,000 Active 3 DOM
-
2026-06-16days on market $110,000 Active 2 DOM
-
2026-06-15days on market $110,000 Active 1 DOM
-
2026-06-15days on market $110,000 Active 3 DOM
-
2026-06-13remarks 431-char remark
-
2026-06-13$110,000 Active 1 DOM
ⓘ Source: listings_history table (triggers on properties + properties_extension) + one-shot
backfill from property_details.listing_events for pre-trigger history.
Tax reassessment forecast MI · Partial reset (capped growth)
- Current annual tax
- $3,358 · $280/mo
- Projected year-2 tax
- $3,358 · $280/mo
- Expected delta
- $0/yr ($0/mo · 0.0%)
ⓘ Screening estimate from a state-policy table — verify with the county assessor before closing.
Climate risk First Street
- Flood 1/10 Low FEMA zone X (unshaded) · 0% chance over 30 yrs
- Wildfire 1/10 Low
- Heat 3/10 Moderate 7 d/yr ≥98°F today · 15 d/yr by 30 yrs out
- Wind 2/10 Low
- Air quality 3/10 Moderate 2 unhealthy d/yr today · 5 by 30 yrs out
Nearby sold comps map
Loading sold comps map…
Walkable amenities ~0.75 mi
Loading nearby amenities…
Taxation est. · year 1
- Rental income
- $16,003
- − Mortgage interest
- −$6,162
- − Property taxes
- −$3,358
- − Insurance
- −$550
- − Repairs & maintenance
- −$1,280
- − Management
- −$1,280
- − Depreciation
- −$3,200
- Taxable income
- $173
- Est. tax owed @ 24.0%
- −$42
- After-tax cash flow
- $1,771/yr
For passive investors: Depreciation is non-cash, so a rental often shows a tax loss while cash-flowing — sheltering income. Rental losses are passive: they offset passive income freely, and up to $25,000/yr can offset ordinary (W-2) income if you actively participate and your MAGI is under $100k (phasing out to $0 by $150k); unused losses carry forward. On sale, claimed depreciation is recaptured at up to 25%, and gains may owe capital-gains tax (a 1031 exchange can defer both). Figures are a year-1 estimate at your 24.0% rate — not tax advice; consult a CPA.
Schools (NCES district)
- District
- Detroit Public Schools Community District
- NCES district ID
- 2601103
- Math proficiency
- 10% ▼ -2.00%
- Reading proficiency
- 24% ▲ 6.00%
- Median HH income
- $25,815
- Composite
- 13.06/100
- National rank
- #9564
- State rank
- #499 of 540 in MI
Livability — Detroit
- Score
- 73/100
- State rank
- #218
- US rank
- #5427
Category grades
Schools grade is shown separately in the Schools card above.
Census & demographics
- Census place
- Detroit, MI
- County
- Wayne County · 1,562,939 people
- City population
- 572,865
- Metro
- Detroit-Warren-Dearborn, MI
- Population (ZIP)
- 40,302
- Household income
- $36,527
- Rent vs Own
- Severe rent burden
- 2371.0
Population outlook (Wayne County) Hauer SSP2
- Today (2025)
- 1,675,273 people
- By 2030
- 1,620,300 · -3.3%
- By 2040
- 1,502,341 · -10.3%
- By 2050
- 1,384,039 · -17.4%
- By 2075
- 1,124,592 · -32.9%
- By 2100
- 881,193 · -47.4%
Race, ethnicity, and origin ACS 2023
- Neighborhood character
- Predominantly Black (95%)
- Race & ethnicity
- Black 95% Two or more races 3% White 1%
- Foreign-born
- 1%
- Languages at home
- 98% English-only · Spanish 1% French/Haitian/Cajun 1%
Political lean MEDSL · Wayne
- 2024 margin
- Strong D (+29.0) · D 62.7% · R 33.7% · Other 3.6%
- 2008→2024 swing
- -20.5pp toward R · 2008: 49.5pp · 2024: 29.0pp
- All cycles
- 2024: D+29.0 2020: D+38.1 2016: D+37.3 2012: D+46.9 2008: D+49.5
Not yet ingested
- Civics
- —
Market trends
- HPI YoY
- ▼ -125.00%
- Current HPI
- 186.4158
- Rent YoY
- ▲ 5.59%
- Metro
- Detroit-Warren-Dearborn, MI
- State GDP YoY
- ▲ 1.37%
- F500 in state
- 28
Industry mix (Fortune 500 HQ in MI)
| Industry | F500 HQs | Revenue |
|---|---|---|
| Automotive Parts | 3 | $48B |
|
||
| Automotive | 2 | $372B |
|
||
| Chemicals | 1 | $45B |
|
||
| Automotive Retail | 1 | $29B |
|
||
| Healthcare / Medical Devices | 1 | $23B |
|
||
| Automotive Technology | 1 | $20B |
|
||
Price history
+658.6% since first listed3 events — show timeline
- 2026-06-12 Listed $110,000 MiRealSource-MiMLS
- 2020-01-13 Sold (Public Records) $85,000 Public Records
- 1995-02-02 Sold (Public Records) $14,500 Public Records
Property tax history
+5.4%/yrLatest (2025): $3,358 · +0.3% YoY. Source: county tax records.
Cash-flow waterfall
monthlySold comps — $/sqft
last 12 mo · ≤1 miLoading sold comps…