9819 Palermo Ave · Indianapolis city (balance), IN
Flood risk No data
- FEMA flood zone
- —
- Chance of flooding over 30 yrs
- —
- Est. flood insurance / yr
- —
Fire risk No data
- Est. fire insurance / yr
- —
Heat risk No data
- Hot days now (above threshold)
- —
- Hot days in 30 yrs
- —
Wind risk No data
- Chance of severe wind over 30 yrs
- —
Air-quality risk No data
- Unhealthy air days now
- —
- Unhealthy air days in 30 yrs
- —
Risk factors via First Street. Map © Google.
Why this score? — see what drove the F grade
The composite is a weighted blend of 9 inputs, each scored 0–100. Each bar is that input's sub-score; the figure is the points it added to the 100-point composite (weight × sub-score).
- Cash flow +11.2/30.0
- Rent growth +4.0/5.0
- Schools +4.0/10.0
- ARV discount +3.9/15.0
- 1% rule +3.3/10.0
- DSCR +3.3/10.0
- Livability +2.5/5.0
- Condition / age +2.5/5.0
- Appreciation +0.0/10.0
$259,990
🖨 Deal sheet 📄 Offer letter ✓ Due diligence
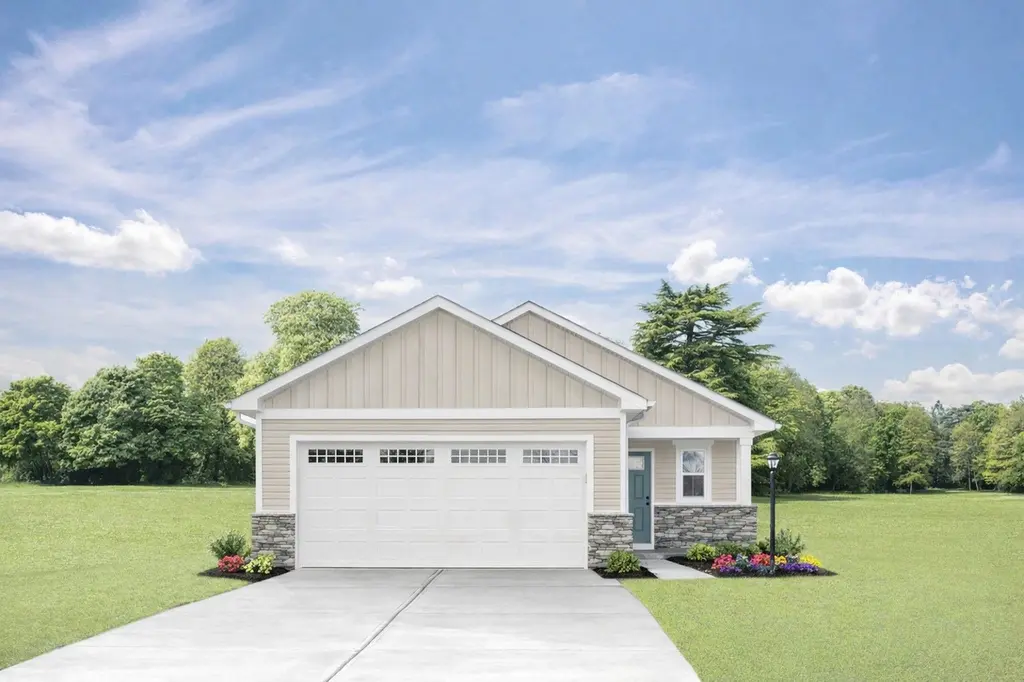
Listing remarks
Welcome to the Rosewood at Palermo Gardens, the lowest-priced new single-family homes in Franklin Township. This two-car garage ranch home offers comfort and convenience on one exceptionally livable level. Enter the large foyer from the front or garage doors, where there's room to add functional family storage. Past the laundry room, the light-filled great room adjoins the gourmet kitchen, where a center island and separate dining space invite every opportunity to gather with friends and family. A full bath and two bedrooms will make guests feel at home, while you relax in the luxury owner's suite with a walk-in closet and dual vanity bath. Schedule your visit today to learn more about the
Key facts
- 2 parking spots
- Built 2026
- Listed 28 days
Property features AI
Finance
- Financial info: List price $259,990
Exterior
- Parking: 2 parking spaces
- Utilities: Central air (cooling)
- Home design: Spec new-construction plan named Rosewood; Active listing
- Exterior features: Living area approximately 1,434
Interior
- Bedrooms: 3 bedrooms
- Bathrooms: 2 full bathrooms
- Heating & cooling: Central air
- Interior features: Central air conditioning
Neighborhood map
What this means for you Summary
Snapshot
- This is a 3-bed/2.0-bath single-family listed at $260k.
Deal economics
- At list price, monthly cash flow is $-102 ($-1k/yr) — negative.
- To cash-flow at today's rent, offer at most $245k (5.7% below list).
- To meet the 1% rule (rent ≥ 1% of price), the offer needs to be $215k (17.5% below list).
- Recommended offer: $215k (17.5% below list) — sets the bar for 1% rule.
- Cap rate 5.8% vs local median 4.4% in Indianapolis city (balance) — top-decile yield for the area; either an underpriced asset or a hidden risk that comps aren't pricing in. Stress-test before assuming the spread holds.
Location & tenants
- Location reads: area grade F — affects rentability + tenant quality, not the cash-flow math above.
- Franklin Township Community School Corporation (urban): math 42% / reading 47% proficiency, ranked #87 of 301 in IN (top 29%) — families likely to look elsewhere, expect single-tenant / working-renter base with shorter leases.
- Market conditions: Rents rising fast (+6.1%/yr); 333 active listings in the ZIP; 6 comparable units currently listed for rent nearby; rentals at typical pace (median 24d on market — plan ~3-4 weeks tenant-placement turnaround); solid renter incomes; 1,906 units permitted in Marion County in 2024 (621 in 5+ unit buildings).
Forward outlook
- Local home prices are declining (-3.0%/yr); year-one equity from $2k of loan paydown is wiped out by about $8k of value loss. Plan a longer hold.
- Marion County population projected at +18% by 2050 — long-run rental-demand tailwind backs the buy-and-hold thesis.
Negotiation context
- It's been on market 29 days — a 2% lower offer ($256k) is reasonable based on typical stale-listing flexibility.
Questions for the listing agent
- What do current leases actually rent for vs. the listed asking? Can we see a recent rent roll and the last 12 months of T-12 income?
- Is there a deadline driving the sale (1031 exchange, divorce, estate, relocation)? That informs how much negotiation room exists.
- The area grade is low — what's the realistic commute time and amenity access for the typical tenant pool here? Any planned neighborhood developments (good or bad) we should know about?
- What's the average days-on-market for RENTAL listings here right now (not sales)? A rising rental-DOM trend means longer vacancies and softer asking-rent achievability than the comps imply.
- What's the recent tenant-quality profile in this submarket — average credit score on applications, eviction rate, late-payment / NSF rate, and stable-employment percentage? A property-management company in the area should have these aggregated.
- How much new for-sale + rental construction is in the pipeline within 1–3 miles? Heavy new supply typically softens prices + rents 12–24 months out; constrained supply supports both.
Investment metrics
- 1% rule
- 0.83% ✗
- Cap rate
- 5.82%
- Cash-on-cash
- -1.68%
- DSCR
- 0.93
- GRM
- 10.1
CMA / ARV
- ARV (on-the-fly)
- $240,912
- Comps found
- 7
Show comp detail 7 sales within ~0.75 mi
| Address | Dist | Beds/Ba | Sqft | Sold | Price | $/sf | Match |
|---|---|---|---|---|---|---|---|
| 4121 Palermo Garden Dr | 0.11mi | 2/2.0 (-1) | 1,563 (+9%) | 15mo | $269,890 | $173 | 62 |
| 4123 Palermo Garden Dr | 0.11mi | 2/2.0 (-1) | 1,568 (+9%) | 15mo | $282,890 | $180 | 62 |
| 9406 Northeastern Ave | 0.48mi | 3/2.0 | 1,338 (-7%) | 13mo | $240,000 | $179 | 56 |
| 10522 Hunters Crossing Blvd | 0.69mi | 3/2.0 | 1,600 (+12%) | 0mo | $268,000 | $168 | 48 |
| 9170 Melrose Ct | 0.63mi | 3/1.5 | 1,493 (+4%) | 22mo | $249,000 | $167 | 44 |
| 9128 Melrose Dr | 0.73mi | 3/2.5 | 1,590 (+11%) | 16mo | $236,500 | $149 | 32 |
| 4648 Bethel Cove Dr | 0.66mi | 2/2.5 (-1) | 1,628 (+14%) | 22mo | $242,000 | $149 | 21 |
Match score weights: distance 35% · size 25% · config 20% · recency 20%. Top-matched comps best support the ARV.
Projected returns pro-forma
-3.0% appreciation · 6.11% rent growth · sell at horizon
- IRR
- -15.6%
- Equity multiple
- 0.43×
- Total profit
- $-41,672
- Equity at exit
- $38,765
- IRR
- -2.6%
- Equity multiple
- 0.80×
- Total profit
- $-14,243
- Equity at exit
- $22,479
Cash invested: $72,797 (down + closing). Projections, not guarantees.
Landlord ↔ Tenant lean methodology
- Overall (STATE)
- 90 Strongly Landlord-Friendly
- State Indiana
- 90 Strongly Landlord-Friendly · R+11
- County
- — inherits STATE
- City
- — inherits STATE
ZIP-level market 46239
- Home prices YoY
- -29.2%
- Rents YoY
- 6.1%
- Active inventory
- 333
- Price-to-rent
- 10.1×
Monthly cashflow live
- Estimated rent
- $2,145 high interval (Pro) →
- Mortgage (P&I)
- −$1,363
- Tax est. 1.5%
- −$325 /mo · $3,900/yr
- Insurance
- −$108
- HOA
- −$0
- Vacancy / Maint / Mgmt
- −$450
- Net cashflow
- $-102
Break-even live
UW: 25.0% down · 7.5% · 30yr · 1.5% tax · 5.0% vac · 8.0% maint · 8.0% mgmt
Financing live
Cash to close
- Down payment
- $64,998
- Closing costs
- $7,800
- Reserves months
- —
- Total cash needed
- —
Loan-product check · same deal, 3 products live
Conventional
25% down · 7.5% · 30yr
- Down + closing
- —
- Monthly P&I
- —
- Monthly cashflow
- —
- DSCR
- —
- Eligible?
- —
Personal DTI + credit; lowest rate.
DSCR
20% down · 8.5% · 30yr
- Down + closing
- —
- Monthly P&I
- —
- Monthly cashflow
- —
- DSCR
- —
- Eligible?
- —
No personal income docs; deal must DSCR.
Hard money
10% down · 12.0% · 12mo
- Down + closing
- —
- Monthly P&I
- —
- Monthly cashflow
- —
- DSCR
- —
- Eligible?
- —
Short-term bridge; refi at stabilization.
Rent comps 6 comps
| Address | Beds | Baths | Sqft | Rent | $/sqft | DOM | Units | Dist |
|---|---|---|---|---|---|---|---|---|
| 4146 Palermo Garden Indianapolis, IN | 3.0 | 2.0 | 1790 | $2,100 | $1.17 | 2d | 1 | 0.09mi |
| 4127 S Post Rd Indianapolis, IN | 3.0 | 2.0 | 1460 | $1,585 | $1.09 | 24d | 1 | 0.84mi |
| 9237 Kavanaugh Dr Indianapolis, IN | 3.0 | 2.0 | 1503 | $2,200 | $1.46 | 18d | 1 | 1.08mi |
| 10166 Southeastern Ave Indianapolis, IN | 2.0 | 1.5 | 1625 | $1,295 | $0.80 | 24d | 1 | 1.19mi |
| 8520 Sierra Ridge Dr Indianapolis, IN | 2.0–3.0 | 2.0 | 1091 | $1,775 | $1.63 | 2d | 18 | 1.36mi |
| 8836 Kipling Dr Indianapolis, IN | 4.0 | 2.5 | 1686 | $2,200 | $1.30 | 24d | 1 | 1.37mi |
Listing history 5 events
-
2026-06-07days on market $259,990 Active 29 DOM
-
2026-06-03days on market $259,990 Active 25 DOM
-
2026-06-02days on market $259,990 Active 24 DOM
-
2026-06-01days on market $259,990 Active 23 DOM
-
2026-05-31days on market $259,990 Active 22 DOM
ⓘ Source: listings_history table (triggers on properties + properties_extension) + one-shot
backfill from property_details.listing_events for pre-trigger history.
Nearby sold comps map
Loading sold comps map…
Walkable amenities ~0.75 mi
Loading nearby amenities…
Taxation est. · year 1
- Rental income
- $25,743
- − Mortgage interest
- −$14,563
- − Property taxes
- −$3,900
- − Insurance
- −$1,300
- − Repairs & maintenance
- −$2,059
- − Management
- −$2,059
- − Depreciation
- −$7,563
- Taxable loss
- −$5,703
- Est. tax savings @ 24.0%
- +$1,369
- After-tax cash flow
- $145/yr
For passive investors: Depreciation is non-cash, so a rental often shows a tax loss while cash-flowing — sheltering income. Rental losses are passive: they offset passive income freely, and up to $25,000/yr can offset ordinary (W-2) income if you actively participate and your MAGI is under $100k (phasing out to $0 by $150k); unused losses carry forward. On sale, claimed depreciation is recaptured at up to 25%, and gains may owe capital-gains tax (a 1031 exchange can defer both). Figures are a year-1 estimate at your 24.0% rate — not tax advice; consult a CPA.
Schools (NCES district)
- District
- Franklin Township Community School Corporation
- NCES district ID
- 1803750
- Math proficiency
- 42% ▼ -12.00%
- Reading proficiency
- 47% ▼ -6.00%
- Median HH income
- $67,825
- Composite
- 39.91/100
- National rank
- #3852
- State rank
- #87 of 301 in IN
Livability — Indianapolis city (balance)
No livability data for this city. (Only ~50 U.S. cities are tracked.)
Census & demographics
- Census place
- Indianapolis city (balance), IN
- County
- Marion County · 998,460 people
- City population
- 881,119
- Metro
- Indianapolis-Carmel-Anderson, IN
- Population (ZIP)
- 33,931
- Household income
- $100,331
- Rent vs Own
- Severe rent burden
- 567.0
Population outlook (Marion County) Hauer SSP2
- Today (2025)
- 1,025,572 people
- By 2030
- 1,065,727 · +3.9%
- By 2040
- 1,141,577 · +11.3%
- By 2050
- 1,208,920 · +17.9%
- By 2075
- 1,367,288 · +33.3%
- By 2100
- 1,438,201 · +40.2%
Race, ethnicity, and origin ACS 2023
- Neighborhood character
- Diverse neighborhood (Simpson 0.61)
- Race & ethnicity
- White 57% Black 24% Hispanic / Latino 9% Two or more races 9% Asian 4%
- Hispanic origin (detail)
- Mexican 6%
- Common ancestry
- Lithuanian 2% Slovak 2% Romanian 1%
- Foreign-born
- 7% · Canada, Philippines, China
- Languages at home
- 89% English-only · Spanish 6% Other Indo-European 2% Chinese 1%
Political lean MEDSL · Marion
- 2024 margin
- Strong D (+27.7) · D 63.0% · R 35.3% · Other 1.7%
- 2008→2024 swing
- -0.7pp no change · 2008: 28.4pp · 2024: 27.7pp
- All cycles
- 2024: D+27.7 2020: D+29.1 2016: D+22.8 2012: D+22.2 2008: D+28.4
Not yet ingested
- Civics
- —
Market trends
- HPI YoY
- ▼ -93.15%
- Current HPI
- 226.1965
- Rent YoY
- ▲ 6.11%
- Metro
- Indianapolis-Carmel-Anderson, IN
- State GDP YoY
- ▲ 2.90%
- F500 in state
- 18
Industry mix (Fortune 500 HQ in IN)
| Industry | F500 HQs | Revenue |
|---|---|---|
| Industrial Machinery | 2 | $37B |
|
||
| Healthcare | 1 | $177B |
|
||
| Pharmaceuticals | 1 | $45B |
|
||
| Metals / Steel | 1 | $18B |
|
||
| Agriculture | 1 | $17B |
|
||
| Packaging | 1 | $12B |
|
||
Cash-flow waterfall
monthlySold comps — $/sqft
last 12 mo · ≤1 miLoading sold comps…