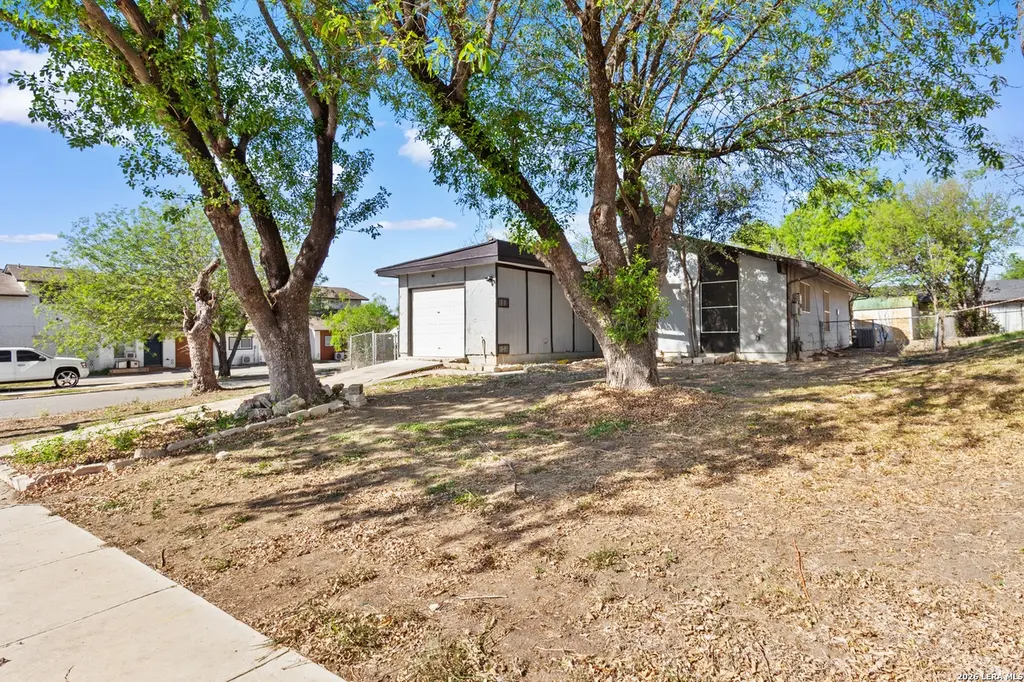
4503 Guadalajara · San Antonio, TX
Flood risk 1/10 · Minimal
- FEMA flood zone
- X (unshaded)
- Chance of flooding over 30 yrs
- 0.0%
- Est. flood insurance / yr
- $507 – $1,088
Fire risk 1/10 · Minimal
- Est. fire insurance / yr
- $1,222 – $2,270
Heat risk 8/10 · Major
- Hot days now (above 108°F)
- 7 days/yr
- Hot days in 30 yrs
- 22 days/yr
Wind risk 8/10 · Major
- Chance of severe wind over 30 yrs
- 80.0%
Air-quality risk 2/10 · Minimal
- Unhealthy air days now
- 0 days/yr
- Unhealthy air days in 30 yrs
- 1 days/yr
Risk factors via First Street. Map © Google.
Why this score? — see what drove the D grade
The composite is a weighted blend of 9 inputs, each scored 0–100. Each bar is that input's sub-score; the figure is the points it added to the 100-point composite (weight × sub-score).
- ARV discount +15.0/15.0
- Cash flow +8.9/30.0
- Livability +4.0/5.0
- 1% rule +3.8/10.0
- Schools +3.8/10.0
- DSCR +2.5/10.0
- Rent growth +2.5/5.0
- Condition / age +2.5/5.0
- Appreciation +0.0/10.0
$155,000
🖨 Deal sheet (PDF) 📄 Offer letter ✓ Due diligence
Listing remarks MLS
Great opportunity in Sierra North! This charming single-story home offers an efficient layout with no wasted space. Priced competitively, it provides the perfect opportunity for a new owner to add personal touches and minor improvements. The home features 3 spacious bedrooms, an open-concept floor plan, and an updated kitchen with ample cabinet space, granite countertops, modern cabinetry, gas cooking, and stainless steel appliances. A new HVAC unit and new water heater have already been installed, and the roof is newer as well. The seller is offering the property as-is, which is reflected in the price. Enjoy a sizeable backyard and a great overall layout-ideal for an investment property or a first-time homebuyer. Conveniently located near shopping, dining, and top-rated NEISD schools.
Key facts
- Modern cabinetry
- Updated kitchen
- Ample cabinet space
Tags
Neighborhood map
What this means for you Summary
Snapshot
- This is a 3-bed/1.0-bath single-family listed at $155k.
Deal economics
- At list price, monthly cash flow is $-126 ($-2k/yr) — negative.
- To cash-flow at today's rent, offer at most $133k (14.4% below list).
- To meet the 1% rule (rent ≥ 1% of price), the offer needs to be $137k (11.7% below list).
- Recommended offer: $133k (14.4% below list) — sets the bar for cash-flow.
- Cap rate 5.3% vs local median 3.8% in San Antonio — top-decile yield for the area; either an underpriced asset or a hidden risk that comps aren't pricing in. Stress-test before assuming the spread holds.
Location & tenants
- Location reads 80/100 on livability (#31 in TX, #1,616 nationally) — a professional / high-income tenant draw. Strengths: amenities A+, commute A+, cost of living A+; Watch: crime F.
- North East ISD (urban): math 38% / reading 49% proficiency, ranked #276 of 826 in TX (top 33%) — families likely to look elsewhere, expect single-tenant / working-renter base with shorter leases.
- Zoned schools: El Dorado El (math 22% / reading 30%, grade F, #2,954 of 4,322 statewide, top 69%, 552 students, 83% FRL); Krueger Middle (math 37% / reading 34%, grade F, #827 of 1,662 statewide, top 51%, 813 students, 77% FRL); Roosevelt H S (math 20% / reading 40%, grade F, #1,096 of 1,632 statewide, top 68%, 2,599 students, 72% FRL) — zoned schools average 77% FRL vs 41% district-wide (36 pts higher); higher-poverty schools than district average — tighter screening recommended.
- Zoned-school proficiency averages 30% at this address vs 44% district-wide (-13 pts) — the specific schools serving this property underperform the North East ISD average; the district grade overstates school quality for this exact location.
- Market conditions: Rents soft (-0.1%/yr); 308 active listings in the ZIP; 40 comparable units currently listed for rent nearby; rentals at typical pace (median 18d on market — plan ~3-4 weeks tenant-placement turnaround); solid renter incomes; 8,308 units permitted in Bexar County in 2024 (2,506 in 5+ unit buildings).
Forward outlook
- Local home prices are declining (-3.0%/yr); year-one equity from $1k of loan paydown is wiped out by about $5k of value loss. Plan a longer hold.
- Bexar County population projected at +50% by 2050 — long-run rental-demand tailwind backs the buy-and-hold thesis.
Negotiation context
- It's been on market 83 days — a 6% lower offer ($146k) is reasonable based on typical stale-listing flexibility.
- 9 sale attempts since 6y ago with the ask held roughly flat each time — persistent listings suggest the price (not the market) is what's stuck; bring a comps-based counter.
Risks & watch-outs
- Watch-outs: property tax is 2.6% of price.
- Climate carrying-cost: severe wind risk, 80% chance of damaging wind over 30y; extreme-heat days projected 7→22/yr by 2055 (HVAC capex compounding) — expect insurance premiums to compound above CPI over the hold.
Questions for the listing agent
- What do current leases actually rent for vs. the listed asking? Can we see a recent rent roll and the last 12 months of T-12 income?
- It's been on market 83 days. Have you received any prior offers? Is the seller open to a 14% concession, seller financing, or rate buy-down credit?
- Built in 1971 — when were the roof, HVAC, electrical panel, plumbing, and water heater last replaced?
- Property tax is high relative to price — has the assessment been appealed recently, and will the sale trigger a re-assessment?
- Why hasn't it sold? Are there any deal-killer items the seller is aware of (foundation, flood, title, zoning, code violations)?
- Is there a deadline driving the sale (1031 exchange, divorce, estate, relocation)? That informs how much negotiation room exists.
- Crime grade is F in this area — have there been break-ins, vandalism, or insurance claims at this property in the last 3 years? What carrier currently insures it and at what premium?
- The area grade is low — what's the realistic commute time and amenity access for the typical tenant pool here? Any planned neighborhood developments (good or bad) we should know about?
- What's the average days-on-market for RENTAL listings here right now (not sales)? A rising rental-DOM trend means longer vacancies and softer asking-rent achievability than the comps imply.
- What's the recent tenant-quality profile in this submarket — average credit score on applications, eviction rate, late-payment / NSF rate, and stable-employment percentage? A property-management company in the area should have these aggregated.
- How much new for-sale + rental construction is in the pipeline within 1–3 miles? Heavy new supply typically softens prices + rents 12–24 months out; constrained supply supports both.
Investment metrics
- 1% rule
- 0.88% ✗
- Cap rate
- 5.32%
- Cash-on-cash
- -3.48%
- DSCR
- 0.85
- GRM
- 9.4
CMA / ARV
- ARV (median comp)
- $213,066
- List price
- $155,000
- Delta
- -27.25%
- Verdict
- UNDERPRICED
- Comps
- 20 within 1.0 mi
Show comp detail 11 sales within ~0.75 mi
| Address | Dist | Beds/Ba | Sqft | Sold | Price | $/sf | Match |
|---|---|---|---|---|---|---|---|
| 4506 Amistad | 0.56mi | 3/1.0 | 873 (-4%) | 4mo | $187,900 | $215 | 64 |
| 4710 Casa Espana St | 0.37mi | 3/1.0 | 984 (+8%) | 12mo | $135,000 | $137 | 60 |
| 12823 Bell | 0.65mi | 3/1.0 | 912 (0%) | 12mo | $95,000 | $104 | 60 |
| 11322 Chapala Way | 0.62mi | 3/1.5 | 901 (-1%) | 11mo | $120,000 | $133 | 58 |
| 4751 Casa Bello | 0.44mi | 3/1.5 | 1,023 (+12%) | 5mo | $197,500 | $193 | 53 |
| 4318 Avenida Prima | 0.25mi | 3/2.0 | 1,033 (+13%) | 12mo | $217,000 | $210 | 52 |
| 4631 Avenida Prima St | 0.52mi | 3/1.0 | 864 (-5%) | 22mo | $182,500 | $211 | 49 |
| 11418 Chapala Way | 0.62mi | 3/1.0 | 1,008 (+10%) | 9mo | $174,900 | $174 | 46 |
| 11410 Chapala Way | 0.62mi | 3/1.5 | 1,010 (+11%) | 12mo | $185,000 | $183 | 41 |
| 4722 Casa Oro St | 0.37mi | 4/2.0 (+1) | 1,038 (+14%) | 16mo | $182,500 | $176 | 38 |
| 13403 Pebble Cir | 0.68mi | 2/1.5 (-1) | 1,032 (+13%) | 22mo | $225,000 | $218 | 21 |
Match score weights: distance 35% · size 25% · config 20% · recency 20%. Top-matched comps best support the ARV.
Projected returns pro-forma
-3.0% appreciation · 0.0% rent growth · sell at horizon
- IRR
- -26.0%
- Equity multiple
- 0.15×
- Total profit
- $-37,047
- Equity at exit
- $23,111
- IRR
- -39.5%
- Equity multiple
- -0.33×
- Total profit
- $-57,671
- Equity at exit
- $13,402
Cash invested: $43,400 (down + closing). Projections, not guarantees.
Landlord ↔ Tenant lean methodology
- Overall (STATE)
- 87 Strongly Landlord-Friendly
- State Texas
- 87 Strongly Landlord-Friendly · R+5
- County
- — inherits STATE
- City
- — inherits STATE
ZIP-level market 78233
- Home prices YoY
- -31.0%
- Rents YoY
- -0.1%
- Active inventory
- 308
- Price-to-rent
- 9.4×
Monthly cashflow live
- Estimated rent
- $1,369 high interval (Pro) →
- Mortgage (P&I)
- −$813
- Tax from tax record
- −$330 /mo · $3,961/yr
- Insurance
- −$65
- HOA
- −$0
- Vacancy / Maint / Mgmt
- −$288
- Net cashflow
- $-126
Break-even live
Sensitivity live
| Price | -10% $-38 | -5% $-82 | +0% $-126 | +5% $-170 | +10% $-214 |
|---|---|---|---|---|---|
| Rent | -10% $-234 | -5% $-180 | +0% $-126 | +5% $-72 | +10% $-18 |
| Rate | -1.0pp $-48 | -0.5pp $-87 | base $-126 | +0.5pp $-166 | +1.0pp $-207 |
UW: 25.0% down · 7.5% · 30yr · 1.5% tax · 5.0% vac · 8.0% maint · 8.0% mgmt
Financing live
Cash to close
- Down payment
- $38,750
- Closing costs
- $4,650
- Reserves months
- —
- Total cash needed
- —
Loan-product check · same deal, 3 products live
Conventional
25% down · 7.5% · 30yr
- Down + closing
- —
- Monthly P&I
- —
- Monthly cashflow
- —
- DSCR
- —
- Eligible?
- —
Personal DTI + credit; lowest rate.
DSCR
20% down · 8.5% · 30yr
- Down + closing
- —
- Monthly P&I
- —
- Monthly cashflow
- —
- DSCR
- —
- Eligible?
- —
No personal income docs; deal must DSCR.
Hard money
10% down · 12.0% · 12mo
- Down + closing
- —
- Monthly P&I
- —
- Monthly cashflow
- —
- DSCR
- —
- Eligible?
- —
Short-term bridge; refi at stabilization.
Rent comps 40 comps
| Address | Beds | Baths | Sqft | Rent | $/sqft | DOM | Units | Dist |
|---|---|---|---|---|---|---|---|---|
| 4306 Limpio St San Antonio, TX | 3.0 | 1.0 | 976 | $1,195 | $1.22 | 16d | 1 | 0.17mi |
| 12236 La Barca Dr San Antonio, TX | 3.0 | 1.0 | 900 | $1,275 | $1.42 | 16d | 1 | 0.18mi |
| 11906 Las Vegas St San Antonio, TX | 3.0 | 1.0 | 976 | $1,195 | $1.22 | 4d | 1 | 0.20mi |
| 12610 Uhr Ln #335 San Antonio, TX | 2.0 | 1.5 | 902 | $1,195 | $1.32 | 45d | 1 | 0.40mi |
| 12133 El Sendero St San Antonio, TX | 2.0 | 1.5 | 1100 | $1,375 | $1.25 | 45d | 1 | 0.40mi |
| 11607 Capotillo St Unit 4 San Antonio, TX | 2.0 | 1.5 | 968 | $1,020 | $1.05 | 18d | 1 | 0.40mi |
| 11235 Terra Loop Rd San Antonio, TX | 2.0 | 2.0 | 982 | $1,225 | $1.25 | 25d | 1 | 0.47mi |
| 4620 Thousand Oaks Dr San Antonio, TX | 1.0–2.0 | 1.0–2.0 | 717 | $1,205 | $1.68 | 9d | 19 | 0.48mi |
| 11211 Terra Loop Rd San Antonio, TX | 2.0 | 2.0 | 982 | $1,225 | $1.25 | 25d | 1 | 0.48mi |
| 11207 Terra Loop Rd San Antonio, TX | 2.0 | 2.0 | 980 | $1,225 | $1.25 | 23d | 1 | 0.49mi |
| 12660 Uhr Ln Apt 710 San Antonio, TX | 2.0 | 2.0 | 976 | $939 | $0.96 | 0d | 1 | 0.49mi |
| 4827 Casa Grande St San Antonio, TX | 3.0 | 2.0 | 1125 | $1,650 | $1.47 | 9d | 1 | 0.52mi |
| 4409 Terra Summit Rd San Antonio, TX | 2.0 | 2.0 | 982 | $1,195 | $1.22 | 45d | 1 | 0.52mi |
| 12614 Cisco Blvd San Antonio, TX | 2.0 | 1.0 | 864 | $1,250 | $1.45 | 25d | 1 | 0.52mi |
| 12707 Skyline Blvd San Antonio, TX | 2.0 | 1.0 | 926 | $1,300 | $1.40 | 45d | 1 | 0.53mi |
| 11206 Center Point Rd San Antonio, TX | 2.0 | 2.0 | 1000 | $1,225 | $1.23 | 23d | 1 | 0.57mi |
| 11823 Casa Alto St San Antonio, TX | 3.0 | 1.0 | 968 | $1,340 | $1.38 | 0d | 1 | 0.62mi |
| 12635 Scarsdale St San Antonio, TX | 1.0–2.0 | 1.0–2.0 | 900 | $1,540 | $1.71 | 0d | 19 | 0.75mi |
| 4711 Erin Blvd San Antonio, TX | 2.0 | 1.0 | 840 | $1,350 | $1.61 | 25d | 1 | 0.79mi |
| 4707 Erin Blvd San Antonio, TX | 3.0 | 2.0 | 800 | $1,500 | $1.88 | 25d | 1 | 0.79mi |
| 4623 Erin Blvd San Antonio, TX | 2.0 | 1.0 | 1056 | $1,350 | $1.28 | 25d | 1 | 0.81mi |
| 4031 Thousand Oaks Dr San Antonio, TX | 1.0–2.0 | 1.0–2.0 | 837 | $1,065 | $1.27 | 0d | 59 | 0.87mi |
| 5411 Encanta St San Antonio, TX | 3.0 | 1.5 | 1053 | $1,435 | $1.36 | 45d | 1 | 0.91mi |
| 10527 Perrin Beitel Rd San Antonio, TX | 1.0–2.0 | 1.0–2.0 | 899 | $1,200 | $1.33 | 0d | 2 | 0.99mi |
| 13031 Park Xing San Antonio, TX | 1.0–3.0 | 1.0–2.5 | 1070 | $2,051 | $1.92 | 0d | 22 | 1.02mi |
| 5206 Wurzbach Pkwy Unit 710 San Antonio, TX | 2.0 | 2.0 | 1024 | $1,545 | $1.51 | 0d | 1 | 1.11mi |
| 3919 Perrin Central Blvd San Antonio, TX | 1.0–2.0 | 1.0–2.0 | 778 | $1,185 | $1.52 | 0d | 42 | 1.15mi |
| 3787 Perrin Central Blvd Apt 710 San Antonio, TX | 2.0 | 2.0 | 892 | $961 | $1.08 | 0d | 1 | 1.15mi |
| 13538 Bret Harte St San Antonio, TX | 3.0 | 2.0 | 967 | $1,600 | $1.65 | 25d | 1 | 1.19mi |
| 13538 Bret Harte St San Antonio, TX | 3.0 | 2.0 | 967 | $1,600 | $1.65 | 45d | 1 | 1.19mi |
| 4910 Tennyson Dr San Antonio, TX | 3.0 | 1.5 | 962 | $1,395 | $1.45 | 5d | 1 | 1.20mi |
| 3800 Perrin Central Blvd San Antonio, TX | 1.0–3.0 | 1.0–2.0 | 940 | $1,769 | $1.88 | 45d | 38 | 1.21mi |
| 3800 Perrin Central Blvd San Antonio, TX | 1.0–3.0 | 1.0–2.0 | 940 | $1,789 | $1.90 | 25d | 35 | 1.21mi |
| 3800 Perrin Central Blvd Unit 710 San Antonio, TX | 2.0 | 2.0 | 742 | $913 | $1.23 | 0d | 1 | 1.21mi |
| 3902 Perrin Central Blvd Unit 710 San Antonio, TX | 2.0 | 2.0 | 976 | $940 | $0.96 | 23d | 1 | 1.23mi |
| 3902 Perrin Central Blvd San Antonio, TX | 1.0–2.0 | 1.0–2.0 | 777 | $1,424 | $1.83 | 0d | 29 | 1.25mi |
| 4502 Longvale Dr San Antonio, TX | 3.0 | 2.0 | 1092 | $1,600 | $1.47 | 6d | 1 | 1.31mi |
| 4530 Longvale Dr San Antonio, TX | 3.0 | 1.0 | 1000 | $1,375 | $1.38 | 16d | 1 | 1.32mi |
| 4527 Clear Spring Dr San Antonio, TX | 3.0 | 1.5 | 1098 | $1,350 | $1.23 | 25d | 1 | 1.34mi |
| 4518 Clear Spring Dr San Antonio, TX | 3.0 | 1.0 | 864 | $1,275 | $1.48 | 16d | 1 | 1.37mi |
Listing history 42 events
-
2026-06-21days on market $155,000 Active 83 DOM
-
2026-06-18days on market $155,000 Active 80 DOM
-
2026-06-17days on market $155,000 Active 79 DOM
-
2026-06-16days on market $155,000 Active 78 DOM
-
2026-06-13days on market $155,000 Active 75 DOM
-
2026-06-13days on market $155,000 Active 74 DOM
-
2026-06-09days on market $155,000 Active 71 DOM
-
2026-06-08days on market $155,000 Active 70 DOM
-
2026-06-07days on market $155,000 Active 69 DOM
-
2026-06-04days on market $155,000 Active 66 DOM
-
2026-06-03days on market $155,000 Active 65 DOM
-
2026-06-02days on market $155,000 Active 64 DOM
-
2026-06-01days on market $155,000 Active 63 DOM
-
2026-05-31days on market $155,000 Active 62 DOM
-
2026-03-30$155,000 New 798-char remark
Show marketing remark (798 chars)
Great opportunity in Sierra North! This charming single-story home offers an efficient layout with no wasted space. Priced competitively, it provides the perfect opportunity for a new owner to add personal touches and minor improvements. The home features 3 spacious bedrooms, an open-concept floor plan, and an updated kitchen with ample cabinet space, granite countertops, modern cabinetry, gas cooking, and stainless steel appliances. A new HVAC unit and new water heater have already been installed, and the roof is newer as well. The seller is offering the property as-is, which is reflected in the price. Enjoy a sizeable backyard and a great overall layout-ideal for an investment property or a first-time homebuyer. Conveniently located near shopping, dining, and top-rated NEISD schools.
-
2023-07-03historical
-
2023-06-23price $164,900
-
2023-06-14price $174,900
-
2023-06-13status Back on Market
-
2023-06-02historical Active Option
-
2023-06-01status Back on Market
-
2023-05-22status Pending
-
2023-05-18historical Active Option
-
2023-05-13price $180,000
-
2023-04-17status Back on Market
-
2023-04-10historical Active Option
-
2023-03-27price $189,000
-
2023-03-06status Back on Market
-
2023-03-03historical
-
2023-02-19status Back on Market
-
2023-02-09historical
-
2023-02-03$199,000 New
-
2021-11-19soldstatus
-
2021-11-16soldstatus Sold
-
2021-10-26historical Active Option
-
2021-10-14$155,000 New
-
2020-11-17soldstatus
-
2020-11-16soldstatus Sold
-
2020-10-18status Pending
-
2020-10-09historical Active Option
-
2020-10-02$147,000 New
-
1988-08-01soldstatus
ⓘ Source: listings_history table (triggers on properties + properties_extension) + one-shot
backfill from property_details.listing_events for pre-trigger history.
Tax reassessment forecast TX · Resets to sale price
- Current annual tax
- $3,961 · $330/mo
- Projected year-2 tax
- $3,961 · $330/mo
- Expected delta
- $0/yr ($0/mo · 0.0%)
ⓘ Screening estimate from a state-policy table — verify with the county assessor before closing.
Climate risk First Street
- Flood 1/10 Low FEMA zone X (unshaded) · 0% chance over 30 yrs
- Wildfire 1/10 Low
- Heat 8/10 Severe 7 d/yr ≥108°F today · 22 d/yr by 30 yrs out
- Wind 8/10 Severe 80% chance of damaging wind over 30 yrs
- Air quality 2/10 Low 0 unhealthy d/yr today · 1 by 30 yrs out
Nearby sold comps map
Loading sold comps map…
Walkable amenities ~0.75 mi
Loading nearby amenities…
Taxation est. · year 1
- Rental income
- $16,429
- − Mortgage interest
- −$8,682
- − Property taxes
- −$3,961
- − Insurance
- −$775
- − Repairs & maintenance
- −$1,314
- − Management
- −$1,314
- − Depreciation
- −$4,509
- Taxable loss
- −$4,128
- Est. tax savings @ 24.0%
- +$991
- After-tax cash flow
- $-521/yr
For passive investors: Depreciation is non-cash, so a rental often shows a tax loss while cash-flowing — sheltering income. Rental losses are passive: they offset passive income freely, and up to $25,000/yr can offset ordinary (W-2) income if you actively participate and your MAGI is under $100k (phasing out to $0 by $150k); unused losses carry forward. On sale, claimed depreciation is recaptured at up to 25%, and gains may owe capital-gains tax (a 1031 exchange can defer both). Figures are a year-1 estimate at your 24.0% rate — not tax advice; consult a CPA.
Schools (NCES district)
- District
- North East ISD
- NCES district ID
- 4832940
- Math proficiency
- 38% ▼ -14.00%
- Reading proficiency
- 49% ▼ -4.00%
- Median HH income
- $57,715
- Composite
- 38.1/100
- National rank
- #4276
- State rank
- #276 of 826 in TX
Livability — San Antonio
- Score
- 80/100
- State rank
- #31
- US rank
- #1616
Category grades
Schools grade is shown separately in the Schools card above.
Census & demographics
- Census place
- San Antonio, TX
- County
- Bexar County · 1,990,555 people
- City population
- 1,806,925
- Metro
- San Antonio-New Braunfels, TX
- Population (ZIP)
- 48,911
- Household income
- $76,421
- Rent vs Own
- Severe rent burden
- 1635.0
Population outlook (Bexar County) Hauer SSP2
- Today (2025)
- 2,336,851 people
- By 2030
- 2,560,728 · +9.6%
- By 2040
- 3,020,569 · +29.3%
- By 2050
- 3,493,522 · +49.5%
- By 2075
- 4,668,459 · +99.8%
- By 2100
- 5,533,242 · +136.8%
Race, ethnicity, and origin ACS 2023
- Neighborhood character
- Diverse neighborhood (Simpson 0.62)
- Race & ethnicity
- Hispanic / Latino 52% White 31% Two or more races 23% Black 11% Asian 3% Native American 1%
- Hispanic origin (detail)
- Mexican 42% Puerto Rican 3%
- Common ancestry
- Romanian 1% Lithuanian 1% Italian 1%
- Foreign-born
- 12% · Canada, South Korea, Vietnam
- Languages at home
- 69% English-only · Spanish 27% Korean 1% Other Asian/Pacific 1%
Political lean MEDSL · Bexar
- 2024 margin
- Lean D (+9.8) · D 54.3% · R 44.6% · Other 1.1%
- 2008→2024 swing
- +4.2pp toward D · 2008: 5.6pp · 2024: 9.8pp
- All cycles
- 2024: D+9.8 2020: D+18.2 2016: D+13.5 2012: D+4.6 2008: D+5.6
Not yet ingested
- Civics
- —
Market trends
- HPI YoY
- ▼ -123.27%
- Current HPI
- 274.943
- Rent YoY
- ▼ -0.06%
- Metro
- San Antonio-New Braunfels, TX
- State GDP YoY
- ▲ 3.95%
- F500 in state
- 110
Industry mix (Fortune 500 HQ in TX)
| Industry | F500 HQs | Revenue |
|---|---|---|
| Energy | 16 | $1,198B |
|
||
| Technology | 5 | $198B |
|
||
| Engineering / Construction | 4 | $72B |
|
||
| Energy Services | 3 | $60B |
|
||
| Utilities | 3 | $41B |
|
||
| Healthcare | 2 | $330B |
|
||
Price history
+5.4% since first listed28 events — show timeline
- 2026-03-30 Listed $155,000 LERA
- 2023-07-03 Listing Removed — LERA
- 2023-06-23 Price Changed $164,900 LERA
- 2023-06-14 Price Changed $174,900 LERA
- 2023-06-13 Relisted — LERA
- 2023-06-02 Contingent — LERA
- 2023-06-01 Relisted — LERA
- 2023-05-22 Pending — LERA
- 2023-05-18 Contingent — LERA
- 2023-05-13 Price Changed $180,000 LERA
- 2023-04-17 Relisted — LERA
- 2023-04-10 Contingent — LERA
- 2023-03-27 Price Changed $189,000 LERA
- 2023-03-06 Relisted — LERA
- 2023-03-03 Listing Removed — LERA
- 2023-02-19 Relisted — LERA
- 2023-02-09 Listing Removed — LERA
- 2023-02-03 Listed $199,000 LERA
- 2021-11-19 Sold (Public Records) — Public Records
- 2021-11-16 Sold (MLS) — LERA
- 2021-10-26 Contingent — LERA
- 2021-10-14 Listed $155,000 LERA
- 2020-11-17 Sold (Public Records) — Public Records
- 2020-11-16 Sold (MLS) — LERA
- 2020-10-18 Pending — LERA
- 2020-10-09 Contingent — LERA
- 2020-10-02 Listed $147,000 LERA
- 1988-08-01 Sold (Public Records) — Public Records
Property tax history
+6.1%/yrLatest (2025): $3,961 · +0.9% YoY. Source: county tax records.
Cash-flow waterfall
monthlySold comps — $/sqft
last 12 mo · ≤1 miLoading sold comps…