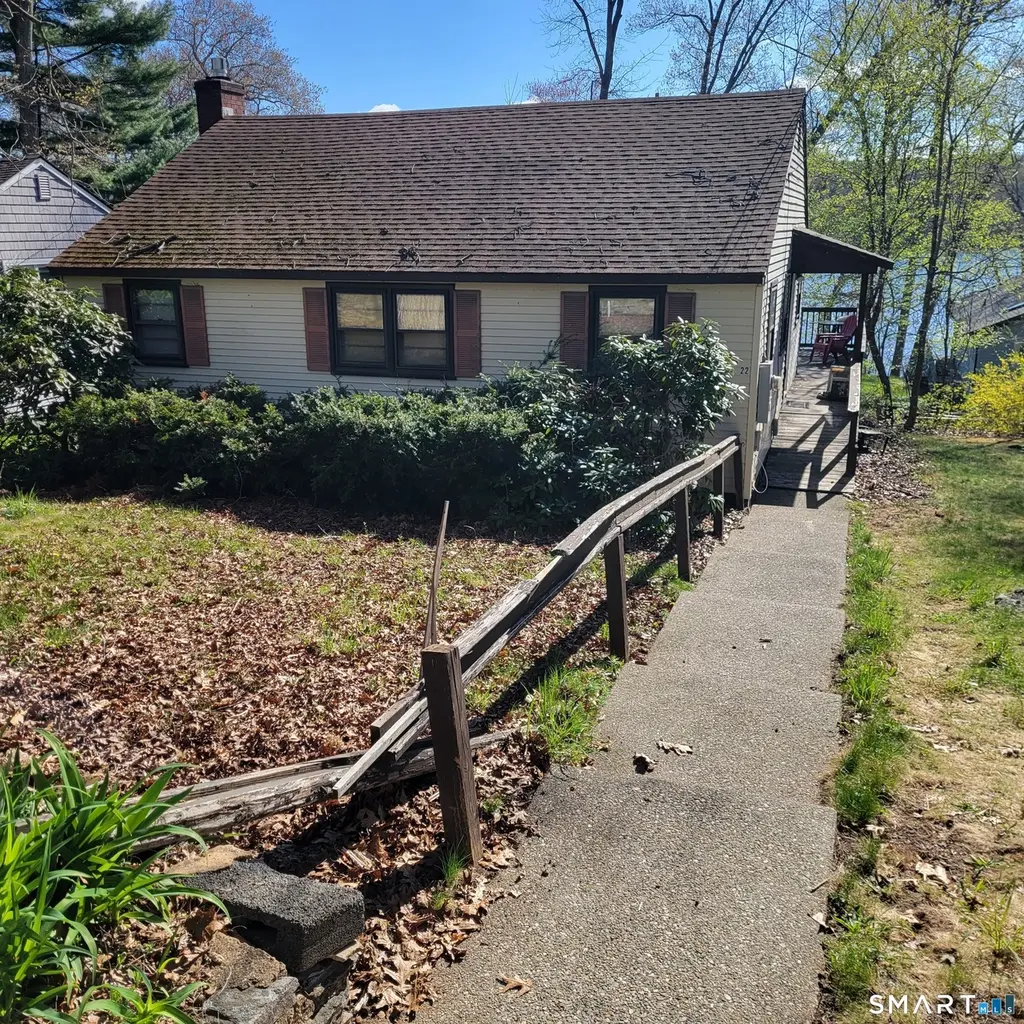
22 Ridgewood Rd · East Haddam, CT
Flood risk 1/10 · Minimal
- FEMA flood zone
- X (unshaded)
- Chance of flooding over 30 yrs
- 0.0%
- Est. flood insurance / yr
- $507 – $1,088
Fire risk 3/10 · Minor
- Est. fire insurance / yr
- $829 – $1,539
Heat risk 5/10 · Moderate
- Hot days now (above 94°F)
- 7 days/yr
- Hot days in 30 yrs
- 17 days/yr
Wind risk 6/10 · Moderate
- Chance of severe wind over 30 yrs
- 71.0%
Air-quality risk 3/10 · Minor
- Unhealthy air days now
- 3 days/yr
- Unhealthy air days in 30 yrs
- 4 days/yr
Risk factors via First Street. Map © Google.
Why this score? — see what drove the C grade
The composite is a weighted blend of 9 inputs, each scored 0–100. Each bar is that input's sub-score; the figure is the points it added to the 100-point composite (weight × sub-score).
- Cash flow +20.5/30.0
- ARV discount +12.7/15.0
- DSCR +6.5/10.0
- 1% rule +5.1/10.0
- Schools +5.1/10.0
- Rent growth +2.5/5.0
- Livability +2.5/5.0
- Condition / age +2.5/5.0
- Appreciation +0.0/10.0
$345,000
🖨 Deal sheet (PDF) 📄 Offer letter ✓ Due diligence
Listing remarks
Only 3 bedroom year round home currently for sale at beautiful Lake Hayward. .beautiful view and minutes from the main beach, tennis, basketball and family activities. .remodeled kitchen with tile floor and center island w/ granite. ., gas log FP, large great room with wall of windows on the lake side, pull down attic, former elec space heater disconnected but could be restored or easy to install mini splits. .will need some appliances, some new flooring and deck repair/replacement but well worth the effort for your primary or summer home at the Lake!! 2 Frontages gives addtl parking and boat storage in the rear of the home. . pls do not go onto the deck. .some unsafe boards. . REDUCED!! B
Key facts
- 6,098 sq ft lot
- 2 parking spots
- Built 1957
Property features AI
Finance
- Other: Nearby amenities include golf course, lake, playground/tot lot, and tennis courts
- HOA & community: Homeowners association with annual fee of $439; Association includes tennis, lake/beach access, trash pickup, and snow removal; Property managed by unit owners association
Exterior
- Parking: Off-street parking; Two parking spaces
- Utilities: Private well water; Septic sewage system; Electric hot water
- Home design: Single-family home
- Construction: Frame construction; Vinyl siding; Asphalt shingle roof; Concrete foundation; Gold exterior color
- Exterior features: Sloping lot with water view; Walk-to-water and beach rights; association access required; Association provides lake/beach access
Interior
- Kitchen: Dishwasher
- Bedrooms: Three bedrooms
- Bathrooms: One full bathroom
- Heating & cooling: Ceiling fans; Window air conditioning units; Heating listed as other
- Interior features: Five total rooms; One fireplace; Has an attic with pull-down stairs; Crawl space basement
- Laundry & utility: 30-gallon electric hot water tank
Neighborhood map
What this means for you Summary
Snapshot
- This is a 3-bed/1.0-bath single-family listed at $345k.
Deal economics
- At list price, monthly cash flow is $456 ($5k/yr) — positive.
- The deal already cash-flows at list — no discount required.
- Meets the 1% rule at list price ($4k rent vs $345k).
- Recommended offer: $335k (3.0% below list) — sets the bar for market timing.
Location & tenants
- Location reads: area grade C — affects rentability + tenant quality, not the cash-flow math above.
- East Haddam School District (rural): math 47% / reading 65% proficiency, ranked #59 of 153 in CT (top 39%) — acceptable for families but not a draw, mixed tenant base, ~2y average lease; only 11% free/reduced lunch — higher-income household profile.
- Zoned schools: East Haddam Elementary School (math 57% / reading 57%, grade C+, #177 of 553 statewide, top 34%, 337 students, 27% FRL); Nathan Hale-Ray Middle School (math 46% / reading 67%, grade B, #59 of 175 statewide, top 34%, 378 students, 28% FRL); Nathan Hale-Ray High School (math 42% / reading 67%, grade C-, #63 of 194 statewide, top 39%, 262 students, 22% FRL).
- Market conditions: 68 active listings in the ZIP; 1 comparable units currently listed for rent nearby; 278 units permitted in Lower Connecticut River Valley Planning Region in 2024 (89 in 5+ unit buildings).
Forward outlook
- Local home prices are declining (-3.0%/yr); year-one equity from $2k of loan paydown is wiped out by about $10k of value loss. Plan a longer hold.
Negotiation context
- It's been on market 46 days — a 3% lower offer ($335k) is reasonable based on typical stale-listing flexibility.
- Current owner paid $116k; list at $345k implies a 197% gain — meaningful room to come down on a strong offer.
Risks & watch-outs
- Watch-outs: built in 1957 — expect roof / HVAC / electrical / plumbing capex.
- Climate carrying-cost: major wind risk, 71% chance of damaging wind over 30y; extreme-heat days projected 7→17/yr by 2055 (HVAC capex compounding) — expect insurance premiums to compound above CPI over the hold.
Questions for the listing agent
- It's been on market 46 days. Have you received any prior offers? Is the seller open to a 3% concession, seller financing, or rate buy-down credit?
- Built in 1957 — when were the roof, HVAC, electrical panel, plumbing, and water heater last replaced?
- What does the HOA fee cover, when was the last increase, and are there any pending special assessments or reserve-fund shortfalls?
- Is there a deadline driving the sale (1031 exchange, divorce, estate, relocation)? That informs how much negotiation room exists.
- What's the average days-on-market for RENTAL listings here right now (not sales)? A rising rental-DOM trend means longer vacancies and softer asking-rent achievability than the comps imply.
- What's the recent tenant-quality profile in this submarket — average credit score on applications, eviction rate, late-payment / NSF rate, and stable-employment percentage? A property-management company in the area should have these aggregated.
- How much new for-sale + rental construction is in the pipeline within 1–3 miles? Heavy new supply typically softens prices + rents 12–24 months out; constrained supply supports both.
Investment metrics
- 1% rule
- 1.01% ✓
- Cap rate
- 7.88%
- Cash-on-cash
- 5.66%
- DSCR
- 1.25
- GRM
- 8.2
CMA / ARV
- ARV (median comp)
- $390,299
- List price
- $345,000
- Delta
- -11.61%
- Verdict
- UNDERPRICED
- Comps
- 20 within 1.0 mi
Show comp detail 2 sales within ~0.75 mi
| Address | Dist | Beds/Ba | Sqft | Sold | Price | $/sf | Match |
|---|---|---|---|---|---|---|---|
| 114 Wildwood Rd | 0.32mi | 3/1.0 | 1,303 (+0%) | 9mo | $335,000 | $257 | 77 |
| 5 Ridgewood Rd | 0.07mi | 4/2.0 (+1) | 1,149 (-12%) | 23mo | $415,000 | $361 | 49 |
Match score weights: distance 35% · size 25% · config 20% · recency 20%. Top-matched comps best support the ARV.
Projected returns pro-forma
-3.0% appreciation · 3.0% rent growth · sell at horizon
- IRR
- -7.5%
- Equity multiple
- 0.72×
- Total profit
- $-26,874
- Equity at exit
- $51,441
- IRR
- 2.0%
- Equity multiple
- 1.14×
- Total profit
- $13,999
- Equity at exit
- $29,829
Cash invested: $96,600 (down + closing). Projections, not guarantees.
Landlord ↔ Tenant lean methodology
- Overall (STATE)
- 27 Tenant-Leaning
- State Connecticut
- 27 Tenant-Leaning · D+7
- County
- — inherits STATE
- City
- — inherits STATE
ZIP-level market 06415
- Home prices YoY
- -17.2%
- Active inventory
- 68
- Price-to-rent
- 8.2×
Monthly cashflow live
- Estimated rent
- $3,500 medium interval (Pro) →
- Mortgage (P&I)
- −$1,809
- Tax from tax record
- −$319 /mo · $3,832/yr
- Insurance
- −$144
- HOA
- −$37
- Vacancy / Maint / Mgmt
- −$735
- Net cashflow
- $456
Break-even live
Sensitivity live
| Price | -10% $651 | -5% $553 | +0% $456 | +5% $358 | +10% $260 |
|---|---|---|---|---|---|
| Rent | -10% $179 | -5% $317 | +0% $456 | +5% $594 | +10% $732 |
| Rate | -1.0pp $629 | -0.5pp $543 | base $456 | +0.5pp $366 | +1.0pp $275 |
UW: 25.0% down · 7.5% · 30yr · 1.5% tax · 5.0% vac · 8.0% maint · 8.0% mgmt
Financing live
Cash to close
- Down payment
- $86,250
- Closing costs
- $10,350
- Reserves months
- —
- Total cash needed
- —
Loan-product check · same deal, 3 products live
Conventional
25% down · 7.5% · 30yr
- Down + closing
- —
- Monthly P&I
- —
- Monthly cashflow
- —
- DSCR
- —
- Eligible?
- —
Personal DTI + credit; lowest rate.
DSCR
20% down · 8.5% · 30yr
- Down + closing
- —
- Monthly P&I
- —
- Monthly cashflow
- —
- DSCR
- —
- Eligible?
- —
No personal income docs; deal must DSCR.
Hard money
10% down · 12.0% · 12mo
- Down + closing
- —
- Monthly P&I
- —
- Monthly cashflow
- —
- DSCR
- —
- Eligible?
- —
Short-term bridge; refi at stabilization.
Rent comps 1 comps
| Address | Beds | Baths | Sqft | Rent | $/sqft | DOM | Units | Dist |
|---|---|---|---|---|---|---|---|---|
| 333 Lake Shore Dr Colchester, CT | 3.0 | 2.0 | 1414 | $3,500 | $2.48 | 21d | 1 | 0.41mi |
HOA detail
- Monthly dues
- $37 · $444/yr
- Likely covers
- gas
Listing history 22 events
-
2026-06-21days on market $345,000 Active 46 DOM
-
2026-06-21days on market $345,000 Active 45 DOM
-
2026-06-18days on market $345,000 Active 43 DOM
-
2026-06-17days on market $345,000 Active 42 DOM
-
2026-06-16days on market $345,000 Active 41 DOM
-
2026-06-15days on market $345,000 Active 40 DOM
-
2026-06-13days on market $345,000 Active 38 DOM
-
2026-06-12days on market $345,000 Active 37 DOM
-
2026-06-09days on market $345,000 Active 34 DOM
-
2026-06-08days on market $345,000 Active 33 DOM
-
2026-06-07remarks 699-char remark
-
2026-06-07days on market $345,000 Active 32 DOM
-
2026-06-04days on market $345,000 Active 28 DOM
-
2026-06-02days on market $345,000 Active 27 DOM
-
2026-06-01remarks 696-char remark
-
2026-06-01price $345,000 Active 26 DOM
-
2026-06-01days on market $359,900 Active 26 DOM
-
2026-05-31days on market $359,900 Active 25 DOM
-
2026-05-31days on market $359,900 Active 24 DOM
-
2026-05-07$359,900 Active 655-char remark
-
2026-04-24historical $359,900 655-char remark
-
1996-04-02soldstatus $116,000
ⓘ Source: listings_history table (triggers on properties + properties_extension) + one-shot
backfill from property_details.listing_events for pre-trigger history.
Tax reassessment forecast CT · Partial reset (capped growth)
- Current annual tax
- $3,832 · $319/mo
- Projected year-2 tax
- $5,608 · $467/mo
- Expected delta
- +$1,776/yr (+$148/mo · 46.3%)
ⓘ Screening estimate from a state-policy table — verify with the county assessor before closing.
Climate risk First Street
- Flood 1/10 Low FEMA zone X (unshaded) · 0% chance over 30 yrs
- Wildfire 3/10 Moderate
- Heat 5/10 Major 7 d/yr ≥94°F today · 17 d/yr by 30 yrs out
- Wind 6/10 Major 71% chance of damaging wind over 30 yrs
- Air quality 3/10 Moderate 3 unhealthy d/yr today · 4 by 30 yrs out
Nearby sold comps map
Loading sold comps map…
Walkable amenities ~0.75 mi
Loading nearby amenities…
Taxation est. · year 1
- Rental income
- $42,000
- − Mortgage interest
- −$19,325
- − Property taxes
- −$3,832
- − Insurance
- −$1,725
- − Repairs & maintenance
- −$3,360
- − Management
- −$3,360
- − HOA
- −$444
- − Depreciation
- −$10,036
- Taxable loss
- −$83
- Est. tax savings @ 24.0%
- +$20
- After-tax cash flow
- $5,488/yr
For passive investors: Depreciation is non-cash, so a rental often shows a tax loss while cash-flowing — sheltering income. Rental losses are passive: they offset passive income freely, and up to $25,000/yr can offset ordinary (W-2) income if you actively participate and your MAGI is under $100k (phasing out to $0 by $150k); unused losses carry forward. On sale, claimed depreciation is recaptured at up to 25%, and gains may owe capital-gains tax (a 1031 exchange can defer both). Figures are a year-1 estimate at your 24.0% rate — not tax advice; consult a CPA.
Schools (NCES district)
- District
- East Haddam School District
- NCES district ID
- 0901200
- Math proficiency
- 47% ▼ -9.00%
- Reading proficiency
- 65% ▼ -6.00%
- Median HH income
- $82,341
- Composite
- 50.78/100
- National rank
- #1809
- State rank
- #59 of 153 in CT
Livability — East Haddam
No livability data for this city. (Only ~50 U.S. cities are tracked.)
Census & demographics
- Population (ZIP)
- 16,075
Population outlook (Lower Connecticut River Valley County) Hauer SSP2
- By 2040
- 188,651
Race, ethnicity, and origin ACS 2023
- Neighborhood character
- Predominantly White (89%)
- Race & ethnicity
- White 89% Hispanic / Latino 5% Two or more races 4% Black 2%
- Common ancestry
- Romanian 9% Lithuanian 8% Slovak 5%
- Foreign-born
- 6% · Canada, China
- Languages at home
- 95% English-only · Spanish 2% Other Indo-European 1% Russian/Polish/Slavic 1%
Political lean MEDSL · Lower Connecticut River Valley
- 2024 margin
- D (+13.4) · D 55.9% · R 42.4% · Other 1.7%
- All cycles
- 2024: D+13.4
Not yet ingested
- Civics
- —
Market trends
- HPI YoY
- ▼ -50.47%
- Current HPI
- 243.6281
- Rent YoY
- —
- Metro
- —
- State GDP YoY
- ▲ 1.06%
- F500 in state
- 38
Industry mix (Fortune 500 HQ in CT)
| Industry | F500 HQs | Revenue |
|---|---|---|
| Industrial Machinery | 4 | $38B |
|
||
| Insurance | 3 | $71B |
|
||
| Financial Services | 2 | $25B |
|
||
| Transportation / Logistics | 2 | $18B |
|
||
| Healthcare | 1 | $247B |
|
||
| Telecommunications | 1 | $55B |
|
||
Price history
+197.4% since first listed4 events — show timeline
- 2026-06-01 Price Changed $345,000 Smart MLS
- 2026-05-07 Listed $359,900 Smart MLS
- 2026-04-24 Coming Soon $359,900 Smart MLS
- 1996-04-02 Sold (Public Records) $116,000 Public Records
Property tax history
+2.0%/yrLatest (2022): $3,832 · +4.4% YoY. Source: county tax records.
Cash-flow waterfall
monthlySold comps — $/sqft
last 12 mo · ≤1 miLoading sold comps…