8638 S Pleasant Valley Rd · Highfill, AR
Flood risk 1/10 · Minimal
- FEMA flood zone
- X (unshaded)
- Chance of flooding over 30 yrs
- 0.0%
- Est. flood insurance / yr
- $507 – $1,088
Fire risk 5/10 · Moderate
- Est. fire insurance / yr
- $1,499 – $2,785
Heat risk 5/10 · Moderate
- Hot days now (above 105°F)
- 7 days/yr
- Hot days in 30 yrs
- 20 days/yr
Wind risk 2/10 · Minimal
- Chance of severe wind over 30 yrs
- 2.0%
Air-quality risk 2/10 · Minimal
- Unhealthy air days now
- 1 days/yr
- Unhealthy air days in 30 yrs
- 1 days/yr
Risk factors via First Street. Map © Google.
Why this score? — see what drove the C grade
The composite is a weighted blend of 9 inputs, each scored 0–100. Each bar is that input's sub-score; the figure is the points it added to the 100-point composite (weight × sub-score).
- Cash flow +17.8/30.0
- Appreciation +10.0/10.0
- ARV discount +7.5/15.0
- DSCR +5.6/10.0
- 1% rule +3.7/10.0
- Livability +3.4/5.0
- Schools +3.3/10.0
- Rent growth +2.5/5.0
- Condition / age +2.5/5.0
$270,000
🖨 Deal sheet 📄 Offer letter ✓ Due diligence
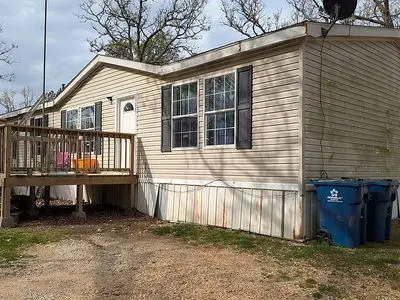
Listing remarks
8638 S Pleasant Valley Rd ?? Right on the edge of Gentry, Decatur, Centerton, Bentonville area ?? High-demand, growth area ?? Country feel with quick access to Centerton & amp; Bentonville ?? Multiple exit strategies 4 acres in a location that keeps getting hotter, perfect for investors or end buyers looking for space + upside. Bonus: Livable trailer on site ? Hold for rental income ? Live in it ? Sell or clear for a new build 4 ACRES. LOCATION. FLEXIBILITY. Deals like this don & acirc; & euro; & trade; t last long in this area. Please note: I am selling my equitable interest in a purchase contract, not the property itself. I am not a licensed agent.
Key facts
- 4 acres
- Built 2005
- Listed 37 days
Tags
Neighborhood map
What this means for you Summary
Snapshot
- This is a 4-bed/2.0-bath manufactured listed at $270k.
Deal economics
- At list price, monthly cash flow is $224 ($3k/yr) — positive.
- The deal already cash-flows at list — no discount required.
- To meet the 1% rule (rent ≥ 1% of price), the offer needs to be $235k (13.0% below list).
- Recommended offer: $235k (13.0% below list) — sets the bar for 1% rule.
- Cap rate 7.3% vs local median 2.9% in Highfill — top-decile yield for the area; either an underpriced asset or a hidden risk that comps aren't pricing in. Stress-test before assuming the spread holds.
Location & tenants
- Location reads 67/100 on livability (#97 in AR) — a middle-class / working-renter tenant base. Strengths: crime A+, employment A+, cost of living A+; Watch: schools F, amenities F, commute F.
- Gentry School District (town): math 36% / reading 41% proficiency, ranked #71 of 238 in AR (top 30%) — families likely to look elsewhere, expect single-tenant / working-renter base with shorter leases.
- Market conditions: 39 active listings in the ZIP; 1 comparable units currently listed for rent nearby; 4,359 units permitted in Benton County in 2024 (402 in 5+ unit buildings).
Forward outlook
- In year one you build about $29k of equity ($2k loan paydown + $27k appreciation (10.0% local appreciation)).
- Benton County population projected at +56% by 2050 — long-run rental-demand tailwind backs the buy-and-hold thesis.
- At projected returns (10.0% appreciation + 3.0% rent growth), your $76k cash investment doubles in ~3 years — after that, you're playing with house money.
- By year 2, paydown + projected appreciation supports a ~$46k cash-out refi (75% LTV) — recoverable capital for the next deal without selling this one.
Negotiation context
- It's been on market 37 days — a 3% lower offer ($262k) is reasonable based on typical stale-listing flexibility.
Risks & watch-outs
- Climate carrying-cost: moderate wildfire risk; extreme-heat days projected 7→20/yr by 2055 (HVAC capex compounding) — expect insurance premiums to compound above CPI over the hold.
Questions for the listing agent
- It's been on market 37 days. Have you received any prior offers? Is the seller open to a 13% concession, seller financing, or rate buy-down credit?
- Is there a deadline driving the sale (1031 exchange, divorce, estate, relocation)? That informs how much negotiation room exists.
- Schools are F-rated, which usually means shorter tenancies and higher turnover. Who's the typical renter profile here, and what's been the actual vacancy rate?
- What's the average days-on-market for RENTAL listings here right now (not sales)? A rising rental-DOM trend means longer vacancies and softer asking-rent achievability than the comps imply.
- What's the recent tenant-quality profile in this submarket — average credit score on applications, eviction rate, late-payment / NSF rate, and stable-employment percentage? A property-management company in the area should have these aggregated.
- How much new for-sale + rental construction is in the pipeline within 1–3 miles? Heavy new supply typically softens prices + rents 12–24 months out; constrained supply supports both.
Investment metrics
- 1% rule
- 0.87% ✗
- Cap rate
- 7.29%
- Cash-on-cash
- 3.56%
- DSCR
- 1.16
- GRM
- 9.6
CMA / ARV
No comps found within radius.
Projected returns pro-forma
10.0% appreciation · 3.0% rent growth · sell at horizon
- IRR
- 26.8%
- Equity multiple
- 3.13×
- Total profit
- $161,212
- Equity at exit
- $243,237
- IRR
- 23.5%
- Equity multiple
- 7.13×
- Total profit
- $463,305
- Equity at exit
- $524,551
Cash invested: $75,600 (down + closing). Projections, not guarantees.
Landlord ↔ Tenant lean methodology
- Overall (STATE)
- 92 Strongly Landlord-Friendly
- State Arkansas
- 92 Strongly Landlord-Friendly · R+14
- County
- — inherits STATE
- City
- — inherits STATE
ZIP-level market 72722
- Home prices YoY
- 15.4%
- Active inventory
- 39
- Price-to-rent
- 9.6×
Monthly cashflow live
- Estimated rent
- $2,350 medium interval (Pro) →
- Mortgage (P&I)
- −$1,416
- Tax from tax record
- −$104 /mo · $1,248/yr
- Insurance
- −$112
- HOA
- −$0
- Vacancy / Maint / Mgmt
- −$494
- Net cashflow
- $224
Break-even live
UW: 25.0% down · 7.5% · 30yr · 1.5% tax · 5.0% vac · 8.0% maint · 8.0% mgmt
Financing live
Cash to close
- Down payment
- $67,500
- Closing costs
- $8,100
- Reserves months
- —
- Total cash needed
- —
Loan-product check · same deal, 3 products live
Conventional
25% down · 7.5% · 30yr
- Down + closing
- —
- Monthly P&I
- —
- Monthly cashflow
- —
- DSCR
- —
- Eligible?
- —
Personal DTI + credit; lowest rate.
DSCR
20% down · 8.5% · 30yr
- Down + closing
- —
- Monthly P&I
- —
- Monthly cashflow
- —
- DSCR
- —
- Eligible?
- —
No personal income docs; deal must DSCR.
Hard money
10% down · 12.0% · 12mo
- Down + closing
- —
- Monthly P&I
- —
- Monthly cashflow
- —
- DSCR
- —
- Eligible?
- —
Short-term bridge; refi at stabilization.
Rent comps 1 comps
| Address | Beds | Baths | Sqft | Rent | $/sqft | DOM | Units | Dist |
|---|---|---|---|---|---|---|---|---|
| 805 NW 70th Ave Bentonville, AR | 3.0 | 2.5 | 2021 | $2,350 | $1.16 | 14d | 1 | 1.47mi |
Listing history 17 events
-
2026-06-18days on market $270,000 Active 37 DOM
-
2026-06-17days on market $270,000 Active 36 DOM
-
2026-06-16days on market $270,000 Active 35 DOM
-
2026-06-15days on market $270,000 Active 34 DOM
-
2026-06-14days on market $270,000 Active 32 DOM
-
2026-06-13days on market $270,000 Active 31 DOM
-
2026-06-10days on market $270,000 Active 29 DOM
-
2026-06-09days on market $270,000 Active 28 DOM
-
2026-06-08days on market $270,000 Active 27 DOM
-
2026-06-07days on market $270,000 Active 26 DOM
-
2026-06-03days on market $270,000 Active 22 DOM
-
2026-06-02days on market $270,000 Active 21 DOM
-
2026-06-01days on market $270,000 Active 20 DOM
-
2026-05-31days on market $270,000 Active 19 DOM
-
2026-05-31days on market $270,000 Active 18 DOM
-
2026-05-13price $270,000
-
2026-05-12$287,000 Active
ⓘ Source: listings_history table (triggers on properties + properties_extension) + one-shot
backfill from property_details.listing_events for pre-trigger history.
Tax reassessment forecast AR · Resets to sale price
- Current annual tax
- $1,248 · $104/mo
- Projected year-2 tax
- $1,728 · $144/mo
- Expected delta
- +$480/yr (+$40/mo · 38.4%)
ⓘ Screening estimate from a state-policy table — verify with the county assessor before closing.
Climate risk First Street
- Flood 1/10 Low FEMA zone X (unshaded) · 0% chance over 30 yrs
- Wildfire 5/10 Major
- Heat 5/10 Major 7 d/yr ≥105°F today · 20 d/yr by 30 yrs out
- Wind 2/10 Low 2% chance of damaging wind over 30 yrs
- Air quality 2/10 Low 1 unhealthy d/yr today · 1 by 30 yrs out
Nearby sold comps map
Loading sold comps map…
Walkable amenities ~0.75 mi
Loading nearby amenities…
Taxation est. · year 1
- Rental income
- $28,200
- − Mortgage interest
- −$15,124
- − Property taxes
- −$1,248
- − Insurance
- −$1,350
- − Repairs & maintenance
- −$2,256
- − Management
- −$2,256
- − Depreciation
- −$7,855
- Taxable loss
- −$1,889
- Est. tax savings @ 24.0%
- +$453
- After-tax cash flow
- $3,142/yr
For passive investors: Depreciation is non-cash, so a rental often shows a tax loss while cash-flowing — sheltering income. Rental losses are passive: they offset passive income freely, and up to $25,000/yr can offset ordinary (W-2) income if you actively participate and your MAGI is under $100k (phasing out to $0 by $150k); unused losses carry forward. On sale, claimed depreciation is recaptured at up to 25%, and gains may owe capital-gains tax (a 1031 exchange can defer both). Figures are a year-1 estimate at your 24.0% rate — not tax advice; consult a CPA.
Schools (NCES district)
- District
- Gentry School District
- NCES district ID
- 0506540
- Math proficiency
- 36% ▼ -15.00%
- Reading proficiency
- 41% ▼ -5.00%
- Median HH income
- $45,160
- Composite
- 32.77/100
- National rank
- #5629
- State rank
- #71 of 238 in AR
Livability — Highfill
- Score
- 67/100
- State rank
- #97
- US rank
- #10302
Category grades
Schools grade is shown separately in the Schools card above.
Census & demographics
- Population (ZIP)
- 2,920
Population outlook (Benton County) Hauer SSP2
- Today (2025)
- 318,683 people
- By 2030
- 353,481 · +10.9%
- By 2040
- 425,280 · +33.4%
- By 2050
- 497,239 · +56.0%
- By 2075
- 662,114 · +107.8%
- By 2100
- 776,431 · +143.6%
Race, ethnicity, and origin ACS 2023
- Neighborhood character
- Diverse neighborhood (Simpson 0.66)
- Race & ethnicity
- White 56% Two or more races 29% Hispanic / Latino 14% Asian 5% Black 3% Native American 3%
- Hispanic origin (detail)
- Mexican 7% Puerto Rican 2%
- Common ancestry
- Italian 1% Iranian 1% Slovak 1%
- Foreign-born
- 13% · Canada, Vietnam
- Languages at home
- 82% English-only · Spanish 11% Other Asian/Pacific 3% French/Haitian/Cajun 2%
Political lean MEDSL · Benton
- 2024 margin
- Strong R (+27.0) · D 35.2% · R 62.1% · Other 2.7%
- 2008→2024 swing
- +9.6pp toward D · 2008: -36.5pp · 2024: -27.0pp
- All cycles
- 2024: R+27.0 2020: R+26.4 2016: R+34.9 2012: R+40.4 2008: R+36.5
Not yet ingested
- Civics
- —
Market trends
- HPI YoY
- ▲ 57.29%
- Current HPI
- 428.7914
- Rent YoY
- —
- Metro
- —
- State GDP YoY
- ▲ 3.80%
- F500 in state
- 10
Industry mix (Fortune 500 HQ in AR)
| Industry | F500 HQs | Revenue |
|---|---|---|
| Retail | 1 | $681B |
|
||
| Food / Agriculture | 1 | $53B |
|
||
| Retail / Energy | 1 | $22B |
|
||
| Transportation / Logistics | 1 | $12B |
|
||
| Energy | 1 | $4B |
|
||
Price history
-5.9% since first listed2 events — show timeline
- 2026-05-13 Price Changed $270,000 FSBO.com
- 2026-05-12 Listed $287,000 FSBO.com
Property tax history
+12.4%/yrLatest (2025): $1,248 · +13.1% YoY. Source: county tax records.
Cash-flow waterfall
monthlySold comps — $/sqft
last 12 mo · ≤1 miLoading sold comps…