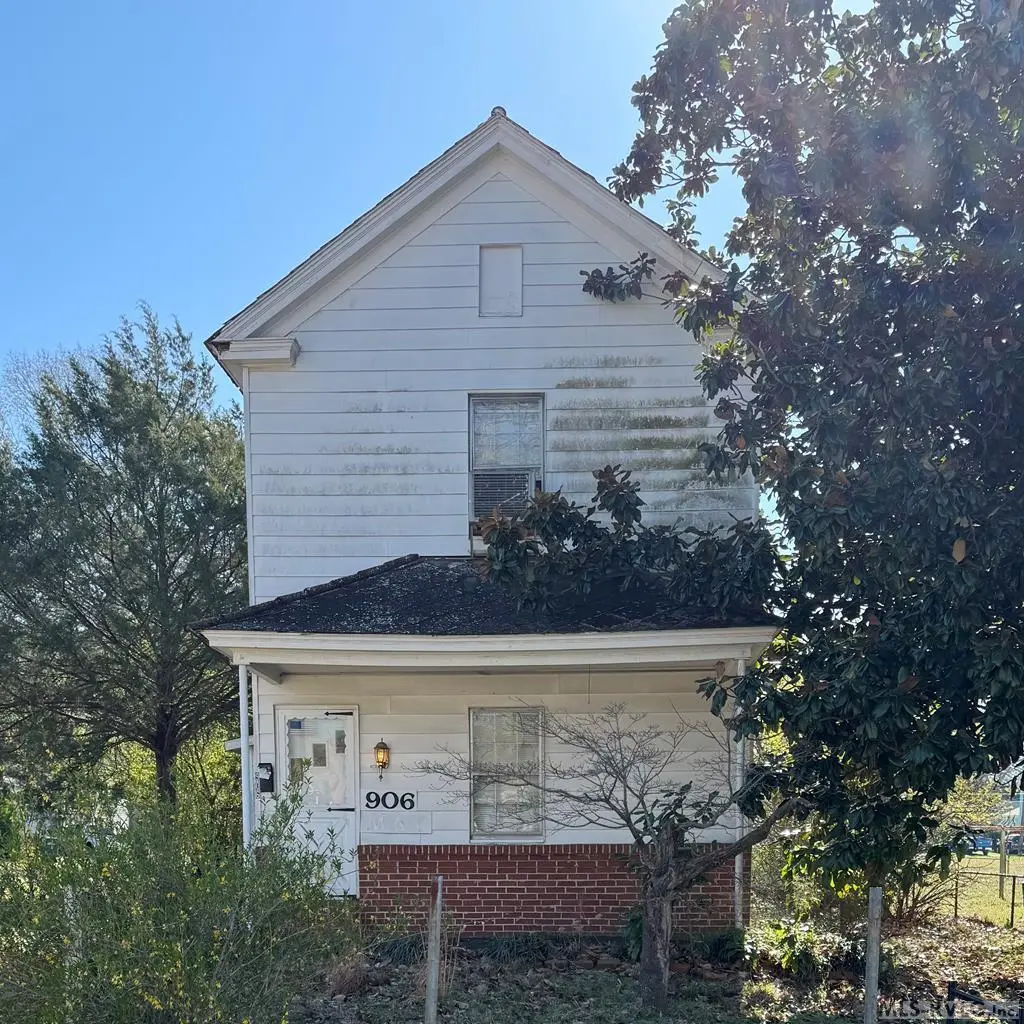
906 Rapids St · Roanoke Rapids, NC
Flood risk 1/10 · Minimal
- FEMA flood zone
- X (unshaded)
- Chance of flooding over 30 yrs
- 0.0%
- Est. flood insurance / yr
- $473 – $860
Fire risk 2/10 · Minimal
- Est. fire insurance / yr
- $906 – $1,684
Heat risk 7/10 · Major
- Hot days now (above 108°F)
- 7 days/yr
- Hot days in 30 yrs
- 16 days/yr
Wind risk 6/10 · Moderate
- Chance of severe wind over 30 yrs
- 64.0%
Air-quality risk 1/10 · Minimal
- Unhealthy air days now
- 0 days/yr
- Unhealthy air days in 30 yrs
- 0 days/yr
Risk factors via First Street. Map © Google.
Why this score? — see what drove the B- grade
The composite is a weighted blend of 9 inputs, each scored 0–100. Each bar is that input's sub-score; the figure is the points it added to the 100-point composite (weight × sub-score).
- Cash flow +30.0/30.0
- 1% rule +10.0/10.0
- DSCR +10.0/10.0
- ARV discount +7.5/15.0
- Schools +2.9/10.0
- Livability +2.8/5.0
- Rent growth +2.5/5.0
- Condition / age +2.5/5.0
- Appreciation +0.0/10.0
$32,500
🖨 Deal sheet 📄 Offer letter ✓ Due diligence
Listing remarks
3BR 1BA house in school district. Seller says enter the 2 bedrooms upstairs at your own risk(dead bats and bat feces). Medicaid will have to approve any offer. Lockbox on back door
Key facts
- 7,000 sq ft lot
- Built 1910
- Listed 62 days
Property features AI
Exterior
- Parking: No garage
- Utilities: Public water; Public sewer
- Home design: Residential property; Residential/Vacation subtype; Two levels
- Construction: Updated/remodeled construction
- Exterior features: Paved road access; Lot roughly 0.16 acres
Interior
- Kitchen: Electric oven; Electric range; Dishwasher
- Bedrooms: Total of 5 rooms (bedrooms included in room count)
- Bathrooms: 1 full bathroom
- Heating & cooling: No heating; No cooling
- Interior features: Updated/remodeled condition; Has a view; No fireplace
Neighborhood map
What this means for you Summary
Snapshot
- This is a 2-bed/1.0-bath single-family listed at $32k.
Deal economics
- At list price, monthly cash flow is $690 ($8k/yr) — positive.
- The deal already cash-flows at list — no discount required.
- Meets the 1% rule at list price ($1k rent vs $32k).
- Recommended offer: $31k (6.0% below list) — sets the bar for market timing.
- Cap rate 31.8% vs local median 4.1% in Roanoke Rapids — top-decile yield for the area; either an underpriced asset or a hidden risk that comps aren't pricing in. Stress-test before assuming the spread holds.
Location & tenants
- Location reads 56/100 on livability (#631 in NC) — a working-class tenant base; expect higher turnover. Strengths: cost of living A+, health & safety A, housing B+; Watch: crime F, amenities F, commute F.
- Roanoke Rapids City Schools (town): math 31% / reading 37% proficiency, ranked #135 of 178 in NC (top 76%) — families likely to look elsewhere, expect single-tenant / working-renter base with shorter leases.
- Zoned schools: Belmont Elementary School (math 22% / reading 26%, grade F, #1,153 of 1,410 statewide, top 82%, 595 students, 100% FRL); Chaloner Middle School (math 31% / reading 40%, grade F, #279 of 475 statewide, top 60%, 616 students, 100% FRL); Roanoke Rapids High School (math 52% / reading 37%, grade F, #352 of 535 statewide, top 68%, 783 students, 100% FRL) — zoned schools average 100% FRL vs 53% district-wide (46 pts higher); higher-poverty schools than district average — tighter screening recommended.
- Market conditions: 143 active listings in the ZIP; 4 comparable units currently listed for rent nearby; rentals lingering (median 44d on market — plan ~5-8 weeks vacancy on turnover, expect pricing pressure); 100% of comp listings sitting > 30 days — soft ceiling on asking rent; 55 units permitted in Halifax County in 2024 (0 in 5+ unit buildings).
Forward outlook
- Local home prices are declining (-3.0%/yr); year-one equity from $225 of loan paydown is wiped out by about $975 of value loss. Plan a longer hold.
- Halifax County population projected at -27% by 2050 — secular population decline; favor cash flow + early exit over multi-decade hold.
- At projected returns (-3.0% appreciation + 3.0% rent growth), your $9k cash investment doubles in ~2 years — after that, you're playing with house money.
Negotiation context
- It's been on market 62 days — a 6% lower offer ($31k) is reasonable based on typical stale-listing flexibility.
Risks & watch-outs
- Watch-outs: built in 1910 — expect roof / HVAC / electrical / plumbing capex.
- Climate carrying-cost: major wind risk, 64% chance of damaging wind over 30y; extreme-heat days projected 7→16/yr by 2055 (HVAC capex compounding) — expect insurance premiums to compound above CPI over the hold.
Questions for the listing agent
- It's been on market 62 days. Have you received any prior offers? Is the seller open to a 6% concession, seller financing, or rate buy-down credit?
- Built in 1910 — when were the roof, HVAC, electrical panel, plumbing, and water heater last replaced?
- Why hasn't it sold? Are there any deal-killer items the seller is aware of (foundation, flood, title, zoning, code violations)?
- Is there a deadline driving the sale (1031 exchange, divorce, estate, relocation)? That informs how much negotiation room exists.
- Schools are F-rated, which usually means shorter tenancies and higher turnover. Who's the typical renter profile here, and what's been the actual vacancy rate?
- Crime grade is F in this area — have there been break-ins, vandalism, or insurance claims at this property in the last 3 years? What carrier currently insures it and at what premium?
- What's the average days-on-market for RENTAL listings here right now (not sales)? A rising rental-DOM trend means longer vacancies and softer asking-rent achievability than the comps imply.
- What's the recent tenant-quality profile in this submarket — average credit score on applications, eviction rate, late-payment / NSF rate, and stable-employment percentage? A property-management company in the area should have these aggregated.
- How much new for-sale + rental construction is in the pipeline within 1–3 miles? Heavy new supply typically softens prices + rents 12–24 months out; constrained supply supports both.
Investment metrics
- 1% rule
- 3.64% ✓
- Cap rate
- 31.76%
- Cash-on-cash
- 90.96%
- DSCR
- 5.05
- GRM
- 2.3
CMA / ARV
- ARV (on-the-fly)
- $203,472
- Comps found
- 4
Show comp detail 4 sales within ~0.75 mi
| Address | Dist | Beds/Ba | Sqft | Sold | Price | $/sf | Match |
|---|---|---|---|---|---|---|---|
| 931 Wilson St | 0.11mi | 3/1.5 (+1) | 1,196 (-8%) | 15mo | $140,000 | $117 | 63 |
| 602 Cleveland St | 0.39mi | 3/2.0 (+1) | 1,402 (+8%) | 2mo | $219,500 | $157 | 58 |
| 414 Monroe St | 0.69mi | 2/2.0 | 1,190 (-8%) | 3mo | $60,000 | $50 | 48 |
| 521 Pinecrest Ave | 0.74mi | 3/2.0 (+1) | 1,280 (-1%) | 9mo | $215,000 | $168 | 47 |
Match score weights: distance 35% · size 25% · config 20% · recency 20%. Top-matched comps best support the ARV.
Projected returns pro-forma
-3.0% appreciation · 3.0% rent growth · sell at horizon
- IRR
- 91.7%
- Equity multiple
- 5.25×
- Total profit
- $38,696
- Equity at exit
- $4,846
- IRR
- 94.6%
- Equity multiple
- 10.93×
- Total profit
- $90,390
- Equity at exit
- $2,810
Cash invested: $9,100 (down + closing). Projections, not guarantees.
Landlord ↔ Tenant lean methodology
- Overall (STATE)
- 85 Strongly Landlord-Friendly
- State North Carolina
- 85 Strongly Landlord-Friendly · R+3
- County
- — inherits STATE
- City
- — inherits STATE
ZIP-level market 27870
- Home prices YoY
- -21.1%
- Active inventory
- 143
- Price-to-rent
- 2.3×
Monthly cashflow live
- Estimated rent
- $1,184 medium interval (Pro) →
- Mortgage (P&I)
- −$170
- Tax from tax record
- −$62 /mo · $743/yr
- Insurance
- −$14
- HOA
- −$0
- Vacancy / Maint / Mgmt
- −$249
- Net cashflow
- $690
Break-even live
UW: 25.0% down · 7.5% · 30yr · 1.5% tax · 5.0% vac · 8.0% maint · 8.0% mgmt
Financing live
Cash to close
- Down payment
- $8,125
- Closing costs
- $975
- Reserves months
- —
- Total cash needed
- —
Loan-product check · same deal, 3 products live
Conventional
25% down · 7.5% · 30yr
- Down + closing
- —
- Monthly P&I
- —
- Monthly cashflow
- —
- DSCR
- —
- Eligible?
- —
Personal DTI + credit; lowest rate.
DSCR
20% down · 8.5% · 30yr
- Down + closing
- —
- Monthly P&I
- —
- Monthly cashflow
- —
- DSCR
- —
- Eligible?
- —
No personal income docs; deal must DSCR.
Hard money
10% down · 12.0% · 12mo
- Down + closing
- —
- Monthly P&I
- —
- Monthly cashflow
- —
- DSCR
- —
- Eligible?
- —
Short-term bridge; refi at stabilization.
Rent comps 4 comps
| Address | Beds | Baths | Sqft | Rent | $/sqft | DOM | Units | Dist |
|---|---|---|---|---|---|---|---|---|
| 1028 Cleveland St Roanoke Rapids, NC | 3.0 | 1.5 | 1302 | $1,450 | $1.11 | 43d | 1 | 0.25mi |
| 101 Washington St Roanoke Rapids, NC | 2.0 | 1.0 | 1212 | $900 | $0.74 | 43d | 1 | 1.21mi |
| 236 E Littleton Rd Roanoke Rapids, NC | 2.0–3.0 | 1.0–2.0 | 1021 | $803 | $0.79 | 43d | 10 | 1.34mi |
| 1215 Carolina Ave Roanoke Rapids, NC | 2.0 | 2.0 | 1465 | $1,200 | $0.82 | 43d | 1 | 1.37mi |
Listing history 2 events
-
2026-05-21status Pending
-
2026-03-21$32,500 Active
ⓘ Source: listings_history table (triggers on properties + properties_extension) + one-shot
backfill from property_details.listing_events for pre-trigger history.
Tax reassessment forecast NC · Resets to sale price
- Current annual tax
- $743 · $62/mo
- Projected year-2 tax
- $743 · $62/mo
- Expected delta
- $0/yr ($0/mo · 0.0%)
ⓘ Screening estimate from a state-policy table — verify with the county assessor before closing.
Climate risk First Street
- Flood 1/10 Low FEMA zone X (unshaded) · 0% chance over 30 yrs
- Wildfire 2/10 Low
- Heat 7/10 Severe 7 d/yr ≥108°F today · 16 d/yr by 30 yrs out
- Wind 6/10 Major 64% chance of damaging wind over 30 yrs
- Air quality 1/10 Low 0 unhealthy d/yr today · 0 by 30 yrs out
Nearby sold comps map
Loading sold comps map…
Walkable amenities ~0.75 mi
Loading nearby amenities…
Taxation est. · year 1
- Rental income
- $14,213
- − Mortgage interest
- −$1,821
- − Property taxes
- −$743
- − Insurance
- −$162
- − Repairs & maintenance
- −$1,137
- − Management
- −$1,137
- − Depreciation
- −$945
- Taxable income
- $8,267
- Est. tax owed @ 24.0%
- −$1,984
- After-tax cash flow
- $6,293/yr
For passive investors: Depreciation is non-cash, so a rental often shows a tax loss while cash-flowing — sheltering income. Rental losses are passive: they offset passive income freely, and up to $25,000/yr can offset ordinary (W-2) income if you actively participate and your MAGI is under $100k (phasing out to $0 by $150k); unused losses carry forward. On sale, claimed depreciation is recaptured at up to 25%, and gains may owe capital-gains tax (a 1031 exchange can defer both). Figures are a year-1 estimate at your 24.0% rate — not tax advice; consult a CPA.
Schools (NCES district)
- District
- Roanoke Rapids City Schools
- NCES district ID
- 3703900
- Math proficiency
- 31% ▼ -8.00%
- Reading proficiency
- 37% ▲ 1.00%
- Median HH income
- $41,604
- Composite
- 28.7/100
- National rank
- #6689
- State rank
- #135 of 178 in NC
Livability — Roanoke Rapids
- Score
- 56/100
- State rank
- #631
- US rank
- #22900
Category grades
Schools grade is shown separately in the Schools card above.
Census & demographics
- Census place
- Roanoke Rapids, NC
- County
- Halifax County · 24,958 people
- City population
- 24,958
- Metro
- Roanoke Rapids, NC
- Population (ZIP)
- 24,958
- Household income
- $49,502
- Rent vs Own
- Severe rent burden
- 822.0
Population outlook (Halifax County) Hauer SSP2
- Today (2025)
- 47,976 people
- By 2030
- 45,450 · -5.3%
- By 2040
- 39,980 · -16.7%
- By 2050
- 34,863 · -27.3%
- By 2075
- 25,577 · -46.7%
- By 2100
- 18,365 · -61.7%
Race, ethnicity, and origin ACS 2023
- Neighborhood character
- Diverse neighborhood (Simpson 0.61)
- Race & ethnicity
- White 47% Black 40% Two or more races 7% Hispanic / Latino 5% Asian 1%
- Common ancestry
- Slovak 1% Italian 1% Serbian 1%
- Foreign-born
- 3% · Canada, Vietnam
- Languages at home
- 94% English-only · Spanish 4% Other Asian/Pacific 1%
Political lean MEDSL · Halifax
- 2024 margin
- D (+17.7) · D 58.5% · R 40.9%
- 2008→2024 swing
- -10.6pp toward R · 2008: 28.2pp · 2024: 17.7pp
- All cycles
- 2024: D+17.7 2020: D+21.2 2016: D+26.9 2012: D+32.0 2008: D+28.2
Not yet ingested
- Civics
- —
Market trends
- HPI YoY
- ▼ -47.78%
- Current HPI
- 179.1705
- Rent YoY
- —
- Metro
- Roanoke Rapids, NC
- State GDP YoY
- ▲ 3.28%
- F500 in state
- 26
Industry mix (Fortune 500 HQ in NC)
| Industry | F500 HQs | Revenue |
|---|---|---|
| Financial Services | 2 | $213B |
|
||
| Retail | 2 | $95B |
|
||
| Industrial Conglomerate | 1 | $38B |
|
||
| Metals / Steel | 1 | $35B |
|
||
| Utilities | 1 | $30B |
|
||
| Industrial Machinery | 1 | $19B |
|
||
Price history
2 events — show timeline
- 2026-05-21 Pending — RVLG
- 2026-03-21 Listed $32,500 RVLG
Property tax history
+7.7%/yrLatest (2024): $743 · +7.5% YoY. Source: county tax records.
Cash-flow waterfall
monthlySold comps — $/sqft
last 12 mo · ≤1 miLoading sold comps…