 Duplex
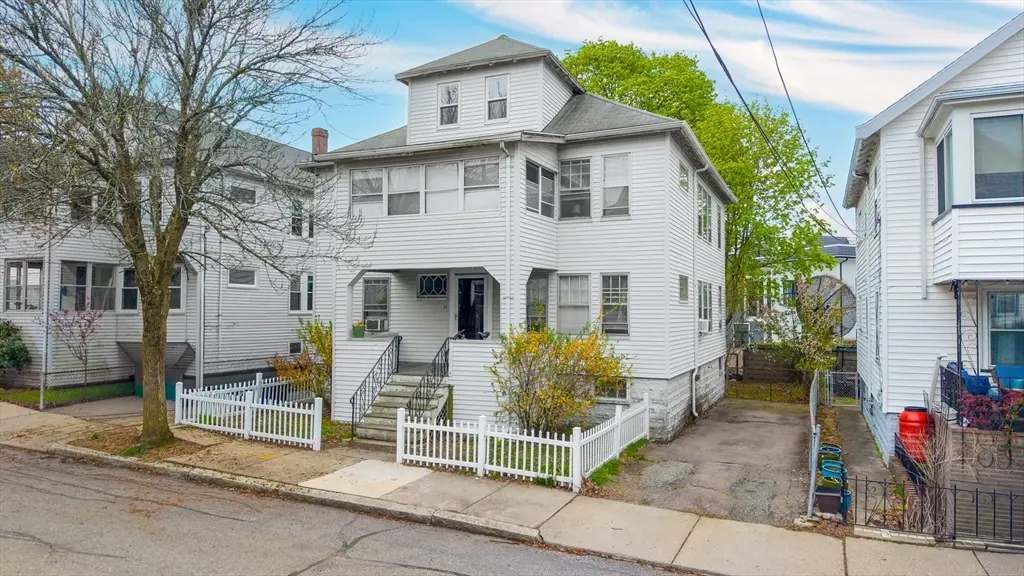
52 Sterling St · Somerville, MA
Flood risk 1/10 · Minimal
- FEMA flood zone
- X (unshaded)
- Chance of flooding over 30 yrs
- 0.0%
- Est. flood insurance / yr
- $473 – $860
Fire risk 1/10 · Minimal
- Est. fire insurance / yr
- $915 – $1,699
Heat risk 6/10 · Moderate
- Hot days now (above 97°F)
- 7 days/yr
- Hot days in 30 yrs
- 15 days/yr
Wind risk 6/10 · Moderate
- Chance of severe wind over 30 yrs
- 58.0%
Air-quality risk 3/10 · Minor
- Unhealthy air days now
- 3 days/yr
- Unhealthy air days in 30 yrs
- 3 days/yr
Risk factors via First Street. Map © Google.
Why this score? — see what drove the D grade
The composite is a weighted blend of 9 inputs, each scored 0–100. Each bar is that input's sub-score; the figure is the points it added to the 100-point composite (weight × sub-score).
- ARV discount +11.8/15.0
- Cash flow +7.2/30.0
- Appreciation +7.0/10.0
- Livability +4.2/5.0
- Rent growth +3.5/5.0
- Schools +3.2/10.0
- Condition / age +2.5/5.0
- 1% rule +1.4/10.0
- DSCR +1.3/10.0
$1,075,000
🖨 Deal sheet (PDF) 📄 Offer letter ✓ Due diligence
Multi-family units
County records classify this as Multi-Family (2-4 Unit). Listing-text estimate: 2 units. confirmed
Listing remarks
INQUIRE REGARDING TOUR THIS SUNDAY AFTERNOON. This 2-family has been thoughtfully maintained by the same family since the 1950s. Each unit offers 1,100+ SF with a living room, dining room, 2 bedrooms, and hardwood floors throughout both living areas. A full ~1,000 SF unfinished attic creates a clear path to townhouse-style expansion for the upstairs unit. When not in use by the family over the years, the home has a strong rental history and both units are currently rented. Separate gas, electric, and utilities with a coin-op laundry in the basement. The house rear has upper and lower private deck areas, which overlook the backyard area. Easy access to RT 16 + RT 2, close to Davis Square, Wh
Key facts
- Private deck areas
- Unfinished attic
- Coin-op laundry
Tags
Property features AI
Finance
- Other: Property is active; Total building area 2,112 (above grade finished area)
- HOA & community: Not a senior community
Exterior
- Parking: Open parking for 3 cars; Paved driveway; Off-street parking; Tandem parking
- Utilities: Public water; Public sewer; Electric with circuit breakers and individually metered units
- Home design: 2-family, up/down configuration; 3 stories; 3 total levels
- Construction: Frame construction; Block foundation; Shingle roof; Built (year per public records)
- Exterior features: Porch; Balcony; Level lot; Public road frontage
Interior
- Kitchen: Range; Dishwasher; Refrigerator
- Flooring: Hardwood
- Bathrooms: 2 full bathrooms
- Heating & cooling: Steam heat
- Interior features: Living room; Dining room; Kitchen; 10 total rooms
Neighborhood map
What this means for you Summary
Snapshot
- This is a 2 × 2-bed/1.0-bath units multifamily listed at $1.07M.
Deal economics
- At list price, monthly cash flow is $-1k ($-18k/yr) — negative. Per door: $-750/mo.
- To cash-flow at today's rent, offer at most $810k (24.6% below list).
- To meet the 1% rule (rent ≥ 1% of price), the offer needs to be $688k (36.0% below list).
- Recommended offer: $688k (36.0% below list) — sets the bar for 1% rule.
- Cap rate 4.6% vs local median 2.2% in Somerville — top-decile yield for the area; either an underpriced asset or a hidden risk that comps aren't pricing in. Stress-test before assuming the spread holds.
Location & tenants
- Location reads 84/100 on livability (#18 in MA, #752 nationally) — a professional / high-income tenant draw. Strengths: amenities A+, commute A+, employment A+; Watch: cost of living F.
- Somerville (suburban): math 26% / reading 43% proficiency, ranked #223 of 302 in MA (top 74%) — families likely to look elsewhere, expect single-tenant / working-renter base with shorter leases.
- Market conditions: Rents rising fast (+4.2%/yr); 52 active listings in the ZIP; 40 comparable units currently listed for rent nearby; rentals at typical pace (median 25d on market — plan ~3-4 weeks tenant-placement turnaround); high-income renter base; 3,670 units permitted in Middlesex County in 2024 (2,611 in 5+ unit buildings).
- At $6,880/mo this rent would consume 55% of the median local household income ($150k/yr) (locally 1177% of renters already pay >50% of income on rent) — very limited rent-growth headroom before tenants either downsize or default.
Forward outlook
- In year one you build about $49k of equity ($7k loan paydown + $42k appreciation (3.9% local appreciation)).
- Middlesex County population projected at +20% by 2050 — long-run rental-demand tailwind backs the buy-and-hold thesis.
- By year 2, paydown + projected appreciation supports a ~$80k cash-out refi (75% LTV) — recoverable capital for the next deal without selling this one.
Negotiation context
- It's been on market 44 days — a 3% lower offer ($1.04M) is reasonable based on typical stale-listing flexibility.
- Current owner paid $170k; list at $1.07M implies a 532% gain — meaningful room to come down on a strong offer.
Risks & watch-outs
- Watch-outs: built in 1920 — expect roof / HVAC / electrical / plumbing capex.
- Climate carrying-cost: major wind risk, 58% chance of damaging wind over 30y; extreme-heat days projected 7→15/yr by 2055 (HVAC capex compounding) — expect insurance premiums to compound above CPI over the hold.
Questions for the listing agent
- What do current leases actually rent for vs. the listed asking? Can we see a recent rent roll and the last 12 months of T-12 income?
- It's been on market 44 days. Have you received any prior offers? Is the seller open to a 36% concession, seller financing, or rate buy-down credit?
- Can we see the unit-by-unit rent roll, current vacancy, and any below-market leases? What's the average tenancy length?
- What capital expenditures (roof, boiler, parking lot, exteriors) have been made in the last 5 years, and what's planned in the next 2?
- Built in 1920 — when were the roof, HVAC, electrical panel, plumbing, and water heater last replaced?
- Is there a deadline driving the sale (1031 exchange, divorce, estate, relocation)? That informs how much negotiation room exists.
- Schools are B-rated — typically a magnet for longer-tenancy family renters. What's the average tenant stay here, and is there a school-zone premium baked into asking?
- The area grade is low — what's the realistic commute time and amenity access for the typical tenant pool here? Any planned neighborhood developments (good or bad) we should know about?
- What's the average days-on-market for RENTAL listings here right now (not sales)? A rising rental-DOM trend means longer vacancies and softer asking-rent achievability than the comps imply.
- What's the recent tenant-quality profile in this submarket — average credit score on applications, eviction rate, late-payment / NSF rate, and stable-employment percentage? A property-management company in the area should have these aggregated.
- How much new apartment / multifamily construction is in the pipeline within 1–3 miles? Heavy new supply (>2% of stock underway) typically softens rents 12–24 months out; light construction supports rent growth.
Investment metrics
- 1% rule
- 0.64% ✗
- Cap rate
- 4.62%
- Cash-on-cash
- -5.98%
- DSCR
- 0.73
- GRM
- 13.0
CMA / ARV
- ARV (median comp)
- $1,189,708
- List price
- $1,075,000
- Delta
- -9.64%
- Verdict
- FAIR
- Comps
- 20 within 1.0 mi
Show comp detail 12 sales within ~0.75 mi
| Address | Dist | Beds/Ba | Sqft | Sold | Price | $/sf | Match |
|---|---|---|---|---|---|---|---|
| 16 Hamilton Rd | 0.30mi | 4/2.0 | 2,210 (+5%) | 5mo | $1,015,000 | $459 | 74 |
| 62-64 Waldo Rd | 0.50mi | 4/2.0 | 2,116 (+0%) | 7mo | $1,075,000 | $508 | 71 |
| 114 Capen St | 0.19mi | 4/2.0 | 2,288 (+8%) | 9mo | $850,000 | $372 | 70 |
| 86 Quincy St | 0.17mi | 4/2.0 | 2,346 (+11%) | 12mo | $935,000 | $399 | 64 |
| 15 Quincy St | 0.27mi | 5/2.0 (+1) | 2,210 (+5%) | 15mo | $1,212,000 | $548 | 63 |
| 32-34 Pinkham Rd | 0.24mi | 5/3.0 (+1) | 2,280 (+8%) | 5mo | $1,050,000 | $461 | 62 |
| 281 Alewife Brook Pkwy | 0.16mi | 5/2.0 (+1) | 2,350 (+11%) | 9mo | $1,175,000 | $500 | 61 |
| 8-10 Bowdoin St | 0.60mi | 4/2.0 | 2,150 (+2%) | 14mo | $1,300,000 | $605 | 57 |
| 78 Everett St | 0.62mi | 4/2.0 | 2,240 (+6%) | 8mo | $1,300,000 | $580 | 54 |
| 12-14 Quincy St | 0.29mi | 5/2.0 (+1) | 2,336 (+11%) | 12mo | $1,120,000 | $479 | 54 |
| 14 Moore St | 0.65mi | 4/3.0 | 2,354 (+12%) | 7mo | $1,230,000 | $523 | 40 |
| 60 Auburn St | 0.57mi | 4/2.0 | 2,410 (+14%) | 13mo | $1,298,000 | $539 | 39 |
Match score weights: distance 35% · size 25% · config 20% · recency 20%. Top-matched comps best support the ARV.
Projected returns pro-forma
3.9% appreciation · 4.15% rent growth · sell at horizon
- IRR
- 5.1%
- Equity multiple
- 1.31×
- Total profit
- $94,130
- Equity at exit
- $538,973
- IRR
- 8.2%
- Equity multiple
- 2.39×
- Total profit
- $418,803
- Equity at exit
- $876,729
Cash invested: $301,000 (down + closing). Projections, not guarantees.
Landlord ↔ Tenant lean methodology
- Overall (STATE)
- 20 Strongly Tenant-Friendly
- State Massachusetts
- 20 Strongly Tenant-Friendly · D+15
- County
- — inherits STATE
- City
- — inherits STATE
ZIP-level market 02144
- Home prices YoY
- 1.0%
- Rents YoY
- 4.2%
- Active inventory
- 52
- Price-to-rent
- 26.0×
Monthly cashflow live
- Estimated rent
- $6,880 high interval (Pro) →
- Mortgage (P&I)
- −$5,637
- Tax from tax record
- −$849 /mo · $10,190/yr
- Insurance
- −$448
- HOA
- −$0
- Vacancy / Maint / Mgmt
- −$1,445
- Net cashflow
- $-1,499
Break-even live
Sensitivity live
| Price | -10% $-891 | -5% $-1,195 | +0% $-1,499 | +5% $-1,804 | +10% $-2,108 |
|---|---|---|---|---|---|
| Rent | -10% $-2,043 | -5% $-1,771 | +0% $-1,499 | +5% $-1,228 | +10% $-956 |
| Rate | -1.0pp $-958 | -0.5pp $-1,226 | base $-1,499 | +0.5pp $-1,778 | +1.0pp $-2,061 |
2-unit breakdown (identical units grouped — click to expand)
| Units | Beds | Baths | Est. rent |
|---|---|---|---|
| 2× units | 2 | 1 | $6,880 |
| #1 | 2 | 1 | $3,440 |
| #2 | 2 | 1 | $3,440 |
| Total (2 units) | $6,880 | ||
UW: 25.0% down · 7.5% · 30yr · 1.5% tax · 5.0% vac · 8.0% maint · 8.0% mgmt
Financing live
Cash to close
- Down payment
- $268,750
- Closing costs
- $32,250
- Reserves months
- —
- Total cash needed
- —
Loan-product check · same deal, 3 products live
Conventional
25% down · 7.5% · 30yr
- Down + closing
- —
- Monthly P&I
- —
- Monthly cashflow
- —
- DSCR
- —
- Eligible?
- —
Personal DTI + credit; lowest rate.
DSCR
20% down · 8.5% · 30yr
- Down + closing
- —
- Monthly P&I
- —
- Monthly cashflow
- —
- DSCR
- —
- Eligible?
- —
No personal income docs; deal must DSCR.
Hard money
10% down · 12.0% · 12mo
- Down + closing
- —
- Monthly P&I
- —
- Monthly cashflow
- —
- DSCR
- —
- Eligible?
- —
Short-term bridge; refi at stabilization.
Rent comps 40 comps
| Address | Beds | Baths | Sqft | Rent | $/sqft | DOM | Units | Dist |
|---|---|---|---|---|---|---|---|---|
| 38 Sterling St Somerville, MA | 4.0 | 2.0 | 1800 | $4,500 | $2.50 | 15d | 1 | 0.01mi |
| 37 Sterling St #2 Somerville, MA | 5.0 | 2.0 | 2700 | $4,750 | $1.76 | 17d | 1 | 0.03mi |
| 37 Sterling St Somerville, MA | 5.0 | 2.0 | 2000 | $4,950 | $2.48 | 44d | 1 | 0.03mi |
| 190 North St Somerville, MA | 5.0 | 2.0 | 1700 | $4,950 | $2.91 | 19d | 1 | 0.14mi |
| 138 W Adams St Somerville, MA | 4.0 | 2.0 | 1700 | $3,950 | $2.32 | 4d | 1 | 0.21mi |
| 142 W Adams St Somerville, MA | 5.0 | 2.0 | 2000 | $6,500 | $3.25 | 17d | 1 | 0.22mi |
| 65 Conwell Ave Unit 1 Somerville, MA | 5.0 | 2.0 | 1500 | $5,500 | $3.67 | 44d | 1 | 0.24mi |
| 49 Sunset Rd Unit 49 West Somerville, MA | 4.0 | 2.0 | 1610 | $3,900 | $2.42 | 19d | 1 | 0.26mi |
| 33 Chetwynd Rd #2 Somerville, MA | 4.0 | 1.0 | 2016 | $4,390 | $2.18 | 44d | 1 | 0.29mi |
| 275 Boston Ave Medford, MA | 3.0 | 2.5 | 1550 | $3,600 | $2.32 | 44d | 1 | 0.32mi |
| 275 Boston Ave Medford, MA | 3.0 | 2.5 | 1550 | $3,600 | $2.32 | 25d | 1 | 0.32mi |
| 16 Curtis Ave Somerville, MA | 5.0 | 2.0 | 1600 | $6,000 | $3.75 | 44d | 1 | 0.34mi |
| 14 Curtis Ave Somerville, MA | 5.0 | 2.0 | 1600 | $6,000 | $3.75 | 44d | 1 | 0.34mi |
| 29 Belknap St Somerville, MA | 4.0 | 2.0 | 1500 | $4,400 | $2.93 | 44d | 1 | 0.36mi |
| 157 Boston Ave #1 Somerville, MA | 4.0 | 3.0 | 1865 | $5,950 | $3.19 | 25d | 1 | 0.36mi |
| 44 Orchard St Medford, MA | 4.0 | 1.0 | 1600 | $4,600 | $2.88 | 21d | 1 | 0.41mi |
| 44 Orchard St Unit 2 Medford, MA | 4.0 | 1.0 | 1500 | $4,000 | $2.67 | 18d | 1 | 0.41mi |
| 7 Dickson St Unit 1 Somerville, MA | 5.0 | 3.0 | 2000 | $7,000 | $3.50 | 44d | 1 | 0.48mi |
| 15 Taylor St Medford, MA | 4.0 | 2.0 | 1400 | $3,900 | $2.79 | 18d | 1 | 0.50mi |
| 110 Sharon St Medford, MA | 3.0 | 1.0 | 1400 | $3,200 | $2.29 | 44d | 1 | 0.55mi |
| 133 Winthrop St Medford, MA | 5.0 | 2.0 | 2084 | $5,800 | $2.78 | 11d | 1 | 0.60mi |
| 1108 Broadway Somerville, MA | 3.0 | 2.0 | 1901 | $5,001 | $2.63 | 44d | 1 | 0.60mi |
| 26 Marathon St Arlington, MA | 4.0 | 2.0 | 2000 | $4,400 | $2.20 | 25d | 1 | 0.62mi |
| 5 Claremon St Somerville, MA | 5.0 | 2.0 | 2000 | $5,200 | $2.60 | 25d | 1 | 0.66mi |
| 63 Foster St Unit 63 Arlington, MA | 4.0 | 2.0 | 1400 | $4,000 | $2.86 | 13d | 1 | 0.75mi |
| 34 Leonard St Unit 2 Somerville, MA | 3.0 | 1.0 | 1500 | $4,500 | $3.00 | 6d | 1 | 0.78mi |
| 216 Broadway Unit 2 Arlington, MA | 5.0 | 2.0 | 1500 | $4,800 | $3.20 | 25d | 1 | 0.79mi |
| 195 College Ave Somerville, MA | 5.0 | 1.0 | 1600 | $6,500 | $4.06 | 44d | 1 | 0.83mi |
| 25 Simpson Ave Somerville, MA | 4.0 | 2.0 | 1800 | $5,200 | $2.89 | 44d | 1 | 0.84mi |
| 585 High St Apt 2 Medford, MA | 3.0 | 1.0 | 2100 | $3,800 | $1.81 | 18d | 1 | 0.84mi |
| 942 Broadway Somerville, MA | 4.0 | 2.0 | 1400 | $4,500 | $3.21 | 44d | 1 | 0.85mi |
| 942 Broadway Somerville, MA | 4.0 | 2.0 | 1400 | $4,400 | $3.14 | 0d | 1 | 0.85mi |
| 19 Adams St Unit 2 Arlington, MA | 4.0 | 2.0 | 1500 | $4,000 | $2.67 | 6d | 1 | 0.85mi |
| 61 Warren St Unit 2 Medford, MA | 4.0 | 3.0 | 3000 | $6,000 | $2.00 | 6d | 1 | 0.88mi |
| 71 Stanley Ave Medford, MA | 5.0 | 5.5 | 2103 | $6,995 | $3.33 | 44d | 1 | 0.89mi |
| 70 Stanley Ave Unit 70 Medford, MA | 5.0 | 5.5 | 2103 | $7,500 | $3.57 | 6d | 1 | 0.90mi |
| 70 Stanley Ave Medford, MA | 5.0 | 5.5 | 2103 | $6,995 | $3.33 | 44d | 1 | 0.90mi |
| 1 Whittemore Ave Cambridge, MA | 1.0–4.0 | 1.0–3.5 | 1234 | $6,292 | $5.10 | 0d | 8 | 0.90mi |
| 47 Summer St Medford, MA | 4.0 | 1.0 | 1500 | $3,800 | $2.53 | 25d | 1 | 0.91mi |
| 17 Gorham Rd Unit 2 Medford, MA | 3.0 | 1.5 | 1739 | $3,500 | $2.01 | 4d | 1 | 0.91mi |
Listing history 17 events
-
2026-06-21days on market $1,075,000 Active 44 DOM
-
2026-06-18days on market $1,075,000 Active 41 DOM
-
2026-06-17days on market $1,075,000 Active 40 DOM
-
2026-06-16days on market $1,075,000 Active 39 DOM
-
2026-06-15days on market $1,075,000 Active 38 DOM
-
2026-06-13days on market $1,075,000 Active 36 DOM
-
2026-06-13days on market $1,075,000 Active 35 DOM
-
2026-06-09days on market $1,075,000 Active 32 DOM
-
2026-06-08days on market $1,075,000 Active 31 DOM
-
2026-06-07days on market $1,075,000 Active 30 DOM
-
2026-06-04days on market $1,075,000 Active 27 DOM
-
2026-06-03days on market $1,075,000 Active 26 DOM
-
2026-06-02days on market $1,075,000 Active 25 DOM
-
2026-06-01statusdays on market $1,075,000 Active 24 DOM
-
2026-05-31days on market $1,075,000 Price Changed 23 DOM
-
2026-05-08$1,119,999 New 996-char remark
-
1997-01-02soldstatus $170,000
ⓘ Source: listings_history table (triggers on properties + properties_extension) + one-shot
backfill from property_details.listing_events for pre-trigger history.
Tax reassessment forecast MA · Partial reset (capped growth)
- Current annual tax
- $10,190 · $849/mo
- Projected year-2 tax
- $11,706 · $976/mo
- Expected delta
- +$1,516/yr (+$126/mo · 14.9%)
ⓘ Screening estimate from a state-policy table — verify with the county assessor before closing.
Climate risk First Street
- Flood 1/10 Low FEMA zone X (unshaded) · 0% chance over 30 yrs
- Wildfire 1/10 Low
- Heat 6/10 Major 7 d/yr ≥97°F today · 15 d/yr by 30 yrs out
- Wind 6/10 Major 58% chance of damaging wind over 30 yrs
- Air quality 3/10 Moderate 3 unhealthy d/yr today · 3 by 30 yrs out
Nearby sold comps map
Loading sold comps map…
Walkable amenities ~0.75 mi
Loading nearby amenities…
Taxation est. · year 1
- Rental income
- $82,560
- − Mortgage interest
- −$60,217
- − Property taxes
- −$10,190
- − Insurance
- −$5,375
- − Repairs & maintenance
- −$6,605
- − Management
- −$6,605
- − Depreciation
- −$31,273
- Taxable loss
- −$37,704
- Est. tax savings @ 24.0%
- +$9,049
- After-tax cash flow
- $-8,943/yr
For passive investors: Depreciation is non-cash, so a rental often shows a tax loss while cash-flowing — sheltering income. Rental losses are passive: they offset passive income freely, and up to $25,000/yr can offset ordinary (W-2) income if you actively participate and your MAGI is under $100k (phasing out to $0 by $150k); unused losses carry forward. On sale, claimed depreciation is recaptured at up to 25%, and gains may owe capital-gains tax (a 1031 exchange can defer both). Figures are a year-1 estimate at your 24.0% rate — not tax advice; consult a CPA.
Schools (NCES district)
- District
- Somerville
- NCES district ID
- 2510890
- Math proficiency
- 26% ▼ -18.00%
- Reading proficiency
- 43% ▼ -6.00%
- Median HH income
- $71,304
- Composite
- 31.9/100
- National rank
- #5858
- State rank
- #223 of 302 in MA
Livability — Somerville
- Score
- 84/100
- State rank
- #18
- US rank
- #752
Category grades
Schools grade is shown separately in the Schools card above.
Census & demographics
- Census place
- Somerville, MA
- County
- Middlesex County · 1,437,704 people
- City population
- 78,456
- Metro
- Boston-Cambridge-Newton, MA-NH
- Population (ZIP)
- 25,448
- Household income
- $150,313
- Rent vs Own
- Severe rent burden
- 1177.0
Population outlook (Middlesex County) Hauer SSP2
- Today (2025)
- 1,740,269 people
- By 2030
- 1,817,187 · +4.4%
- By 2040
- 1,963,195 · +12.8%
- By 2050
- 2,087,461 · +20.0%
- By 2075
- 2,344,036 · +34.7%
- By 2100
- 2,383,776 · +37.0%
Race, ethnicity, and origin ACS 2023
- Neighborhood character
- Predominantly White (72%)
- Race & ethnicity
- White 72% Asian 11% Two or more races 10% Hispanic / Latino 8% Black 3%
- Hispanic origin (detail)
- Mexican 2% Puerto Rican 1%
- Common ancestry
- Russian 5% Romanian 4% Lithuanian 2%
- Foreign-born
- 17% · Canada, China, South Korea
- Languages at home
- 79% English-only · Other Indo-European 7% Spanish 4% Chinese 2%
Political lean MEDSL · Middlesex
- 2024 margin
- Solid D (+39.5) · D 68.5% · R 29.0% · Other 2.5%
- 2008→2024 swing
- +9.3pp toward D · 2008: 30.1pp · 2024: 39.5pp
- All cycles
- 2024: D+39.5 2020: D+45.2 2016: D+38.1 2012: D+26.9 2008: D+30.1
Not yet ingested
- Civics
- —
Market trends
- HPI YoY
- ▲ 3.90%
- Current HPI
- 389.6981
- Rent YoY
- ▲ 4.15%
- Metro
- Boston-Cambridge-Newton, MA-NH
- State GDP YoY
- ▲ 2.28%
- F500 in state
- 38
Industry mix (Fortune 500 HQ in MA)
| Industry | F500 HQs | Revenue |
|---|---|---|
| Technology | 3 | $17B |
|
||
| Insurance | 2 | $84B |
|
||
| Retail | 2 | $76B |
|
||
| Life Sciences | 1 | $43B |
|
||
| Energy Technology | 1 | $31B |
|
||
| Aerospace / Defense | 1 | $18B |
|
||
Price history
+532.4% since first listed3 events — show timeline
- 2026-05-28 Price Changed $1,075,000 MLS PIN
- 2026-05-08 Listed $1,119,999 MLS PIN
- 1997-01-02 Sold (Public Records) $170,000 Public Records
Property tax history
+4.4%/yrLatest (2025): $10,190 · +6.0% YoY. Source: county tax records.
Cash-flow waterfall
monthlySold comps — $/sqft
last 12 mo · ≤1 miLoading sold comps…