 Duplex
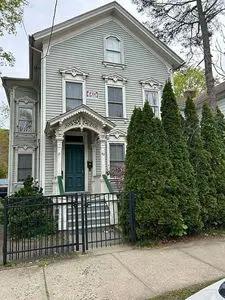
40 Gilbert Ave · New Haven, CT
Flood risk 1/10 · Minimal
- FEMA flood zone
- X (unshaded)
- Chance of flooding over 30 yrs
- 0.0%
- Est. flood insurance / yr
- $473 – $860
Fire risk 1/10 · Minimal
- Est. fire insurance / yr
- $829 – $1,539
Heat risk 7/10 · Major
- Hot days now (above 99°F)
- 7 days/yr
- Hot days in 30 yrs
- 17 days/yr
Wind risk 6/10 · Moderate
- Chance of severe wind over 30 yrs
- 55.0%
Air-quality risk 5/10 · Moderate
- Unhealthy air days now
- 6 days/yr
- Unhealthy air days in 30 yrs
- 8 days/yr
Risk factors via First Street. Map © Google.
Why this score? — see what drove the D- grade
The composite is a weighted blend of 9 inputs, each scored 0–100. Each bar is that input's sub-score; the figure is the points it added to the 100-point composite (weight × sub-score).
- Cash flow +15.1/30.0
- DSCR +4.6/10.0
- 1% rule +4.2/10.0
- Livability +4.0/5.0
- Rent growth +3.2/5.0
- Condition / age +2.5/5.0
- ARV discount +1.7/15.0
- Schools +1.5/10.0
- Appreciation +0.0/10.0
$445,000
🖨 Deal sheet (PDF) 📄 Offer letter ✓ Due diligence
Multi-family units
County records classify this as Multi-Family (2-4 Unit). Listing-text estimate: 2 units. confirmed
Listing remarks
& quot; & quot; The entire house underwent a complete renovation in 2003: new electrical and plumbing systems new drywall floor sanding and new carpeting new wall insulation a renovated exterior with cedar siding and a roof renovation with new plywood and asphalt paving. 160 sqft porch on 2nd floor. The front elevation features historic elements. & quot; & quot; & quot; & quot; & quot; & quot;
Key facts
- New drywall
- New carpeting
- Complete renovation
Tags
Property features AI
Exterior
- Home design: Built in 1890
- Construction: Approximately 2,898 square feet of living area
- Exterior features: Located in the West River subdivision
Neighborhood map
What this means for you Summary
Snapshot
- This is a 2 × 2-bed/1-bath units multifamily listed at $445k.
Deal economics
- At list price, monthly cash flow is $148 ($2k/yr) — positive. Per door: $74/mo.
- The deal already cash-flows at list — no discount required.
- To meet the 1% rule (rent ≥ 1% of price), the offer needs to be $410k (7.8% below list).
- Recommended offer: $410k (7.8% below list) — sets the bar for 1% rule.
- Cap rate 6.7% vs local median 4.9% in New Haven — top-decile yield for the area; either an underpriced asset or a hidden risk that comps aren't pricing in. Stress-test before assuming the spread holds.
Location & tenants
- Location reads 79/100 on livability (#31 in CT, #2,190 nationally) — a middle-class / working-renter tenant base. Strengths: amenities A+, commute A+, health & safety A+; Watch: schools D+, employment D, crime F.
- New Haven School District (urban): math 12% / reading 25% proficiency, ranked #147 of 153 in CT (top 96%) — low school quality limits family demand, transient renter base, plan for 1-2y turnover; 66% free/reduced lunch — lower-income household profile, screen leases tightly.
- Market conditions: Rents rising (+2.6%/yr); 140 active listings in the ZIP; 34 comparable units currently listed for rent nearby; rentals lingering (median 45d on market — plan ~5-8 weeks vacancy on turnover, expect pricing pressure); 53% of comp listings sitting > 30 days — soft ceiling on asking rent; 1,059 units permitted in South Central Connecticut Planning Region in 2024 (779 in 5+ unit buildings).
- At $4,105/mo this rent would consume 82% of the median local household income ($60k/yr) (locally 4999% of renters already pay >50% of income on rent) — very limited rent-growth headroom before tenants either downsize or default.
Forward outlook
- Local home prices are declining (-3.0%/yr); year-one equity from $3k of loan paydown is wiped out by about $13k of value loss. Plan a longer hold.
Negotiation context
- It's been on market 40 days — a 3% lower offer ($432k) is reasonable based on typical stale-listing flexibility.
- Current owner paid $145k; list at $445k implies a 207% gain — meaningful room to come down on a strong offer.
Risks & watch-outs
- Watch-outs: built in 1890 — expect roof / HVAC / electrical / plumbing capex.
- Climate carrying-cost: major wind risk, 55% chance of damaging wind over 30y; extreme-heat days projected 7→17/yr by 2055 (HVAC capex compounding) — expect insurance premiums to compound above CPI over the hold.
Questions for the listing agent
- It's been on market 40 days. Have you received any prior offers? Is the seller open to a 8% concession, seller financing, or rate buy-down credit?
- Can we see the unit-by-unit rent roll, current vacancy, and any below-market leases? What's the average tenancy length?
- What capital expenditures (roof, boiler, parking lot, exteriors) have been made in the last 5 years, and what's planned in the next 2?
- Built in 1890 — when were the roof, HVAC, electrical panel, plumbing, and water heater last replaced?
- Is there a deadline driving the sale (1031 exchange, divorce, estate, relocation)? That informs how much negotiation room exists.
- Schools are D-rated, which usually means shorter tenancies and higher turnover. Who's the typical renter profile here, and what's been the actual vacancy rate?
- Crime grade is F in this area — have there been break-ins, vandalism, or insurance claims at this property in the last 3 years? What carrier currently insures it and at what premium?
- The area grade is low — what's the realistic commute time and amenity access for the typical tenant pool here? Any planned neighborhood developments (good or bad) we should know about?
- What's the average days-on-market for RENTAL listings here right now (not sales)? A rising rental-DOM trend means longer vacancies and softer asking-rent achievability than the comps imply.
- What's the recent tenant-quality profile in this submarket — average credit score on applications, eviction rate, late-payment / NSF rate, and stable-employment percentage? A property-management company in the area should have these aggregated.
- How much new apartment / multifamily construction is in the pipeline within 1–3 miles? Heavy new supply (>2% of stock underway) typically softens rents 12–24 months out; light construction supports rent growth.
Investment metrics
- 1% rule
- 0.92% ✗
- Cap rate
- 6.69%
- Cash-on-cash
- 1.43%
- DSCR
- 1.06
- GRM
- 9.0
CMA / ARV
- ARV (on-the-fly)
- $394,128
- Comps found
- 6
Show comp detail 6 sales within ~0.75 mi
| Address | Dist | Beds/Ba | Sqft | Sold | Price | $/sf | Match |
|---|---|---|---|---|---|---|---|
| 201 Winthrop Ave | 0.26mi | 5/3.0 (+1) | 3,008 (+4%) | 12mo | $330,000 | $110 | 62 |
| 1537 Chapel St | 0.37mi | 4/2.0 | 3,299 (+14%) | 8mo | $450,000 | $136 | 53 |
| 36-38 Maple St | 0.45mi | 4/2.5 | 3,050 (+5%) | 21mo | $379,000 | $124 | 51 |
| 38 Auburn St | 0.26mi | 5/3.0 (+1) | 2,547 (-12%) | 12mo | $470,000 | $185 | 49 |
| 178 Sherman Ave | 0.30mi | 5/3.5 (+1) | 3,222 (+11%) | 13mo | $555,000 | $172 | 45 |
| 14 Dickerman St | 0.61mi | 5/3.0 (+1) | 2,963 (+2%) | 22mo | $335,000 | $113 | 40 |
Match score weights: distance 35% · size 25% · config 20% · recency 20%. Top-matched comps best support the ARV.
Projected returns pro-forma
-3.0% appreciation · 2.6% rent growth · sell at horizon
- IRR
- -14.5%
- Equity multiple
- 0.48×
- Total profit
- $-64,229
- Equity at exit
- $66,351
- IRR
- -6.4%
- Equity multiple
- 0.60×
- Total profit
- $-50,157
- Equity at exit
- $38,475
Cash invested: $124,600 (down + closing). Projections, not guarantees.
Landlord ↔ Tenant lean methodology
- Overall (STATE)
- 27 Tenant-Leaning
- State Connecticut
- 27 Tenant-Leaning · D+7
- County
- — inherits STATE
- City
- — inherits STATE
ZIP-level market 06511
- Home prices YoY
- -20.8%
- Rents YoY
- 2.6%
- Active inventory
- 140
- Price-to-rent
- 18.1×
Monthly cashflow live
- Estimated rent
- $4,105 high interval (Pro) →
- Mortgage (P&I)
- −$2,334
- Tax from tax record
- −$576 /mo · $6,906/yr
- Insurance
- −$185
- HOA
- −$0
- Vacancy / Maint / Mgmt
- −$862
- Net cashflow
- $148
Break-even live
Sensitivity live
| Price | -10% $400 | -5% $274 | +0% $148 | +5% $22 | +10% $-103 |
|---|---|---|---|---|---|
| Rent | -10% $-176 | -5% $-14 | +0% $148 | +5% $311 | +10% $473 |
| Rate | -1.0pp $373 | -0.5pp $262 | base $148 | +0.5pp $33 | +1.0pp $-84 |
2-unit breakdown (identical units grouped — click to expand)
| Units | Beds | Baths | Est. rent |
|---|---|---|---|
| 2× units | 2 | 1 | $4,106 |
| #1 | 2 | 1 | $2,053 |
| #2 | 2 | 1 | $2,053 |
| Total (2 units) | $4,105 | ||
UW: 25.0% down · 7.5% · 30yr · 1.5% tax · 5.0% vac · 8.0% maint · 8.0% mgmt
Financing live
Cash to close
- Down payment
- $111,250
- Closing costs
- $13,350
- Reserves months
- —
- Total cash needed
- —
Loan-product check · same deal, 3 products live
Conventional
25% down · 7.5% · 30yr
- Down + closing
- —
- Monthly P&I
- —
- Monthly cashflow
- —
- DSCR
- —
- Eligible?
- —
Personal DTI + credit; lowest rate.
DSCR
20% down · 8.5% · 30yr
- Down + closing
- —
- Monthly P&I
- —
- Monthly cashflow
- —
- DSCR
- —
- Eligible?
- —
No personal income docs; deal must DSCR.
Hard money
10% down · 12.0% · 12mo
- Down + closing
- —
- Monthly P&I
- —
- Monthly cashflow
- —
- DSCR
- —
- Eligible?
- —
Short-term bridge; refi at stabilization.
Rent comps 34 comps
| Address | Beds | Baths | Sqft | Rent | $/sqft | DOM | Units | Dist |
|---|---|---|---|---|---|---|---|---|
| 54 Sherman Ave Unit 3 New Haven, CT | 3.0 | 1.0 | 3840 | $1,800 | $0.47 | 45d | 1 | 0.18mi |
| 43 Howe St New Haven, CT | 4.0 | 2.0 | 1995 | $4,995 | $2.50 | 15d | 1 | 0.37mi |
| 83 Norton St Unit 2 New Haven, CT | 3.0 | 1.0 | 2869 | $1,695 | $0.59 | 15d | 1 | 0.44mi |
| 117 Maple St New Haven, CT | 3.0 | 1.5 | 2421 | $3,995 | $1.65 | 4d | 1 | 0.60mi |
| 52 Goffe St New Haven, CT | 3.0 | 2.0 | 1935 | $2,600 | $1.34 | 24d | 1 | 0.63mi |
| 786 Elm St Unit 1 New Haven, CT | 3.0 | 1.0 | 3795 | $1,960 | $0.52 | 45d | 1 | 0.64mi |
| 47 Dickerman St Unit 1 New Haven, CT | 3.0 | 1.0 | 3729 | $2,100 | $0.56 | 45d | 1 | 0.64mi |
| 319 Sherman Ave Unit 1ST New Haven, CT | 4.0 | 1.0 | 3845 | $2,495 | $0.65 | 15d | 1 | 0.64mi |
| 319 Sherman Ave Unit 1st fl New Haven, CT | 4.0 | 1.0 | 3845 | $2,495 | $0.65 | 45d | 1 | 0.64mi |
| 347 Sherman Ave New Haven, CT | 5.0 | 3.0 | 3153 | $2,300 | $0.73 | 45d | 1 | 0.70mi |
| 867 Elm St New Haven, CT | 3.0 | 1.0 | 3763 | $2,450 | $0.65 | 45d | 1 | 0.78mi |
| 119 Carmel St Unit 3 New Haven, CT | 3.0 | 1.0 | 3282 | $1,900 | $0.58 | 45d | 1 | 0.85mi |
| 355 Norton St Unit 1 New Haven, CT | 5.0 | 2.5 | 2500 | $3,300 | $1.32 | 22d | 1 | 0.87mi |
| 69 Adeline St Unit D New Haven, CT | 3.0 | 1.5 | 2600 | $2,250 | $0.87 | 24d | 1 | 0.88mi |
| 1519 Ella T Grasso Blvd Unit N/A New Haven, CT | 5.0 | 2.0 | 2750 | $4,450 | $1.62 | 24d | 1 | 0.92mi |
| 5 Oak Pl West Haven, CT | 3.0 | 1.0 | 2300 | $1,900 | $0.83 | 4d | 1 | 0.94mi |
| 49 Hubinger St New Haven, CT | 4.0 | 1.5 | 2000 | $2,950 | $1.48 | 4d | 1 | 0.95mi |
| 82 Gilbert St West Haven, CT | 3.0 | 1.0 | 2641 | $2,400 | $0.91 | 45d | 1 | 0.96mi |
| 50 Admiral St New Haven, CT | 5.0 | 2.0 | 2157 | $2,700 | $1.25 | 20d | 1 | 0.99mi |
| 55 Admiral St Unit 2 New Haven, CT | 5.0 | 3.0 | 2000 | $3,295 | $1.65 | 24d | 1 | 1.01mi |
| 432 Norton Pkwy New Haven, CT | 5.0 | 3.0 | 2493 | $4,195 | $1.68 | 45d | 1 | 1.03mi |
| 56 Mansfield St Unit 1 New Haven, CT | 3.0 | 1.0 | 2759 | $2,800 | $1.01 | 45d | 1 | 1.06mi |
| 1634 Ella T Grasso Blvd New Haven, CT | 4.0 | 1.5 | 2018 | $3,600 | $1.78 | 45d | 1 | 1.13mi |
| 16 Woodland St #1 New Haven, CT | 3.0 | 1.0 | 3786 | $3,200 | $0.85 | 45d | 1 | 1.14mi |
| 134 Mansfield St New Haven, CT | 5.0 | 2.0 | 1960 | $5,500 | $2.81 | 24d | 1 | 1.15mi |
| 54 Trumbull St Unit 54-1 New Haven, CT | 5.0 | 2.5 | 2250 | $6,695 | $2.98 | 15d | 1 | 1.20mi |
| 161 Lamberton St #3 New Haven, CT | 3.0 | 1.0 | 3435 | $1,975 | $0.57 | 4d | 1 | 1.22mi |
| 452 Dixwell Ave New Haven, CT | 3.0 | 2.0 | 3891 | $2,100 | $0.54 | 45d | 1 | 1.27mi |
| 239 Bradley St Unit 1 New Haven, CT | 3.0 | 1.0 | 1982 | $3,650 | $1.84 | 45d | 1 | 1.28mi |
| 30 Trumbull St New Haven, CT | 5.0 | 4.0 | 2668 | $5,000 | $1.87 | 4d | 1 | 1.28mi |
| 1768 Ella T Grasso Blvd New Haven, CT | 4.0 | 2.0 | 2193 | $3,950 | $1.80 | 45d | 1 | 1.33mi |
| 125 Stimson Rd New Haven, CT | 3.0 | 2.5 | 3434 | $3,500 | $1.02 | 45d | 1 | 1.44mi |
| 151 Fitch St #161 New Haven, CT | 3.0 | 2.0 | 2200 | $2,481 | $1.13 | 45d | 1 | 1.45mi |
| 364 W Rock Ave Unit 3 New Haven, CT | 3.0 | 1.0 | 3226 | $2,400 | $0.74 | 45d | 1 | 1.46mi |
Listing history 18 events
-
2026-06-21days on market $445,000 Active 40 DOM
-
2026-06-18days on market $445,000 Active 37 DOM
-
2026-06-17days on market $445,000 Active 36 DOM
-
2026-06-16days on market $445,000 Active 35 DOM
-
2026-06-15days on market $445,000 Active 34 DOM
-
2026-06-14days on market $445,000 Active 32 DOM
-
2026-06-13days on market $445,000 Active 31 DOM
-
2026-06-10days on market $445,000 Active 29 DOM
-
2026-06-09days on market $445,000 Active 28 DOM
-
2026-06-08days on market $445,000 Active 27 DOM
-
2026-06-07days on market $445,000 Active 26 DOM
-
2026-06-05days on market $445,000 Active 23 DOM
-
2026-06-03days on market $445,000 Active 22 DOM
-
2026-06-03days on market $445,000 Active 21 DOM
-
2026-06-01days on market $445,000 Active 20 DOM
-
2026-05-31days on market $445,000 Active 19 DOM
-
2026-05-12$445,000 Active 387-char remark
-
2004-04-20soldstatus $145,000
ⓘ Source: listings_history table (triggers on properties + properties_extension) + one-shot
backfill from property_details.listing_events for pre-trigger history.
Tax reassessment forecast CT · Partial reset (capped growth)
- Current annual tax
- $6,906 · $576/mo
- Projected year-2 tax
- $8,214 · $685/mo
- Expected delta
- +$1,308/yr (+$109/mo · 18.9%)
ⓘ Screening estimate from a state-policy table — verify with the county assessor before closing.
Climate risk First Street
- Flood 1/10 Low FEMA zone X (unshaded) · 0% chance over 30 yrs
- Wildfire 1/10 Low
- Heat 7/10 Severe 7 d/yr ≥99°F today · 17 d/yr by 30 yrs out
- Wind 6/10 Major 55% chance of damaging wind over 30 yrs
- Air quality 5/10 Major 6 unhealthy d/yr today · 8 by 30 yrs out
Nearby sold comps map
Loading sold comps map…
Walkable amenities ~0.75 mi
Loading nearby amenities…
Taxation est. · year 1
- Rental income
- $49,260
- − Mortgage interest
- −$24,927
- − Property taxes
- −$6,906
- − Insurance
- −$2,225
- − Repairs & maintenance
- −$3,941
- − Management
- −$3,941
- − Depreciation
- −$12,945
- Taxable loss
- −$5,625
- Est. tax savings @ 24.0%
- +$1,350
- After-tax cash flow
- $3,131/yr
For passive investors: Depreciation is non-cash, so a rental often shows a tax loss while cash-flowing — sheltering income. Rental losses are passive: they offset passive income freely, and up to $25,000/yr can offset ordinary (W-2) income if you actively participate and your MAGI is under $100k (phasing out to $0 by $150k); unused losses carry forward. On sale, claimed depreciation is recaptured at up to 25%, and gains may owe capital-gains tax (a 1031 exchange can defer both). Figures are a year-1 estimate at your 24.0% rate — not tax advice; consult a CPA.
Schools (NCES district)
- District
- New Haven School District
- NCES district ID
- 0902790
- Math proficiency
- 12% ▼ -10.00%
- Reading proficiency
- 25% ▼ -10.00%
- Median HH income
- $38,058
- Composite
- 15.48/100
- National rank
- #9308
- State rank
- #147 of 153 in CT
Livability — New Haven
- Score
- 79/100
- State rank
- #31
- US rank
- #2190
Category grades
Schools grade is shown separately in the Schools card above.
Census & demographics
- Census place
- New Haven, CT
- County
- New Haven County · 688,236 people
- City population
- 132,813
- Metro
- New Haven-Milford, CT
- Population (ZIP)
- 54,730
- Household income
- $59,969
- Rent vs Own
- Severe rent burden
- 4999.0
Population outlook (South Central Connecticut County) Hauer SSP2
- By 2040
- 608,362
Race, ethnicity, and origin ACS 2023
- Neighborhood character
- Highly diverse neighborhood (Simpson 0.73)
- Race & ethnicity
- Black 34% White 32% Hispanic / Latino 21% Two or more races 8% Asian 7%
- Hispanic origin (detail)
- Mexican 4% Puerto Rican 10% Dominican 2%
- Common ancestry
- Romanian 2% Lithuanian 1% Russian 1%
- Foreign-born
- 17% · Canada, China, South Korea
- Languages at home
- 74% English-only · Spanish 15% Chinese 3% Other Indo-European 2%
Political lean MEDSL · South Central Connecticut
- 2024 margin
- Strong D (+20.1) · D 59.0% · R 38.9% · Other 2.1%
- All cycles
- 2024: D+20.1
Not yet ingested
- Civics
- —
Market trends
- HPI YoY
- ▼ -86.05%
- Current HPI
- 328.1353
- Rent YoY
- ▲ 2.60%
- Metro
- New Haven-Milford, CT
- State GDP YoY
- ▲ 1.06%
- F500 in state
- 38
Industry mix (Fortune 500 HQ in CT)
| Industry | F500 HQs | Revenue |
|---|---|---|
| Industrial Machinery | 4 | $38B |
|
||
| Insurance | 3 | $71B |
|
||
| Financial Services | 2 | $25B |
|
||
| Transportation / Logistics | 2 | $18B |
|
||
| Healthcare | 1 | $247B |
|
||
| Telecommunications | 1 | $55B |
|
||
Price history
+206.9% since first listed2 events — show timeline
- 2026-05-12 Listed $445,000 FSBO.com
- 2004-04-20 Sold (Public Records) $145,000 Public Records
Property tax history
+6.6%/yrLatest (2023): $6,906 · -6.4% YoY. Source: county tax records.
Cash-flow waterfall
monthlySold comps — $/sqft
last 12 mo · ≤1 miLoading sold comps…