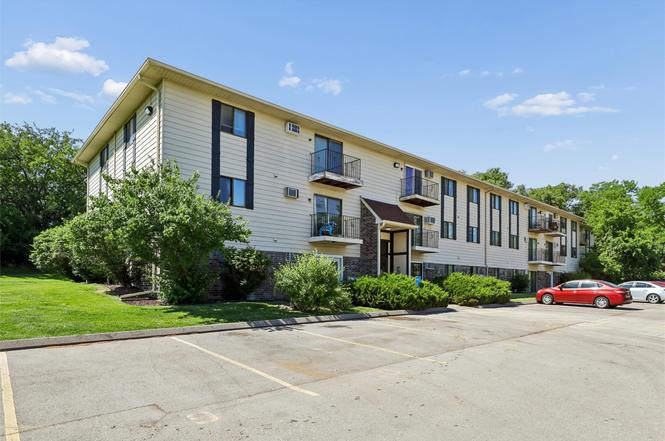
1831 Fuller Rd #1 · West Des Moines, IA
Flood risk No data
- FEMA flood zone
- —
- Chance of flooding over 30 yrs
- —
- Est. flood insurance / yr
- —
Fire risk No data
- Est. fire insurance / yr
- —
Heat risk No data
- Hot days now (above threshold)
- —
- Hot days in 30 yrs
- —
Wind risk No data
- Chance of severe wind over 30 yrs
- —
Air-quality risk No data
- Unhealthy air days now
- —
- Unhealthy air days in 30 yrs
- —
Risk factors via First Street. Map © Google.
Why this score? — see what drove the D+ grade
The composite is a weighted blend of 9 inputs, each scored 0–100. Each bar is that input's sub-score; the figure is the points it added to the 100-point composite (weight × sub-score).
- Cash flow +14.8/30.0
- ARV discount +7.5/15.0
- 1% rule +6.7/10.0
- Schools +6.0/10.0
- DSCR +4.5/10.0
- Livability +4.4/5.0
- Condition / age +2.5/5.0
- Rent growth +2.4/5.0
- Appreciation +0.0/10.0
$90,000
🖨 Deal sheet (PDF) 📄 Offer letter ✓ Due diligence
Listing remarks MLS
Great investor or owner occupy unit available on the 1st floor! This 2 BR condo features neutral paint/carpet, low dues & easy access to Valley Junction and Racoon River Park area! Secured entrance, private patio, pets welcome (restrictions apply) plus laundry room on the same floor. Immediate possession available, inquire today!
Key facts
- Open patio
- Wall mounted a/c
- Corner unit
Tags
Property features AI
Finance
- Other: Pets allowed with breed restrictions
- HOA & community: Homeowners association (Garden Ridge Owners Assoc; self); Association fee $200 monthly; Association fee covers insurance, grounds & structure maintenance, snow removal, trash, and utilities
Exterior
- Utilities: Public water; Public sewer
- Home design: Resale property; Zoned R
- Construction: Vinyl siding; Asphalt shingle roof
- Exterior features: Patio; Open patio
Interior
- Kitchen: Dishwasher; Microwave; Refrigerator; Stove
- Bedrooms: 2 main-level bedrooms
- Bathrooms: 1 full bathroom
- Heating & cooling: Electric forced-air heating (see remarks); Window unit cooling
- Interior features: Dining area
Neighborhood map
What this means for you Summary
Snapshot
- This is a 2-bed/1.0-bath condo listed at $90k.
Deal economics
- At list price, monthly cash flow is $25 ($297/yr) — positive.
- The deal already cash-flows at list — no discount required.
- Meets the 1% rule at list price ($1k rent vs $90k).
- Cap rate 6.6% vs local median 2.5% in West Des Moines — top-decile yield for the area; either an underpriced asset or a hidden risk that comps aren't pricing in. Stress-test before assuming the spread holds.
Location & tenants
- Location reads 87/100 on livability (#11 in IA, #336 nationally) — a professional / high-income tenant draw. Strengths: schools A+, amenities A+, cost of living A+; Watch: commute F.
- West Des Moines Community School District (urban): math 66% / reading 71% proficiency, ranked #133 of 289 in IA (top 46%) — acceptable for families but not a draw, mixed tenant base, ~2y average lease.
- Market conditions: Rents soft (-0.2%/yr); 294 active listings in the ZIP; 3 comparable units currently listed for rent nearby; rentals lingering (median 45d on market — plan ~5-8 weeks vacancy on turnover, expect pricing pressure); 67% of comp listings sitting > 30 days — soft ceiling on asking rent; solid renter incomes; 2,953 units permitted in Polk County in 2024 (540 in 5+ unit buildings).
- This rent is only 15% of the median local income ($86k/yr) — well below the 30% rent-burden line; pricing power to push rent on renewal without tenant pushback.
Forward outlook
- Local home prices are declining (-3.0%/yr); year-one equity from $622 of loan paydown is wiped out by about $3k of value loss. Plan a longer hold.
- Polk County population projected at +37% by 2050 — long-run rental-demand tailwind backs the buy-and-hold thesis.
Negotiation context
- Only 1 days on market — expect competitive offers; lowballing is unlikely to land.
- 3 sale attempts since 17y ago with the ask held roughly flat each time — persistent listings suggest the price (not the market) is what's stuck; bring a comps-based counter.
- Current owner paid $55k; list at $90k implies a 64% gain — meaningful room to come down on a strong offer.
Questions for the listing agent
- Built in 1979 — when were the roof, HVAC, electrical panel, plumbing, and water heater last replaced?
- What does the HOA fee cover, when was the last increase, and are there any pending special assessments or reserve-fund shortfalls?
- Any open or pending special assessments — roof, HVAC, plumbing, elevator, façade? What's the per-unit balance and payoff schedule, and is the seller paying it off at close or rolling it to the buyer?
- Is there a deadline driving the sale (1031 exchange, divorce, estate, relocation)? That informs how much negotiation room exists.
- Schools are A-rated — typically a magnet for longer-tenancy family renters. What's the average tenant stay here, and is there a school-zone premium baked into asking?
- The area grade is low — what's the realistic commute time and amenity access for the typical tenant pool here? Any planned neighborhood developments (good or bad) we should know about?
- What's the average days-on-market for RENTAL listings here right now (not sales)? A rising rental-DOM trend means longer vacancies and softer asking-rent achievability than the comps imply.
- What's the recent tenant-quality profile in this submarket — average credit score on applications, eviction rate, late-payment / NSF rate, and stable-employment percentage? A property-management company in the area should have these aggregated.
- How much new apartment / multifamily construction is in the pipeline within 1–3 miles? Heavy new supply (>2% of stock underway) typically softens rents 12–24 months out; light construction supports rent growth.
Investment metrics
- 1% rule
- 1.17% ✓
- Cap rate
- 6.62%
- Cash-on-cash
- 1.18%
- DSCR
- 1.05
- GRM
- 7.1
CMA / ARV
No comps found within radius.
Projected returns pro-forma
-3.0% appreciation · 0.0% rent growth · sell at horizon
- IRR
- -18.7%
- Equity multiple
- 0.37×
- Total profit
- $-15,961
- Equity at exit
- $13,419
- IRR
- -21.8%
- Equity multiple
- 0.08×
- Total profit
- $-23,255
- Equity at exit
- $7,782
Cash invested: $25,200 (down + closing). Projections, not guarantees.
Landlord ↔ Tenant lean methodology
- Overall (STATE)
- 83 Strongly Landlord-Friendly
- State Iowa
- 83 Strongly Landlord-Friendly · R+6
- County
- — inherits STATE
- City
- — inherits STATE
ZIP-level market 50265
- Rents YoY
- -0.2%
- Active inventory
- 294
- Price-to-rent
- 7.1×
Monthly cashflow live
- Estimated rent
- $1,052 medium interval (Pro) →
- Mortgage (P&I)
- −$472
- Tax from tax record
- −$96 /mo · $1,158/yr
- Insurance
- −$38
- HOA
- −$200
- Vacancy / Maint / Mgmt
- −$221
- Net cashflow
- $25
Break-even live
Sensitivity live
| Price | -10% $76 | -5% $50 | +0% $25 | +5% $-1 | +10% $-26 |
|---|---|---|---|---|---|
| Rent | -10% $-58 | -5% $-17 | +0% $25 | +5% $66 | +10% $108 |
| Rate | -1.0pp $70 | -0.5pp $48 | base $25 | +0.5pp $1 | +1.0pp $-22 |
UW: 25.0% down · 7.5% · 30yr · 1.5% tax · 5.0% vac · 8.0% maint · 8.0% mgmt
Financing live
Cash to close
- Down payment
- $22,500
- Closing costs
- $2,700
- Reserves months
- —
- Total cash needed
- —
Loan-product check · same deal, 3 products live
Conventional
25% down · 7.5% · 30yr
- Down + closing
- —
- Monthly P&I
- —
- Monthly cashflow
- —
- DSCR
- —
- Eligible?
- —
Personal DTI + credit; lowest rate.
DSCR
20% down · 8.5% · 30yr
- Down + closing
- —
- Monthly P&I
- —
- Monthly cashflow
- —
- DSCR
- —
- Eligible?
- —
No personal income docs; deal must DSCR.
Hard money
10% down · 12.0% · 12mo
- Down + closing
- —
- Monthly P&I
- —
- Monthly cashflow
- —
- DSCR
- —
- Eligible?
- —
Short-term bridge; refi at stabilization.
Rent comps 3 comps
| Address | Beds | Baths | Sqft | Rent | $/sqft | DOM | Units | Dist |
|---|---|---|---|---|---|---|---|---|
| 1831 Fuller Rd #3 West Des Moines, IA | 2.0 | 1.0 | 740 | $995 | $1.34 | 22d | 1 | 0.01mi |
| 2120 Grand Ave Unit 2168-19 West Des Moines, IA | 1.0 | 1.0 | 650 | $895 | $1.38 | 44d | 1 | 0.22mi |
| 2210 EP True Pkwy West Des Moines, IA | 1.0–3.0 | 1.0–2.0 | 843 | $973 | $1.15 | 44d | 17 | 0.68mi |
HOA detail condo
- Monthly dues
- $200 · $2,400/yr
- Assessments
- None detected in remarks — confirm with the listing agent.
Listing history 2 events
-
2026-06-17remarks 489-char remark
-
2026-06-17$90,000 Active 1 DOM
ⓘ Source: listings_history table (triggers on properties + properties_extension) + one-shot
backfill from property_details.listing_events for pre-trigger history.
Tax reassessment forecast IA · Partial reset (capped growth)
- Current annual tax
- $1,158 · $96/mo
- Projected year-2 tax
- $1,286 · $107/mo
- Expected delta
- +$128/yr (+$11/mo · 11.0%)
ⓘ Screening estimate from a state-policy table — verify with the county assessor before closing.
Nearby sold comps map
Loading sold comps map…
Walkable amenities ~0.75 mi
Loading nearby amenities…
Taxation est. · year 1
- Rental income
- $12,618
- − Mortgage interest
- −$5,041
- − Property taxes
- −$1,158
- − Insurance
- −$450
- − Repairs & maintenance
- −$1,009
- − Management
- −$1,009
- − HOA
- −$2,400
- − Depreciation
- −$2,618
- Taxable loss
- −$1,068
- Est. tax savings @ 24.0%
- +$256
- After-tax cash flow
- $553/yr
For passive investors: Depreciation is non-cash, so a rental often shows a tax loss while cash-flowing — sheltering income. Rental losses are passive: they offset passive income freely, and up to $25,000/yr can offset ordinary (W-2) income if you actively participate and your MAGI is under $100k (phasing out to $0 by $150k); unused losses carry forward. On sale, claimed depreciation is recaptured at up to 25%, and gains may owe capital-gains tax (a 1031 exchange can defer both). Figures are a year-1 estimate at your 24.0% rate — not tax advice; consult a CPA.
Schools (NCES district)
- District
- West Des Moines Community School District
- NCES district ID
- 1930930
- Math proficiency
- 66% ▼ -9.00%
- Reading proficiency
- 71% ▬ 0.00%
- Median HH income
- $69,043
- Composite
- 59.93/100
- National rank
- #878
- State rank
- #133 of 289 in IA
Livability — West Des Moines
- Score
- 87/100
- State rank
- #11
- US rank
- #336
Category grades
Schools grade is shown separately in the Schools card above.
Census & demographics
- Census place
- West Des Moines, IA
- County
- Polk County · 453,298 people
- City population
- 71,011
- Metro
- Des Moines-West Des Moines, IA
- Population (ZIP)
- 33,488
- Household income
- $85,915
- Rent vs Own
- Severe rent burden
- 741.0
Population outlook (Polk County) Hauer SSP2
- Today (2025)
- 548,042 people
- By 2030
- 588,557 · +7.4%
- By 2040
- 670,629 · +22.4%
- By 2050
- 752,830 · +37.4%
- By 2075
- 955,069 · +74.3%
- By 2100
- 1,115,436 · +103.5%
Race, ethnicity, and origin ACS 2023
- Neighborhood character
- Predominantly White (77%)
- Race & ethnicity
- White 77% Hispanic / Latino 7% Two or more races 7% Asian 6% Black 4%
- Hispanic origin (detail)
- Mexican 5%
- Common ancestry
- Portuguese 4% Italian 3% Iranian 2%
- Foreign-born
- 10% · Canada, Vietnam, South Korea
- Languages at home
- 87% English-only · Spanish 5% Other Asian/Pacific 2% Chinese 1%
Political lean MEDSL · Polk
- 2024 margin
- D (+10.9) · D 54.8% · R 43.9% · Other 1.3%
- 2008→2024 swing
- -3.7pp toward R · 2008: 14.6pp · 2024: 10.9pp
- All cycles
- 2024: D+10.9 2020: D+15.2 2016: D+11.5 2012: D+14.2 2008: D+14.6
Not yet ingested
- Civics
- —
Market trends
- HPI YoY
- ▼ -206.46%
- Current HPI
- 220.1776
- Rent YoY
- ▼ -0.21%
- Metro
- Des Moines-West Des Moines, IA
- State GDP YoY
- ▲ 2.48%
- F500 in state
- 4
Industry mix (Fortune 500 HQ in IA)
| Industry | F500 HQs | Revenue |
|---|---|---|
| Financial Services | 1 | $16B |
|
||
| Retail / Convenience | 1 | $15B |
|
||
Price history
+100.4% since first listed9 events — show timeline
- 2026-06-17 Listed $90,000 DMMLS
- 2022-03-26 Price Changed $800 RENT.
- 2019-10-07 Sold (Public Records) $55,000 Public Records
- 2019-10-04 Sold (MLS) $55,000 DMMLS
- 2019-09-12 Pending — DMMLS
- 2019-09-09 Listed $59,900 DMMLS
- 2018-12-07 Sold (Public Records) $58,000 Public Records
- 2009-12-22 Sold (MLS) $34,000 DMMLS
- 2009-09-23 Listed $44,900 DMMLS
Property tax history
+1.3%/yrLatest (2025): $1,158 · +2.1% YoY. Source: county tax records.
Cash-flow waterfall
monthlySold comps — $/sqft
last 12 mo · ≤1 miLoading sold comps…