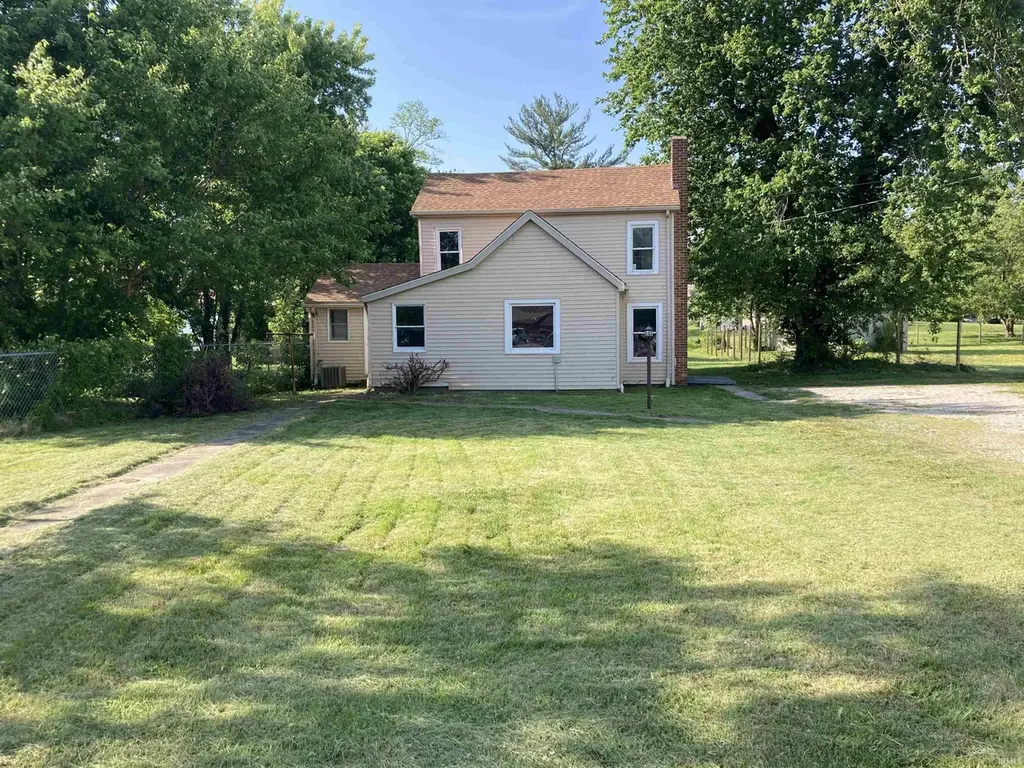
523 E Morton St · Oakland City, IN
Flood risk 6/10 · Moderate
- FEMA flood zone
- X (unshaded)
- Chance of flooding over 30 yrs
- 0.75%
- Est. flood insurance / yr
- $507 – $1,088
Fire risk 3/10 · Minor
- Est. fire insurance / yr
- $717 – $1,331
Heat risk 5/10 · Moderate
- Hot days now (above 107°F)
- 7 days/yr
- Hot days in 30 yrs
- 19 days/yr
Wind risk 2/10 · Minimal
- Chance of severe wind over 30 yrs
- 2.0%
Air-quality risk 4/10 · Minor
- Unhealthy air days now
- 3 days/yr
- Unhealthy air days in 30 yrs
- 5 days/yr
Risk factors via First Street. Map © Google.
Why this score? — see what drove the B- grade
The composite is a weighted blend of 9 inputs, each scored 0–100. Each bar is that input's sub-score; the figure is the points it added to the 100-point composite (weight × sub-score).
- Cash flow +20.7/30.0
- ARV discount +15.0/15.0
- Appreciation +10.0/10.0
- DSCR +6.6/10.0
- 1% rule +5.9/10.0
- Schools +3.2/10.0
- Livability +3.2/5.0
- Rent growth +2.5/5.0
- Condition / age +2.5/5.0
$89,900
🖨 Deal sheet 📄 Offer letter ✓ Due diligence
Listing remarks
Check out this remodeled 2-bedroom 1 bath house on the east side of town. It features all new paint, flooring, and lighting. The eat in kitchen includes appliances. It has a One and a half car detached garage as well. The backyard is a nice size for children to play or have a pet of your own. A home warranty is included for buyer's peace of mind. Don't miss this very affordable home.
Key facts
- Remodeled
- Eat in kitchen
- Backyard
Tags
Property features AI
Exterior
- Parking: Detached 2-car garage
- Utilities: Public water; Public sewer
- Home design: Single-family residence; Site-built home; One story
- Construction: Vinyl siding
- Exterior features: Level lot; Lot dimensions approximately 48 x 80
Interior
- Bathrooms: 1 full bathroom (main level)
- Heating & cooling: Electric heating; Central air conditioning
- Interior features: Crawl space basement; 8 total rooms
- Laundry & utility: Laundry on the main level
Neighborhood map
What this means for you Summary
Snapshot
- This is a 2-bed/1.0-bath single-family listed at $90k.
Deal economics
- At list price, monthly cash flow is $121 ($1k/yr) — positive.
- The deal already cash-flows at list — no discount required.
- Meets the 1% rule at list price ($984 rent vs $90k).
- Recommended offer: $89k (1.5% below list) — sets the bar for market timing.
Location & tenants
- Location reads 65/100 on livability (#349 in IN) — a middle-class / working-renter tenant base. Strengths: crime A+, cost of living A+, housing A+; Watch: health & safety C-, amenities F, commute F.
- East Gibson School Corporation (town): math 40% / reading 35% proficiency, ranked #171 of 301 in IN (top 57%) — families likely to look elsewhere, expect single-tenant / working-renter base with shorter leases.
- Zoned schools: Waldo J Wood Memorial Jhs (math 27% / reading 32%, grade F, #212 of 330 statewide, top 67%, 119 students, 60% FRL); Waldo J Wood Memorial High (math 34% / reading 44%, grade F, #221 of 369 statewide, top 63%, 212 students, 37% FRL).
- Market conditions: 24 active listings in the ZIP; 167 units permitted in Gibson County in 2024 (68 in 5+ unit buildings).
Forward outlook
- In year one you build about $10k of equity ($622 loan paydown + $9k appreciation (10.0% local appreciation)).
- Gibson County population projected to shrink 10% by 2050 — rents likely to lag national; underwrite the cash flow, not the appreciation.
- At projected returns (10.0% appreciation + 3.0% rent growth), your $25k cash investment doubles in ~3 years — after that, you're playing with house money.
- By year 4, paydown + projected appreciation supports a ~$34k cash-out refi (75% LTV) — recoverable capital for the next deal without selling this one.
Negotiation context
- It's been on market 19 days — a 2% lower offer ($89k) is reasonable based on typical stale-listing flexibility.
- 2 sale attempts since 2y ago with the ask held roughly flat each time — persistent listings suggest the price (not the market) is what's stuck; bring a comps-based counter.
Risks & watch-outs
- Watch-outs: built in 1935 — expect roof / HVAC / electrical / plumbing capex.
- Climate carrying-cost: major flood risk; extreme-heat days projected 7→19/yr by 2055 (HVAC capex compounding) — expect insurance premiums to compound above CPI over the hold.
Questions for the listing agent
- Built in 1935 — when were the roof, HVAC, electrical panel, plumbing, and water heater last replaced?
- Is there a deadline driving the sale (1031 exchange, divorce, estate, relocation)? That informs how much negotiation room exists.
- Schools are D-rated, which usually means shorter tenancies and higher turnover. Who's the typical renter profile here, and what's been the actual vacancy rate?
- What's the average days-on-market for RENTAL listings here right now (not sales)? A rising rental-DOM trend means longer vacancies and softer asking-rent achievability than the comps imply.
- What's the recent tenant-quality profile in this submarket — average credit score on applications, eviction rate, late-payment / NSF rate, and stable-employment percentage? A property-management company in the area should have these aggregated.
- How much new for-sale + rental construction is in the pipeline within 1–3 miles? Heavy new supply typically softens prices + rents 12–24 months out; constrained supply supports both.
Investment metrics
- 1% rule
- 1.09% ✓
- Cap rate
- 7.91%
- Cash-on-cash
- 5.77%
- DSCR
- 1.26
- GRM
- 7.6
CMA / ARV
- ARV (on-the-fly)
- $129,519
- Comps found
- 12
Show comp detail 12 sales within ~0.75 mi
| Address | Dist | Beds/Ba | Sqft | Sold | Price | $/sf | Match |
|---|---|---|---|---|---|---|---|
| 415 E Oak St | 0.09mi | 2/1.0 | 1,074 (-3%) | 3mo | $116,500 | $108 | 88 |
| 334 S Jackson St | 0.15mi | 2/1.0 | 988 (-11%) | 2mo | $118,400 | $120 | 73 |
| 1827 S 1200 E | 0.44mi | 2/1.0 | 1,087 (-2%) | 9mo | $117,500 | $108 | 69 |
| 431 E Washington St | 0.17mi | 3/2.0 (+1) | 1,200 (+8%) | 0mo | $215,000 | $179 | 69 |
| 114 S Main St | 0.30mi | 2/1.0 | 1,008 (-9%) | 3mo | $99,000 | $98 | 68 |
| 414 W Columbia St | 0.46mi | 2/1.0 | 1,124 (+2%) | 10mo | $131,900 | $117 | 67 |
| 523 W Morton St | 0.61mi | 2/1.0 | 1,086 (-2%) | 3mo | $64,000 | $59 | 66 |
| 231 W Morton St | 0.43mi | 2/1.5 | 1,152 (+4%) | 12mo | $40,000 | $35 | 61 |
| 426 N Lincoln St | 0.41mi | 3/2.0 (+1) | 1,200 (+8%) | 9mo | $169,000 | $141 | 51 |
| 326 W Vine St | 0.62mi | 2/1.0 | 960 (-13%) | 2mo | $129,000 | $134 | 47 |
| 311 W Columbia St | 0.43mi | 3/1.0 (+1) | 1,270 (+15%) | 8mo | $147,450 | $116 | 44 |
| 226 E Second St | 0.70mi | 3/1.5 (+1) | 1,239 (+12%) | 12mo | $180,000 | $145 | 30 |
Match score weights: distance 35% · size 25% · config 20% · recency 20%. Top-matched comps best support the ARV.
Projected returns pro-forma
10.0% appreciation · 3.0% rent growth · sell at horizon
- IRR
- 28.5%
- Equity multiple
- 3.25×
- Total profit
- $56,709
- Equity at exit
- $80,989
- IRR
- 24.8%
- Equity multiple
- 7.40×
- Total profit
- $161,007
- Equity at exit
- $174,656
Cash invested: $25,172 (down + closing). Projections, not guarantees.
Landlord ↔ Tenant lean methodology
- Overall (STATE)
- 90 Strongly Landlord-Friendly
- State Indiana
- 90 Strongly Landlord-Friendly · R+11
- County
- — inherits STATE
- City
- — inherits STATE
ZIP-level market 47660
- Home prices YoY
- 7.7%
- Active inventory
- 24
- Price-to-rent
- 7.6×
Monthly cashflow live
- Estimated rent
- $984 medium interval (Pro) →
- Mortgage (P&I)
- −$471
- Tax from tax record
- −$147 /mo · $1,764/yr
- Insurance
- −$37
- HOA
- −$0
- Vacancy / Maint / Mgmt
- −$207
- Net cashflow
- $121
Break-even live
UW: 25.0% down · 7.5% · 30yr · 1.5% tax · 5.0% vac · 8.0% maint · 8.0% mgmt
Financing live
Cash to close
- Down payment
- $22,475
- Closing costs
- $2,697
- Reserves months
- —
- Total cash needed
- —
Loan-product check · same deal, 3 products live
Conventional
25% down · 7.5% · 30yr
- Down + closing
- —
- Monthly P&I
- —
- Monthly cashflow
- —
- DSCR
- —
- Eligible?
- —
Personal DTI + credit; lowest rate.
DSCR
20% down · 8.5% · 30yr
- Down + closing
- —
- Monthly P&I
- —
- Monthly cashflow
- —
- DSCR
- —
- Eligible?
- —
No personal income docs; deal must DSCR.
Hard money
10% down · 12.0% · 12mo
- Down + closing
- —
- Monthly P&I
- —
- Monthly cashflow
- —
- DSCR
- —
- Eligible?
- —
Short-term bridge; refi at stabilization.
Listing history 18 events
-
2026-06-18statusdays on market $89,900 Active 19 DOM
-
2026-06-09statusdays on market $89,900 Pending 18 DOM
-
2026-06-08days on market $89,900 Active 17 DOM
-
2026-06-07days on market $89,900 Active 16 DOM
-
2026-06-07days on market $89,900 Active 15 DOM
-
2026-06-04days on market $89,900 Active 12 DOM
-
2026-06-02days on market $89,900 Active 11 DOM
-
2026-06-01days on market $89,900 Active 10 DOM
-
2026-05-31days on market $89,900 Active 9 DOM
-
2026-05-31days on market $89,900 Active 8 DOM
-
2026-05-22$89,900 Active
-
2024-08-07price $84,000
-
2024-07-15price $84,900
-
2024-07-05price $89,900
-
2024-06-02price $92,500
-
2024-05-06$99,900 Active
-
2022-01-27soldstatus $125,000
-
2009-09-29soldstatus $8,500
ⓘ Source: listings_history table (triggers on properties + properties_extension) + one-shot
backfill from property_details.listing_events for pre-trigger history.
Tax reassessment forecast IN · Partial reset (capped growth)
- Current annual tax
- $1,764 · $147/mo
- Projected year-2 tax
- $1,764 · $147/mo
- Expected delta
- $0/yr ($0/mo · 0.0%)
ⓘ Screening estimate from a state-policy table — verify with the county assessor before closing.
Climate risk First Street
- Flood 6/10 Major FEMA zone X (unshaded) · 75% chance over 30 yrs
- Wildfire 3/10 Moderate
- Heat 5/10 Major 7 d/yr ≥107°F today · 19 d/yr by 30 yrs out
- Wind 2/10 Low 2% chance of damaging wind over 30 yrs
- Air quality 4/10 Moderate 3 unhealthy d/yr today · 5 by 30 yrs out
Nearby sold comps map
Loading sold comps map…
Walkable amenities ~0.75 mi
Loading nearby amenities…
Taxation est. · year 1
- Rental income
- $11,802
- − Mortgage interest
- −$5,036
- − Property taxes
- −$1,764
- − Insurance
- −$450
- − Repairs & maintenance
- −$944
- − Management
- −$944
- − Depreciation
- −$2,615
- Taxable income
- $49
- Est. tax owed @ 24.0%
- −$12
- After-tax cash flow
- $1,441/yr
For passive investors: Depreciation is non-cash, so a rental often shows a tax loss while cash-flowing — sheltering income. Rental losses are passive: they offset passive income freely, and up to $25,000/yr can offset ordinary (W-2) income if you actively participate and your MAGI is under $100k (phasing out to $0 by $150k); unused losses carry forward. On sale, claimed depreciation is recaptured at up to 25%, and gains may owe capital-gains tax (a 1031 exchange can defer both). Figures are a year-1 estimate at your 24.0% rate — not tax advice; consult a CPA.
Schools (NCES district)
- District
- East Gibson School Corporation
- NCES district ID
- 1802940
- Math proficiency
- 40% ▼ -5.00%
- Reading proficiency
- 35% ▼ -6.00%
- Median HH income
- $42,426
- Composite
- 31.73/100
- National rank
- #5908
- State rank
- #171 of 301 in IN
Livability — Oakland City
- Score
- 65/100
- State rank
- #349
- US rank
- #13364
Category grades
Schools grade is shown separately in the Schools card above.
Census & demographics
- Census place
- Oakland City, IN
- Population (ZIP)
- 4,819
Population outlook (Gibson County) Hauer SSP2
- Today (2025)
- 33,671 people
- By 2030
- 33,409 · -0.8%
- By 2040
- 32,364 · -3.9%
- By 2050
- 30,453 · -9.6%
- By 2075
- 24,610 · -26.9%
- By 2100
- 16,217 · -51.8%
Race, ethnicity, and origin ACS 2023
- Neighborhood character
- Predominantly White (92%)
- Race & ethnicity
- White 92% Two or more races 4% Hispanic / Latino 2% Black 2%
- Common ancestry
- Lithuanian 2% Serbian 2% Scottish 1%
- Foreign-born
- 1% · Canada
- Languages at home
- 99% English-only · Spanish 1%
Political lean MEDSL · Gibson
- 2024 margin
- Solid R (+51.4) · D 23.4% · R 74.8% · Other 1.8%
- 2008→2024 swing
- -38.2pp toward R · 2008: -13.2pp · 2024: -51.4pp
- All cycles
- 2024: R+51.4 2020: R+48.2 2016: R+47.6 2012: R+31.0 2008: R+13.2
Not yet ingested
- Civics
- —
Market trends
- HPI YoY
- ▲ 16.71%
- Current HPI
- 234.1104
- Rent YoY
- —
- Metro
- —
- State GDP YoY
- ▲ 2.90%
- F500 in state
- 18
Industry mix (Fortune 500 HQ in IN)
| Industry | F500 HQs | Revenue |
|---|---|---|
| Industrial Machinery | 2 | $37B |
|
||
| Healthcare | 1 | $177B |
|
||
| Pharmaceuticals | 1 | $45B |
|
||
| Metals / Steel | 1 | $18B |
|
||
| Agriculture | 1 | $17B |
|
||
| Packaging | 1 | $12B |
|
||
Price history
+957.6% since first listed8 events — show timeline
- 2026-05-22 Listed $89,900 IRMLS
- 2024-08-07 Price Changed $84,000 IRMLS
- 2024-07-15 Price Changed $84,900 IRMLS
- 2024-07-05 Price Changed $89,900 IRMLS
- 2024-06-02 Price Changed $92,500 IRMLS
- 2024-05-06 Listed $99,900 IRMLS
- 2022-01-27 Sold (Public Records) $125,000 Public Records
- 2009-09-29 Sold (Public Records) $8,500 Public Records
Property tax history
+4.8%/yrLatest (2024): $1,764 · +6.0% YoY. Source: county tax records.
Cash-flow waterfall
monthlySold comps — $/sqft
last 12 mo · ≤1 miLoading sold comps…