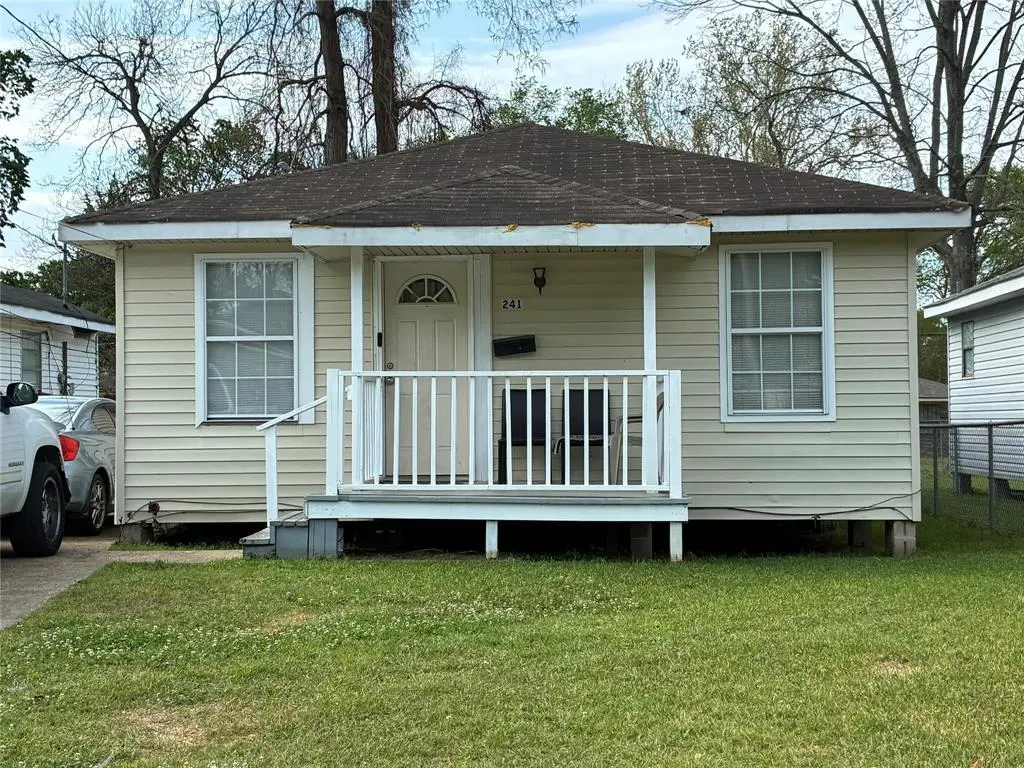
241 E Dudley Dr · Shreveport, LA
Flood risk 1/10 · Minimal
- FEMA flood zone
- X
- Chance of flooding over 30 yrs
- 0.0%
- Est. flood insurance / yr
- $507 – $1,088
Fire risk 1/10 · Minimal
- Est. fire insurance / yr
- $1,269 – $2,357
Heat risk 7/10 · Major
- Hot days now (above 110°F)
- 7 days/yr
- Hot days in 30 yrs
- 22 days/yr
Wind risk 7/10 · Major
- Chance of severe wind over 30 yrs
- 78.0%
Air-quality risk 2/10 · Minimal
- Unhealthy air days now
- 1 days/yr
- Unhealthy air days in 30 yrs
- 2 days/yr
Risk factors via First Street. Map © Google.
Why this score? — see what drove the C grade
The composite is a weighted blend of 9 inputs, each scored 0–100. Each bar is that input's sub-score; the figure is the points it added to the 100-point composite (weight × sub-score).
- Cash flow +29.0/30.0
- DSCR +10.0/10.0
- 1% rule +7.1/10.0
- Rent growth +3.4/5.0
- Livability +3.0/5.0
- Condition / age +2.5/5.0
- Schools +2.2/10.0
- ARV discount +1.7/15.0
- Appreciation +0.0/10.0
$95,000
🖨 Deal sheet (PDF) 📄 Offer letter ✓ Due diligence
Listing remarks MLS
This home is a great investment. This 3-bedroom 2 bath home already have a tenant. Home property is to be sold only in a package with 2712 Ashton St, 1435 Natalie St, and 3014 Desoto. Please do not disturb the tenant.
Key facts
- 5,001 sq ft lot
- Built 1950
- Listed 78 days
Neighborhood map
What this means for you Summary
Snapshot
- This is a 3-bed/1.0-bath single-family listed at $95k.
Deal economics
- At list price, monthly cash flow is $324 ($4k/yr) — positive.
- The deal already cash-flows at list — no discount required.
- Meets the 1% rule at list price ($1k rent vs $95k).
- Recommended offer: $89k (6.0% below list) — sets the bar for market timing.
- Cap rate 10.4% vs local median 5.6% in Shreveport — top-decile yield for the area; either an underpriced asset or a hidden risk that comps aren't pricing in. Stress-test before assuming the spread holds.
Location & tenants
- Location reads 59/100 on livability (#270 in LA) — a working-class tenant base; expect higher turnover. Strengths: cost of living A+, housing A; Watch: schools D+, crime F, amenities F.
- Caddo Parish (urban): math 21% / reading 32% proficiency, ranked #53 of 98 in LA (top 54%) — low school quality limits family demand, transient renter base, plan for 1-2y turnover; 64% free/reduced lunch — lower-income household profile, screen leases tightly.
- Market conditions: Rents rising (+3.6%/yr); 146 active listings in the ZIP; 35 comparable units currently listed for rent nearby; rentals at typical pace (median 22d on market — plan ~3-4 weeks tenant-placement turnaround); 221 units permitted in Caddo Parish in 2024 (0 in 5+ unit buildings).
Forward outlook
- Local home prices are declining (-3.0%/yr); year-one equity from $657 of loan paydown is wiped out by about $3k of value loss. Plan a longer hold.
- Caddo County population projected at -15% by 2050 — secular population decline; favor cash flow + early exit over multi-decade hold.
- At projected returns (-3.0% appreciation + 3.6% rent growth), your $27k cash investment doubles in ~8 years — after that, you're playing with house money.
Negotiation context
- It's been on market 79 days — a 6% lower offer ($89k) is reasonable based on typical stale-listing flexibility.
- 5 sale attempts since 4y ago with the ask held roughly flat each time — persistent listings suggest the price (not the market) is what's stuck; bring a comps-based counter.
- Current owner paid $51k; list at $95k implies a 86% gain — meaningful room to come down on a strong offer.
Risks & watch-outs
- Watch-outs: built in 1950 — expect roof / HVAC / electrical / plumbing capex.
- Climate carrying-cost: major wind risk, 78% chance of damaging wind over 30y; extreme-heat days projected 7→22/yr by 2055 (HVAC capex compounding) — expect insurance premiums to compound above CPI over the hold.
Questions for the listing agent
- It's been on market 79 days. Have you received any prior offers? Is the seller open to a 6% concession, seller financing, or rate buy-down credit?
- Built in 1950 — when were the roof, HVAC, electrical panel, plumbing, and water heater last replaced?
- Why hasn't it sold? Are there any deal-killer items the seller is aware of (foundation, flood, title, zoning, code violations)?
- Is there a deadline driving the sale (1031 exchange, divorce, estate, relocation)? That informs how much negotiation room exists.
- Schools are D-rated, which usually means shorter tenancies and higher turnover. Who's the typical renter profile here, and what's been the actual vacancy rate?
- Crime grade is F in this area — have there been break-ins, vandalism, or insurance claims at this property in the last 3 years? What carrier currently insures it and at what premium?
- What's the average days-on-market for RENTAL listings here right now (not sales)? A rising rental-DOM trend means longer vacancies and softer asking-rent achievability than the comps imply.
- What's the recent tenant-quality profile in this submarket — average credit score on applications, eviction rate, late-payment / NSF rate, and stable-employment percentage? A property-management company in the area should have these aggregated.
- How much new for-sale + rental construction is in the pipeline within 1–3 miles? Heavy new supply typically softens prices + rents 12–24 months out; constrained supply supports both.
Investment metrics
- 1% rule
- 1.21% ✓
- Cap rate
- 10.39%
- Cash-on-cash
- 14.63%
- DSCR
- 1.65
- GRM
- 6.9
CMA / ARV
- ARV (median comp)
- $84,226
- List price
- $95,000
- Delta
- 12.79%
- Verdict
- OVERPRICED
- Comps
- 20 within 1.0 mi
Show comp detail 12 sales within ~0.75 mi
| Address | Dist | Beds/Ba | Sqft | Sold | Price | $/sf | Match |
|---|---|---|---|---|---|---|---|
| 232 E Gregg St | 0.03mi | 3/1.5 | 1,003 (-1%) | 2mo | $75,000 | $75 | 93 |
| 257 E Dudley Dr | 0.04mi | 3/1.5 | 1,035 (+2%) | 5mo | $137,500 | $133 | 88 |
| 3845 Victory Dr | 0.20mi | 3/2.0 | 994 (-2%) | 13mo | $79,000 | $79 | 73 |
| 271 E Linden St | 0.38mi | 2/1.0 (-1) | 1,003 (-1%) | 4mo | $71,900 | $72 | 72 |
| 230 Elmwood E | 0.28mi | 2/1.0 (-1) | 972 (-4%) | 5mo | $90,000 | $93 | 71 |
| 104 E Elmwood St | 0.33mi | 2/1.0 (-1) | 948 (-6%) | 1mo | $89,900 | $95 | 68 |
| 225 E Elmwood St | 0.25mi | 3/1.5 | 1,117 (+10%) | 2mo | $89,500 | $80 | 67 |
| 479 Ockley | 0.57mi | 2/1.0 (-1) | 1,024 (+1%) | 2mo | $135,000 | $132 | 65 |
| 215 E Slattery Blvd | 0.08mi | 2/1.0 (-1) | 1,122 (+11%) | 15mo | $90,000 | $80 | 61 |
| 3850 Greenway Pl | 0.28mi | 3/1.0 | 1,132 (+12%) | 8mo | $180,000 | $159 | 60 |
| 226 Albert Ave | 0.52mi | 2/1.0 (-1) | 1,112 (+10%) | 6mo | $130,000 | $117 | 50 |
| 3476 Coldwell St | 0.47mi | 2/1.0 (-1) | 1,136 (+12%) | 15mo | $139,900 | $123 | 40 |
Match score weights: distance 35% · size 25% · config 20% · recency 20%. Top-matched comps best support the ARV.
Projected returns pro-forma
-3.0% appreciation · 3.56% rent growth · sell at horizon
- IRR
- 5.7%
- Equity multiple
- 1.22×
- Total profit
- $5,891
- Equity at exit
- $14,165
- IRR
- 15.5%
- Equity multiple
- 2.29×
- Total profit
- $34,336
- Equity at exit
- $8,214
Cash invested: $26,600 (down + closing). Projections, not guarantees.
Landlord ↔ Tenant lean methodology
- Overall (STATE)
- 90 Strongly Landlord-Friendly
- State Louisiana
- 90 Strongly Landlord-Friendly · R+12
- County
- — inherits STATE
- City
- — inherits STATE
ZIP-level market 71104
- Home prices YoY
- -32.2%
- Rents YoY
- 3.6%
- Active inventory
- 146
- Price-to-rent
- 6.9×
Monthly cashflow live
- Estimated rent
- $1,153 high interval (Pro) →
- Mortgage (P&I)
- −$498
- Tax from tax record
- −$48 /mo · $580/yr
- Insurance
- −$40
- HOA
- −$0
- Vacancy / Maint / Mgmt
- −$242
- Net cashflow
- $324
Break-even live
Sensitivity live
| Price | -10% $378 | -5% $351 | +0% $324 | +5% $297 | +10% $271 |
|---|---|---|---|---|---|
| Rent | -10% $233 | -5% $279 | +0% $324 | +5% $370 | +10% $415 |
| Rate | -1.0pp $372 | -0.5pp $349 | base $324 | +0.5pp $300 | +1.0pp $275 |
UW: 25.0% down · 7.5% · 30yr · 1.5% tax · 5.0% vac · 8.0% maint · 8.0% mgmt
Financing live
Cash to close
- Down payment
- $23,750
- Closing costs
- $2,850
- Reserves months
- —
- Total cash needed
- —
Loan-product check · same deal, 3 products live
Conventional
25% down · 7.5% · 30yr
- Down + closing
- —
- Monthly P&I
- —
- Monthly cashflow
- —
- DSCR
- —
- Eligible?
- —
Personal DTI + credit; lowest rate.
DSCR
20% down · 8.5% · 30yr
- Down + closing
- —
- Monthly P&I
- —
- Monthly cashflow
- —
- DSCR
- —
- Eligible?
- —
No personal income docs; deal must DSCR.
Hard money
10% down · 12.0% · 12mo
- Down + closing
- —
- Monthly P&I
- —
- Monthly cashflow
- —
- DSCR
- —
- Eligible?
- —
Short-term bridge; refi at stabilization.
Rent comps 35 comps
| Address | Beds | Baths | Sqft | Rent | $/sqft | DOM | Units | Dist |
|---|---|---|---|---|---|---|---|---|
| 219 E Slattery Blvd Shreveport, LA | 2.0 | 1.0 | 1047 | $1,000 | $0.96 | 44d | 1 | 0.04mi |
| 3516 Alexander Ave Shreveport, LA | 2.0 | 1.0 | 1355 | $1,250 | $0.92 | 14d | 1 | 0.33mi |
| 229 Stephenson St Shreveport, LA | 2.0 | 2.5 | 1500 | $1,300 | $0.87 | 14d | 1 | 0.49mi |
| 336 Atkins Ave Shreveport, LA | 2.0 | 1.0 | 912 | $900 | $0.99 | 44d | 1 | 0.76mi |
| 3305 Creswell Ave Shreveport, LA | 2.0 | 1.0 | 1307 | $1,350 | $1.03 | 22d | 1 | 0.85mi |
| 561 Forest Ave Shreveport, LA | 2.0 | 1.0 | 1358 | $1,350 | $0.99 | 22d | 1 | 0.86mi |
| 3840 Creswell Ave Unit 1 Shreveport, LA | 2.0 | 1.5 | 1200 | $1,000 | $0.83 | 44d | 1 | 0.86mi |
| 3846 Creswell Ave Unit 3848 Shreveport, LA | 2.0 | 2.0 | 1374 | $1,125 | $0.82 | 14d | 1 | 0.88mi |
| 140 E Wilkinson St Shreveport, LA | 3.0 | 3.0 | 1174 | $1,300 | $1.11 | 22d | 1 | 0.97mi |
| 140 Wilkinson St Unit 140 Shreveport, LA | 2.0 | 1.0 | 1000 | $1,200 | $1.20 | 22d | 1 | 0.98mi |
| 140 Wilkinson St Unit 142 Shreveport, LA | 3.0 | 3.0 | 1174 | $1,300 | $1.11 | 22d | 1 | 0.98mi |
| 2515 Centenary Blvd Shreveport, LA | 2.0 | 1.0 | 1200 | $2,500 | $2.08 | 14d | 1 | 1.06mi |
| 315 Robinson Pl Shreveport, LA | 2.0 | 1.0 | 1161 | $800 | $0.69 | 14d | 1 | 1.07mi |
| 2618 Roosevelt Ave Shreveport, LA | 3.0 | 1.0 | 845 | $1,000 | $1.18 | 22d | 1 | 1.08mi |
| 216 Pennsylvania Ave Shreveport, LA | 3.0 | 1.0 | 1199 | $1,250 | $1.04 | 22d | 1 | 1.11mi |
| 315 Dalzell St Shreveport, LA | 2.0 | 2.5 | 1372 | $1,100 | $0.80 | 44d | 1 | 1.19mi |
| 3820 Fairfield Ave Unit 37 Shreveport, LA | 2.0 | 2.0 | 1084 | $1,050 | $0.97 | 44d | 1 | 1.20mi |
| 818 E Washington St Shreveport, LA | 3.0 | 1.0 | 1100 | $1,300 | $1.18 | 22d | 1 | 1.21mi |
| 204 Boulevard St Shreveport, LA | 2.0 | 1.0 | 1028 | $1,195 | $1.16 | 44d | 1 | 1.25mi |
| 3827 Maryland Ave Shreveport, LA | 2.0 | 1.0 | 1032 | $1,400 | $1.36 | 44d | 1 | 1.25mi |
| 2615 Judith Pl Shreveport, LA | 3.0 | 2.0 | 1450 | $1,600 | $1.10 | 14d | 1 | 1.28mi |
| 642 Robinson Pl Shreveport, LA | 3.0 | 1.0 | 1500 | $1,275 | $0.85 | 22d | 1 | 1.28mi |
| 186 Charles Ave Shreveport, LA | 3.0 | 1.0 | 1320 | $1,675 | $1.27 | 22d | 1 | 1.29mi |
| 243 Justin Ave Shreveport, LA | 3.0 | 1.0 | 1236 | $1,400 | $1.13 | 44d | 1 | 1.32mi |
| 103 E Merrick St Shreveport, LA | 2.0 | 1.0 | 1200 | $900 | $0.75 | 45d | 1 | 1.33mi |
| 546 Dalzell St Shreveport, LA | 2.0 | 1.0 | 1000 | $875 | $0.88 | 22d | 1 | 1.33mi |
| 3802 Baltimore Ave Shreveport, LA | 2.0 | 1.0 | 1250 | $1,025 | $0.82 | 22d | 1 | 1.34mi |
| 431 College St Shreveport, LA | 2.0 | 2.0 | 1100 | $850 | $0.77 | 14d | 1 | 1.36mi |
| 406 College St Shreveport, LA | 2.0 | 1.0 | 1215 | $900 | $0.74 | 44d | 1 | 1.38mi |
| 4024 Reily Ln Shreveport, LA | 3.0 | 1.0 | 1220 | $1,275 | $1.05 | 22d | 1 | 1.38mi |
| 3100 Fairfield Ave Shreveport, LA | 1.0–2.0 | 1.5–2.0 | 1001 | $1,400 | $1.40 | 22d | 1 | 1.42mi |
| 2721 Fairfield Ave Shreveport, LA | 2.0 | 2.0 | 1250 | $1,200 | $0.96 | 45d | 1 | 1.44mi |
| 126 E Olive St Shreveport, LA | 2.0 | 1.0 | 1200 | $1,500 | $1.25 | 14d | 1 | 1.44mi |
| 2717 Fairfield Ave Shreveport, LA | 2.0 | 1.0 | 1250 | $950 | $0.76 | 44d | 1 | 1.44mi |
| 2506 Mecom Dr Shreveport, LA | 3.0 | 1.5 | 1433 | $1,350 | $0.94 | 14d | 1 | 1.48mi |
Listing history 50 events
-
2026-06-21days on market $95,000 Active 79 DOM
-
2026-06-18days on market $95,000 Active 76 DOM
-
2026-06-17days on market $95,000 Active 75 DOM
-
2026-06-16days on market $95,000 Active 74 DOM
-
2026-06-15days on market $95,000 Active 73 DOM
-
2026-06-14days on market $95,000 Active 71 DOM
-
2026-06-13days on market $95,000 Active 70 DOM
-
2026-06-10days on market $95,000 Active 68 DOM
-
2026-06-09days on market $95,000 Active 67 DOM
-
2026-06-08days on market $95,000 Active 66 DOM
-
2026-06-07days on market $95,000 Active 65 DOM
-
2026-06-05days on market $95,000 Active 62 DOM
-
2026-06-03days on market $95,000 Active 61 DOM
-
2026-06-02days on market $95,000 Active 60 DOM
-
2026-06-01days on market $95,000 Active 59 DOM
-
2026-05-31days on market $95,000 Active 58 DOM
-
2026-05-30days on market $95,000 Active 57 DOM
-
2026-04-03$95,000 Active 219-char remark
Show marketing remark (219 chars)
This home is a great investment. This 3-bedroom 2 bath home already have a tenant. Home property is to be sold only in a package with 2712 Ashton St, 1435 Natalie St, and 3014 Desoto. Please do not disturb the tenant.
-
2024-02-12historical
-
2024-01-31historical $950
-
2023-11-28$950
-
2023-11-27$85,000 Active
-
2022-06-08soldstatus $51,000
-
2022-06-06soldstatus Closed
-
2022-05-17status Pending
-
2022-05-03historical Active Contingent
-
2022-05-02price $67,200
-
2022-04-26price $67,300
-
2022-04-21price $67,400
-
2022-04-19price $67,500
-
2022-04-18price $67,600
-
2022-04-14price $67,700
-
2022-04-13price $67,800
-
2022-04-12price $67,900
-
2022-04-12price $68,000
-
2022-04-11price $68,100
-
2022-04-09price $68,200
-
2022-04-07price $68,300
-
2022-04-04price $68,400
-
2022-04-01price $68,500
-
2022-03-30price $68,600
-
2022-03-23price $68,700
-
2022-03-17price $68,800
-
2022-03-16price $68,900
-
2022-03-14price $69,000
-
2022-03-10price $69,100
-
2022-03-08price $69,200
-
2022-03-02price $69,300
-
2022-03-01price $69,400
-
2022-02-28price $69,500
ⓘ Source: listings_history table (triggers on properties + properties_extension) + one-shot
backfill from property_details.listing_events for pre-trigger history.
Tax reassessment forecast LA · Resets to sale price
- Current annual tax
- $580 · $48/mo
- Projected year-2 tax
- $580 · $48/mo
- Expected delta
- $0/yr ($0/mo · 0.0%)
ⓘ Screening estimate from a state-policy table — verify with the county assessor before closing.
Climate risk First Street
- Flood 1/10 Low FEMA zone X · 0% chance over 30 yrs
- Wildfire 1/10 Low
- Heat 7/10 Severe 7 d/yr ≥110°F today · 22 d/yr by 30 yrs out
- Wind 7/10 Severe 78% chance of damaging wind over 30 yrs
- Air quality 2/10 Low 1 unhealthy d/yr today · 2 by 30 yrs out
Nearby sold comps map
Loading sold comps map…
Walkable amenities ~0.75 mi
Loading nearby amenities…
Taxation est. · year 1
- Rental income
- $13,830
- − Mortgage interest
- −$5,321
- − Property taxes
- −$580
- − Insurance
- −$475
- − Repairs & maintenance
- −$1,106
- − Management
- −$1,106
- − Depreciation
- −$2,764
- Taxable income
- $2,477
- Est. tax owed @ 24.0%
- −$594
- After-tax cash flow
- $3,298/yr
For passive investors: Depreciation is non-cash, so a rental often shows a tax loss while cash-flowing — sheltering income. Rental losses are passive: they offset passive income freely, and up to $25,000/yr can offset ordinary (W-2) income if you actively participate and your MAGI is under $100k (phasing out to $0 by $150k); unused losses carry forward. On sale, claimed depreciation is recaptured at up to 25%, and gains may owe capital-gains tax (a 1031 exchange can defer both). Figures are a year-1 estimate at your 24.0% rate — not tax advice; consult a CPA.
Schools (NCES district)
- District
- Caddo Parish
- NCES district ID
- 2200300
- Math proficiency
- 21% ▼ -33.00%
- Reading proficiency
- 32% ▼ -30.00%
- Median HH income
- $39,227
- Composite
- 22.23/100
- National rank
- #8148
- State rank
- #53 of 98 in LA
Livability — Shreveport
- Score
- 59/100
- State rank
- #270
- US rank
- #19730
Category grades
Schools grade is shown separately in the Schools card above.
Census & demographics
- Census place
- Shreveport, LA
- County
- Caddo Parish · 178,536 people
- City population
- 164,123
- Metro
- Shreveport-Bossier City, LA
- Population (ZIP)
- 12,975
- Household income
- $56,833
- Rent vs Own
- Severe rent burden
- 759.0
Population outlook (Caddo County) Hauer SSP2
- Today (2025)
- 243,190 people
- By 2030
- 237,231 · -2.5%
- By 2040
- 222,502 · -8.5%
- By 2050
- 206,516 · -15.1%
- By 2075
- 165,706 · -31.9%
- By 2100
- 122,262 · -49.7%
Race, ethnicity, and origin ACS 2023
- Neighborhood character
- Diverse neighborhood (Simpson 0.63)
- Race & ethnicity
- White 53% Black 28% Two or more races 10% Hispanic / Latino 10% Asian 3%
- Hispanic origin (detail)
- Mexican 7%
- Common ancestry
- Slovak 6% Lithuanian 4% Scottish 2%
- Foreign-born
- 5% · Canada, Vietnam
- Languages at home
- 90% English-only · Spanish 5% French/Haitian/Cajun 1% Tagalog/Filipino 1%
Political lean MEDSL · Caddo
- 2024 margin
- Toss-up / Even · D 51.6% · R 47.0% · Other 1.4%
- 2008→2024 swing
- +1.6pp toward D · 2008: 3.0pp · 2024: 4.6pp
- All cycles
- 2024: D+4.6 2020: D+6.8 2016: D+4.2 2012: D+4.9 2008: D+3.0
Not yet ingested
- Civics
- —
Market trends
- HPI YoY
- ▼ -49.61%
- Current HPI
- 104.3781
- Rent YoY
- ▲ 3.56%
- Metro
- Shreveport-Bossier City, LA
- State GDP YoY
- ▲ 3.29%
- F500 in state
- 10
Industry mix (Fortune 500 HQ in LA)
| Industry | F500 HQs | Revenue |
|---|---|---|
| Telecommunications | 2 | $23B |
|
||
| Utilities | 1 | $12B |
|
||
| Wholesale / Distribution | 1 | $5B |
|
||
| Advertising | 1 | $2B |
|
||
Price history
+35.7% since first listed42 events — show timeline
- 2026-04-03 Listed $95,000 NTREIS
- 2024-02-12 Listing Removed — NTREIS
- 2024-01-31 Rental Removed $950 NTREIS
- 2023-11-28 Listed for Rent $950 NTREIS
- 2023-11-27 Listed $85,000 NTREIS
- 2022-06-08 Sold (Public Records) $51,000 Public Records
- 2022-06-06 Sold (MLS) — NTREIS
- 2022-05-17 Pending — NTREIS
- 2022-05-03 Contingent — NTREIS
- 2022-05-02 Price Changed $67,200 NTREIS
- 2022-04-26 Price Changed $67,300 NTREIS
- 2022-04-21 Price Changed $67,400 NTREIS
- 2022-04-19 Price Changed $67,500 NTREIS
- 2022-04-18 Price Changed $67,600 NTREIS
- 2022-04-14 Price Changed $67,700 NTREIS
- 2022-04-13 Price Changed $67,800 NTREIS
- 2022-04-12 Price Changed $67,900 NTREIS
- 2022-04-12 Price Changed $68,000 NTREIS
- 2022-04-11 Price Changed $68,100 NTREIS
- 2022-04-09 Price Changed $68,200 NTREIS
- 2022-04-07 Price Changed $68,300 NTREIS
- 2022-04-04 Price Changed $68,400 NTREIS
- 2022-04-01 Price Changed $68,500 NTREIS
- 2022-03-30 Price Changed $68,600 NTREIS
- 2022-03-23 Price Changed $68,700 NTREIS
- 2022-03-17 Price Changed $68,800 NTREIS
- 2022-03-16 Price Changed $68,900 NTREIS
- 2022-03-14 Price Changed $69,000 NTREIS
- 2022-03-10 Price Changed $69,100 NTREIS
- 2022-03-08 Price Changed $69,200 NTREIS
- 2022-03-02 Price Changed $69,300 NTREIS
- 2022-03-01 Price Changed $69,400 NTREIS
- 2022-02-28 Price Changed $69,500 NTREIS
- 2022-02-25 Price Changed $69,600 NTREIS
- 2022-02-24 Price Changed $69,700 NTREIS
- 2022-02-23 Price Changed $69,800 NTREIS
- 2022-02-22 Price Changed $69,900 NTREIS
- 2022-02-21 Relisted — NTREIS
- 2022-02-06 Contingent — NTREIS
- 2022-02-02 Listed $70,000 NTREIS
- 2007-06-08 Sold (Public Records) — Public Records
- 1996-09-17 Sold (Public Records) — Public Records
Property tax history
-0.5%/yrLatest (2025): $580 · +0.4% YoY. Source: county tax records.
Cash-flow waterfall
monthlySold comps — $/sqft
last 12 mo · ≤1 miLoading sold comps…