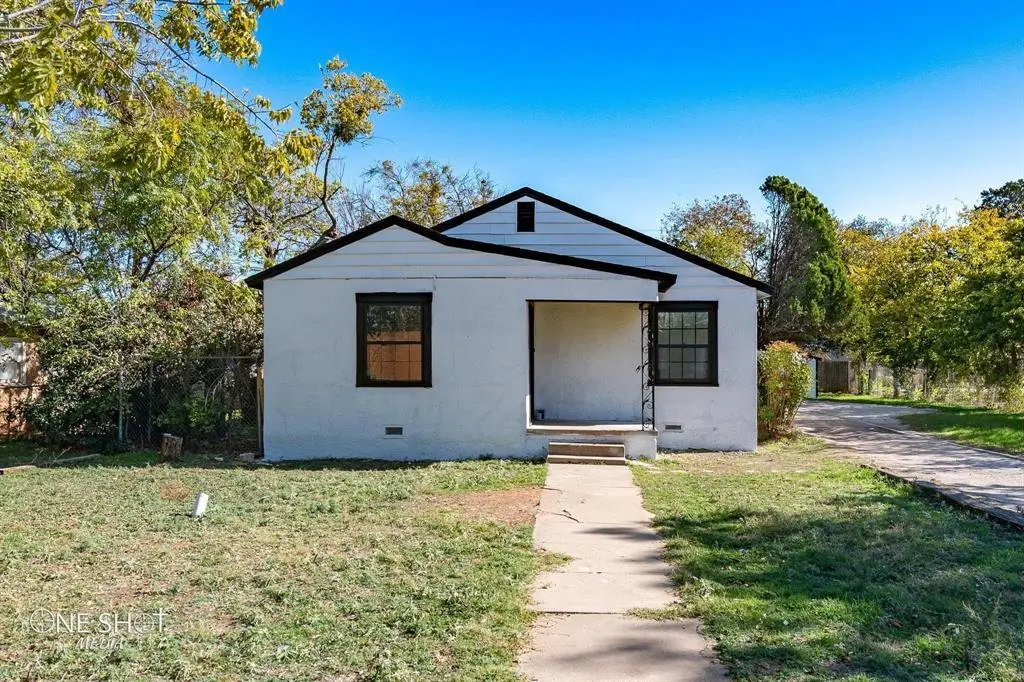
1909 Highland Ave · Abilene, TX
Flood risk 1/10 · Minimal
- FEMA flood zone
- X (unshaded)
- Chance of flooding over 30 yrs
- 0.0%
- Est. flood insurance / yr
- $507 – $1,088
Fire risk 1/10 · Minimal
- Est. fire insurance / yr
- $1,222 – $2,270
Heat risk 6/10 · Moderate
- Hot days now (above 103°F)
- 7 days/yr
- Hot days in 30 yrs
- 23 days/yr
Wind risk 4/10 · Minor
- Chance of severe wind over 30 yrs
- 11.0%
Air-quality risk 1/10 · Minimal
- Unhealthy air days now
- 0 days/yr
- Unhealthy air days in 30 yrs
- 0 days/yr
Risk factors via First Street. Map © Google.
Why this score? — see what drove the D grade
The composite is a weighted blend of 9 inputs, each scored 0–100. Each bar is that input's sub-score; the figure is the points it added to the 100-point composite (weight × sub-score).
- Cash flow +18.3/30.0
- DSCR +5.7/10.0
- Rent growth +5.0/5.0
- 1% rule +4.2/10.0
- Livability +3.8/5.0
- Schools +2.8/10.0
- Condition / age +2.5/5.0
- ARV discount +0.0/15.0
- Appreciation +0.0/10.0
$230,000
🖨 Deal sheet 📄 Offer letter ✓ Due diligence
Listing remarks MLS
PROPERTY IS OCCUPIED BY TENANTS. MUST HAVE 24 HOUR NOTICE TO SHOW. NO EXCEPTIONS! There are two units on this property. The front unit is a 3 bed, 2 bath and the back unit is an efficiency unit. The front unit is leased at $1400 per month. The tenant is on a month to month lease. The back unit leases for $750 per month. This tenant's lease expires January 31, 2026. Property is professionally managed by Absolute Real Estate Management. Historical data is available upon request.
Key facts
- 0.24 acre lot
- 2 parking spots
- Built 1938
Neighborhood map
What this means for you Summary
Snapshot
- This is a ?-bed/1.0-bath single-family listed at $230k.
Deal economics
- At list price, monthly cash flow is $210 ($3k/yr) — positive.
- The deal already cash-flows at list — no discount required.
- To meet the 1% rule (rent ≥ 1% of price), the offer needs to be $211k (8.2% below list).
- Recommended offer: $202k (12.0% below list) — sets the bar for market timing.
Location & tenants
- Location reads 75/100 on livability (#142 in TX, #4,037 nationally) — a middle-class / working-renter tenant base. Strengths: cost of living A+, housing A+, health & safety A+; Watch: schools D+, crime D, commute F.
- Abilene ISD (urban): math 32% / reading 34% proficiency, ranked #575 of 826 in TX (top 70%) — families likely to look elsewhere, expect single-tenant / working-renter base with shorter leases.
- Market conditions: Rents rising fast (+32.1%/yr); 109 active listings in the ZIP; 10 comparable units currently listed for rent nearby; rentals at typical pace (median 21d on market — plan ~3-4 weeks tenant-placement turnaround); 508 units permitted in Taylor County in 2024 (0 in 5+ unit buildings).
- This rent runs 40% of the median local income ($63k/yr) — at the standard rent-burdened threshold; future hikes will face affordability resistance.
Forward outlook
- Local home prices are declining (-3.0%/yr); year-one equity from $2k of loan paydown is wiped out by about $7k of value loss. Plan a longer hold.
- Taylor County population projected at +16% by 2050 — long-run rental-demand tailwind backs the buy-and-hold thesis.
- At projected returns (-3.0% appreciation + 8.0% rent growth), your $64k cash investment doubles in ~10 years — after that, you're playing with house money.
Negotiation context
- It's been on market 192 days — a 12% lower offer ($202k) is reasonable based on typical stale-listing flexibility.
- 4 sale attempts since 3y ago with the ask held roughly flat each time — persistent listings suggest the price (not the market) is what's stuck; bring a comps-based counter.
Risks & watch-outs
- Watch-outs: built in 1938 — expect roof / HVAC / electrical / plumbing capex.
- Climate carrying-cost: extreme-heat days projected 7→23/yr by 2055 (HVAC capex compounding) — expect insurance premiums to compound above CPI over the hold.
Questions for the listing agent
- It's been on market 192 days. Have you received any prior offers? Is the seller open to a 12% concession, seller financing, or rate buy-down credit?
- Built in 1938 — when were the roof, HVAC, electrical panel, plumbing, and water heater last replaced?
- Why hasn't it sold? Are there any deal-killer items the seller is aware of (foundation, flood, title, zoning, code violations)?
- Is there a deadline driving the sale (1031 exchange, divorce, estate, relocation)? That informs how much negotiation room exists.
- Schools are D-rated, which usually means shorter tenancies and higher turnover. Who's the typical renter profile here, and what's been the actual vacancy rate?
- Crime grade is D in this area — have there been break-ins, vandalism, or insurance claims at this property in the last 3 years? What carrier currently insures it and at what premium?
- The area grade is low — what's the realistic commute time and amenity access for the typical tenant pool here? Any planned neighborhood developments (good or bad) we should know about?
- What's the average days-on-market for RENTAL listings here right now (not sales)? A rising rental-DOM trend means longer vacancies and softer asking-rent achievability than the comps imply.
- What's the recent tenant-quality profile in this submarket — average credit score on applications, eviction rate, late-payment / NSF rate, and stable-employment percentage? A property-management company in the area should have these aggregated.
- How much new for-sale + rental construction is in the pipeline within 1–3 miles? Heavy new supply typically softens prices + rents 12–24 months out; constrained supply supports both.
Investment metrics
- 1% rule
- 0.92% ✗
- Cap rate
- 7.39%
- Cash-on-cash
- 3.91%
- DSCR
- 1.17
- GRM
- 9.1
CMA / ARV
- ARV (median comp)
- $159,900
- List price
- $230,000
- Delta
- 43.84%
- Verdict
- OVERPRICED
- Comps
- 9 within 1.0 mi
Show comp detail 12 sales within ~0.75 mi
| Address | Dist | Beds/Ba | Sqft | Sold | Price | $/sf | Match |
|---|---|---|---|---|---|---|---|
| 2002 S 20th St | 0.17mi | 3/2.0 | 1,214 (-4%) | 2mo | $194,900 | $161 | 79 |
| 1749 S 21 | 0.36mi | 2/2.0 | 1,269 (-0%) | 1mo | $219,500 | $173 | 78 |
| 1718 Marshall St | 0.38mi | 2/1.0 | 1,216 (-4%) | 2mo | $173,000 | $142 | 74 |
| 2026 S 20th St | 0.14mi | 3/2.0 | 1,448 (+14%) | 1mo | $199,900 | $138 | 65 |
| 2209 Poplar St | 0.64mi | 4/1.0 | 1,328 (+5%) | 1mo | $145,000 | $109 | 62 |
| 1701 S 23rd St | 0.49mi | 3/2.0 | 1,188 (-6%) | 1mo | $189,000 | $159 | 61 |
| 2641 Raintree Cir | 0.59mi | 3/2.0 | 1,322 (+4%) | 2mo | $225,000 | $170 | 61 |
| 3134 S 21st St | 0.70mi | 2/1.0 | 1,212 (-5%) | 1mo | $199,999 | $165 | 59 |
| 2057 Barrow St | 0.63mi | 3/1.0 | 1,374 (+8%) | 0mo | $169,900 | $124 | 57 |
| 1733 Palm St | 0.52mi | 3/2.0 | 1,381 (+9%) | 0mo | $159,900 | $116 | 56 |
| 1110 Amarillo St | 0.74mi | 3/1.0 | 1,368 (+8%) | 1mo | $119,900 | $88 | 52 |
| 2701 S 27th St | 0.73mi | 3/2.0 | 1,440 (+13%) | 1mo | $165,000 | $115 | 39 |
Match score weights: distance 35% · size 25% · config 20% · recency 20%. Top-matched comps best support the ARV.
Projected returns pro-forma
-3.0% appreciation · 8.0% rent growth · sell at horizon
- IRR
- -5.1%
- Equity multiple
- 0.80×
- Total profit
- $-12,796
- Equity at exit
- $34,294
- IRR
- 9.4%
- Equity multiple
- 1.88×
- Total profit
- $56,675
- Equity at exit
- $19,886
Cash invested: $64,400 (down + closing). Projections, not guarantees.
Landlord ↔ Tenant lean methodology
- Overall (STATE)
- 87 Strongly Landlord-Friendly
- State Texas
- 87 Strongly Landlord-Friendly · R+5
- County
- — inherits STATE
- City
- — inherits STATE
ZIP-level market 79605
- Rents YoY
- 32.1%
- Active inventory
- 109
- Price-to-rent
- 9.1×
Monthly cashflow live
- Estimated rent
- $2,113 high interval (Pro) →
- Mortgage (P&I)
- −$1,206
- Tax from tax record
- −$157 /mo · $1,886/yr
- Insurance
- −$96
- HOA
- −$0
- Vacancy / Maint / Mgmt
- −$444
- Net cashflow
- $210
Break-even live
UW: 25.0% down · 7.5% · 30yr · 1.5% tax · 5.0% vac · 8.0% maint · 8.0% mgmt
Financing live
Cash to close
- Down payment
- $57,500
- Closing costs
- $6,900
- Reserves months
- —
- Total cash needed
- —
Loan-product check · same deal, 3 products live
Conventional
25% down · 7.5% · 30yr
- Down + closing
- —
- Monthly P&I
- —
- Monthly cashflow
- —
- DSCR
- —
- Eligible?
- —
Personal DTI + credit; lowest rate.
DSCR
20% down · 8.5% · 30yr
- Down + closing
- —
- Monthly P&I
- —
- Monthly cashflow
- —
- DSCR
- —
- Eligible?
- —
No personal income docs; deal must DSCR.
Hard money
10% down · 12.0% · 12mo
- Down + closing
- —
- Monthly P&I
- —
- Monthly cashflow
- —
- DSCR
- —
- Eligible?
- —
Short-term bridge; refi at stabilization.
Rent comps 10 comps
| Address | Beds | Baths | Sqft | Rent | $/sqft | DOM | Units | Dist |
|---|---|---|---|---|---|---|---|---|
| 1934 Portland Ave Abilene, TX | 3.0 | 2.0 | 1108 | $1,900 | $1.71 | 44d | 1 | 0.30mi |
| 1349 Meander St Abilene, TX | 3.0 | 1.0 | 1532 | $3,800 | $2.48 | 13d | 1 | 0.52mi |
| 3173 Hunt St Abilene, TX | 3.0 | 1.5 | 1300 | $2,250 | $1.73 | 44d | 1 | 0.76mi |
| 2601 Edgemont Dr Abilene, TX | 2.0 | 2.0 | 1624 | $2,495 | $1.54 | 21d | 1 | 0.84mi |
| 3250 College St Abilene, TX | 2.0 | 1.0 | 1148 | $1,595 | $1.39 | 21d | 1 | 0.95mi |
| 889 Ross Ave Abilene, TX | 2.0 | 1.0 | 1223 | $1,700 | $1.39 | 21d | 1 | 0.96mi |
| 801 S 17th St Abilene, TX | 3.0 | 1.0 | 1200 | $1,800 | $1.50 | 13d | 1 | 0.99mi |
| 3373 S 27th St Abilene, TX | 2.0 | 2.0 | 1436 | $1,700 | $1.18 | 44d | 1 | 1.20mi |
| 725 Peach St Abilene, TX | 3.0 | 2.0 | 1618 | $3,500 | $2.16 | 21d | 1 | 1.20mi |
| 619 Poplar St Abilene, TX | 2.0 | 1.0 | 884 | $1,695 | $1.92 | 13d | 1 | 1.33mi |
Listing history 28 events
-
2026-06-19days on market $230,000 Active 192 DOM
-
2026-06-18days on market $230,000 Active 191 DOM
-
2026-06-17days on market $230,000 Active 190 DOM
-
2026-06-16days on market $230,000 Active 189 DOM
-
2026-06-15days on market $230,000 Active 188 DOM
-
2026-06-14days on market $230,000 Active 186 DOM
-
2026-06-13days on market $230,000 Active 185 DOM
-
2026-06-10days on market $230,000 Active 183 DOM
-
2026-06-09days on market $230,000 Active 182 DOM
-
2026-06-08days on market $230,000 Active 181 DOM
-
2026-06-07days on market $230,000 Active 180 DOM
-
2026-06-03days on market $230,000 Active 176 DOM
-
2026-06-02days on market $230,000 Active 175 DOM
-
2026-06-01days on market $230,000 Active 174 DOM
-
2026-05-31days on market $230,000 Active 173 DOM
-
2026-05-30days on market $230,000 Active 172 DOM
-
2025-12-09$230,000 Active 483-char remark
Show marketing remark (483 chars)
PROPERTY IS OCCUPIED BY TENANTS. MUST HAVE 24 HOUR NOTICE TO SHOW. NO EXCEPTIONS! There are two units on this property. The front unit is a 3 bed, 2 bath and the back unit is an efficiency unit. The front unit is leased at $1400 per month. The tenant is on a month to month lease. The back unit leases for $750 per month. This tenant's lease expires January 31, 2026. Property is professionally managed by Absolute Real Estate Management. Historical data is available upon request.
-
2025-01-11historical $700
-
2025-01-05$700
-
2024-03-16historical $1,400
-
2024-02-08price $1,400
-
2024-01-30price $1,425
-
2024-01-09$1,450
-
2023-09-01soldstatus
-
2023-08-31soldstatus Closed 140-char remark
Show marketing remark (140 chars)
Two bedroom, one bath home, shared drive way with 1 bedroom apartment in back of home. Central heat and air, hardwood floors, large storage.
-
2023-08-05status Pending 140-char remark
Show marketing remark (140 chars)
Two bedroom, one bath home, shared drive way with 1 bedroom apartment in back of home. Central heat and air, hardwood floors, large storage.
-
2023-07-25historical Active Option Contract 140-char remark
Show marketing remark (140 chars)
Two bedroom, one bath home, shared drive way with 1 bedroom apartment in back of home. Central heat and air, hardwood floors, large storage.
-
2023-07-20$89,900 Active 140-char remark
Show marketing remark (140 chars)
Two bedroom, one bath home, shared drive way with 1 bedroom apartment in back of home. Central heat and air, hardwood floors, large storage.
ⓘ Source: listings_history table (triggers on properties + properties_extension) + one-shot
backfill from property_details.listing_events for pre-trigger history.
Tax reassessment forecast TX · Resets to sale price
- Current annual tax
- $1,886 · $157/mo
- Projected year-2 tax
- $4,209 · $351/mo
- Expected delta
- +$2,323/yr (+$194/mo · 123.2%)
ⓘ Screening estimate from a state-policy table — verify with the county assessor before closing.
Climate risk First Street
- Flood 1/10 Low FEMA zone X (unshaded) · 0% chance over 30 yrs
- Wildfire 1/10 Low
- Heat 6/10 Major 7 d/yr ≥103°F today · 23 d/yr by 30 yrs out
- Wind 4/10 Moderate 11% chance of damaging wind over 30 yrs
- Air quality 1/10 Low 0 unhealthy d/yr today · 0 by 30 yrs out
Nearby sold comps map
Loading sold comps map…
Walkable amenities ~0.75 mi
Loading nearby amenities…
Taxation est. · year 1
- Rental income
- $25,350
- − Mortgage interest
- −$12,884
- − Property taxes
- −$1,886
- − Insurance
- −$1,150
- − Repairs & maintenance
- −$2,028
- − Management
- −$2,028
- − Depreciation
- −$6,691
- Taxable loss
- −$1,316
- Est. tax savings @ 24.0%
- +$316
- After-tax cash flow
- $2,833/yr
For passive investors: Depreciation is non-cash, so a rental often shows a tax loss while cash-flowing — sheltering income. Rental losses are passive: they offset passive income freely, and up to $25,000/yr can offset ordinary (W-2) income if you actively participate and your MAGI is under $100k (phasing out to $0 by $150k); unused losses carry forward. On sale, claimed depreciation is recaptured at up to 25%, and gains may owe capital-gains tax (a 1031 exchange can defer both). Figures are a year-1 estimate at your 24.0% rate — not tax advice; consult a CPA.
Schools (NCES district)
- District
- Abilene ISD
- NCES district ID
- 4807440
- Math proficiency
- 32% ▼ -11.00%
- Reading proficiency
- 34% ▼ -5.00%
- Median HH income
- $39,782
- Composite
- 27.71/100
- National rank
- #6909
- State rank
- #575 of 826 in TX
Livability — Abilene
- Score
- 75/100
- State rank
- #142
- US rank
- #4037
Category grades
Schools grade is shown separately in the Schools card above.
Census & demographics
- Census place
- Abilene, TX
- County
- Taylor County · 136,672 people
- City population
- 136,672
- Metro
- Abilene, TX
- Population (ZIP)
- 28,467
- Household income
- $62,929
- Rent vs Own
- Severe rent burden
- 1096.0
Population outlook (Taylor County) Hauer SSP2
- Today (2025)
- 145,270 people
- By 2030
- 150,050 · +3.3%
- By 2040
- 159,417 · +9.7%
- By 2050
- 168,883 · +16.3%
- By 2075
- 194,436 · +33.8%
- By 2100
- 203,163 · +39.9%
Race, ethnicity, and origin ACS 2023
- Neighborhood character
- Majority White (63%)
- Race & ethnicity
- White 63% Hispanic / Latino 22% Two or more races 12% Black 8% Asian 2%
- Hispanic origin (detail)
- Mexican 19%
- Common ancestry
- Slovak 2% Lithuanian 1% Serbian 1%
- Foreign-born
- 6% · Canada
- Languages at home
- 84% English-only · Spanish 14% German/W. Germanic 1% Other Asian/Pacific 0%
Political lean MEDSL · Taylor
- 2024 margin
- Solid R (+49.8) · D 24.6% · R 74.4% · Other 1.0%
- 2008→2024 swing
- -4.2pp toward R · 2008: -45.6pp · 2024: -49.8pp
- All cycles
- 2024: R+49.8 2020: R+45.3 2016: R+51.1 2012: R+53.6 2008: R+45.6
Not yet ingested
- Civics
- —
Market trends
- HPI YoY
- ▼ -181.75%
- Current HPI
- 201.2341
- Rent YoY
- ▲ 32.08%
- Metro
- Abilene, TX
- State GDP YoY
- ▲ 3.95%
- F500 in state
- 110
Industry mix (Fortune 500 HQ in TX)
| Industry | F500 HQs | Revenue |
|---|---|---|
| Energy | 16 | $1,198B |
|
||
| Technology | 5 | $198B |
|
||
| Engineering / Construction | 4 | $72B |
|
||
| Energy Services | 3 | $60B |
|
||
| Utilities | 3 | $41B |
|
||
| Healthcare | 2 | $330B |
|
||
Price history
+155.8% since first listed12 events — show timeline
- 2025-12-09 Listed $230,000 NTREIS
- 2025-01-11 Rental Removed $700 APPFOLIO
- 2025-01-05 Listed for Rent $700 APPFOLIO
- 2024-03-16 Rental Removed $1,400 NTREIS
- 2024-02-08 Price Changed $1,400 NTREIS
- 2024-01-30 Price Changed $1,425 NTREIS
- 2024-01-09 Listed for Rent $1,450 NTREIS
- 2023-09-01 Sold (Public Records) — Public Records
- 2023-08-31 Sold (MLS) — NTREIS
- 2023-08-05 Pending — NTREIS
- 2023-07-25 Contingent — NTREIS
- 2023-07-20 Listed $89,900 NTREIS
Property tax history
+4.5%/yrLatest (2025): $1,886 · +2.7% YoY. Source: county tax records.
Cash-flow waterfall
monthlySold comps — $/sqft
last 12 mo · ≤1 miLoading sold comps…