2525 Riverside Benleo Rd · Woodbury, KY
Flood risk 1/10 · Minimal
- FEMA flood zone
- X (unshaded)
- Chance of flooding over 30 yrs
- 0.0%
- Est. flood insurance / yr
- $507 – $1,088
Fire risk 2/10 · Minimal
- Est. fire insurance / yr
- $839 – $1,559
Heat risk 5/10 · Moderate
- Hot days now (above 106°F)
- 7 days/yr
- Hot days in 30 yrs
- 17 days/yr
Wind risk 2/10 · Minimal
- Chance of severe wind over 30 yrs
- 4.0%
Air-quality risk 1/10 · Minimal
- Unhealthy air days now
- 0 days/yr
- Unhealthy air days in 30 yrs
- 0 days/yr
Risk factors via First Street. Map © Google.
Why this score? — see what drove the C grade
The composite is a weighted blend of 9 inputs, each scored 0–100. Each bar is that input's sub-score; the figure is the points it added to the 100-point composite (weight × sub-score).
- Cash flow +25.4/30.0
- DSCR +8.4/10.0
- ARV discount +7.5/15.0
- 1% rule +5.7/10.0
- Schools +3.2/10.0
- Livability +3.2/5.0
- Rent growth +2.6/5.0
- Condition / age +2.5/5.0
- Appreciation +0.0/10.0
$139,900
🖨 Deal sheet 📄 Offer letter ✓ Due diligence
Listing remarks
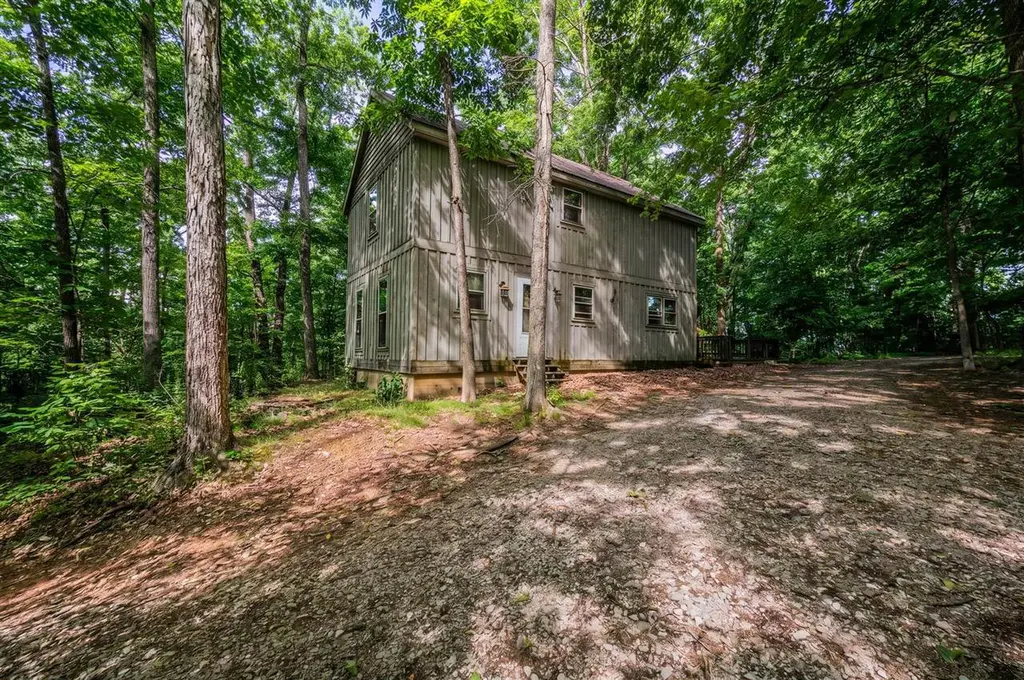
Fixer-upper opportunity in the rolling countryside of Bowling Green! Tucked away atop a hill at one of the area’s high points, this unique country property offers privacy, character, and incredible upside potential. Surrounded by hundreds of soaring mature trees and set well off the road, the home enjoys a peaceful setting with slightly rolling terrain, flat usable areas within the trees, and a circular drive winding through the landscape. The prior tenants loved the setting here so much they stayed for well over 12 years, but unfortunately failed to maintain the property’s beauty over time. Situated on 1.027 acres and built in 1996, this 2-story country home offers approximatel
Key facts
- Privacy
- Metal roof
- Circular drive
Tags
Property features AI
Exterior
- Parking: Circular driveway
- Utilities: Public water; Septic tank
- Home design: Farm property (Residential Farm)
- Construction: Frame construction; Metal roof
- Exterior features: Deck; Wooded lot
Interior
- Flooring: Hardwood
- Bathrooms: One full bathroom; One half bathroom
- Heating & cooling: Fireplace insert; Central heating; Electric heating
- Interior features: Vaulted ceilings; Walk-in closets
- Laundry & utility: Electric water heater
Neighborhood map
What this means for you Summary
Snapshot
- This is a 3-bed/2.0-bath single-family listed at $140k.
Deal economics
- At list price, monthly cash flow is $321 ($4k/yr) — positive.
- The deal already cash-flows at list — no discount required.
- Meets the 1% rule at list price ($1k rent vs $140k).
- Recommended offer: $136k (3.0% below list) — sets the bar for market timing.
Location & tenants
- Location reads 63/100 on livability (#315 in KY) — a middle-class / working-renter tenant base. Strengths: cost of living A+, housing A+; Watch: employment C-, amenities F, commute F.
- Warren County (rural): math 30% / reading 43% proficiency, ranked #48 of 165 in KY (top 29%) — families likely to look elsewhere, expect single-tenant / working-renter base with shorter leases.
- Zoned schools: Richardsville Elementary (math 12% / reading 27%, grade F, #572 of 676 statewide, top 88%, 479 students, 73% FRL); Warren East Middle School (math 23% / reading 40%, grade F, #125 of 217 statewide, top 63%, 487 students, 65% FRL); Warren East High School (math 22% / reading 31%, grade F, #174 of 254 statewide, top 69%, 1,031 students, 60% FRL) — zoned schools average 66% FRL vs 42% district-wide (24 pts higher); higher-poverty schools than district average — tighter screening recommended.
- Market conditions: Rents flat; 591 active listings in the ZIP; 2,286 units permitted in Warren County in 2024 (1,410 in 5+ unit buildings).
- This rent runs 37% of the median local income ($48k/yr) — at the standard rent-burdened threshold; future hikes will face affordability resistance.
Forward outlook
- Local home prices are declining (-3.0%/yr); year-one equity from $967 of loan paydown is wiped out by about $4k of value loss. Plan a longer hold.
- Warren County population projected at +41% by 2050 — long-run rental-demand tailwind backs the buy-and-hold thesis.
Negotiation context
- It's been on market 33 days — a 3% lower offer ($136k) is reasonable based on typical stale-listing flexibility.
Risks & watch-outs
- Climate carrying-cost: extreme-heat days projected 7→17/yr by 2055 (HVAC capex compounding) — expect insurance premiums to compound above CPI over the hold.
Questions for the listing agent
- It's been on market 33 days. Have you received any prior offers? Is the seller open to a 3% concession, seller financing, or rate buy-down credit?
- Is there a deadline driving the sale (1031 exchange, divorce, estate, relocation)? That informs how much negotiation room exists.
- Schools are F-rated, which usually means shorter tenancies and higher turnover. Who's the typical renter profile here, and what's been the actual vacancy rate?
- What's the average days-on-market for RENTAL listings here right now (not sales)? A rising rental-DOM trend means longer vacancies and softer asking-rent achievability than the comps imply.
- What's the recent tenant-quality profile in this submarket — average credit score on applications, eviction rate, late-payment / NSF rate, and stable-employment percentage? A property-management company in the area should have these aggregated.
- How much new for-sale + rental construction is in the pipeline within 1–3 miles? Heavy new supply typically softens prices + rents 12–24 months out; constrained supply supports both.
Investment metrics
- 1% rule
- 1.07% ✓
- Cap rate
- 9.05%
- Cash-on-cash
- 9.84%
- DSCR
- 1.44
- GRM
- 7.8
CMA / ARV
No comps found within radius.
Projected returns pro-forma
-3.0% appreciation · 0.28% rent growth · sell at horizon
- IRR
- -4.4%
- Equity multiple
- 0.84×
- Total profit
- $-6,232
- Equity at exit
- $20,860
- IRR
- 2.1%
- Equity multiple
- 1.14×
- Total profit
- $5,296
- Equity at exit
- $12,096
Cash invested: $39,172 (down + closing). Projections, not guarantees.
Landlord ↔ Tenant lean methodology
- Overall (STATE)
- 83 Strongly Landlord-Friendly
- State Kentucky
- 83 Strongly Landlord-Friendly · R+16
- County
- — inherits STATE
- City
- — inherits STATE
ZIP-level market 42101
- Home prices YoY
- -20.9%
- Rents YoY
- 0.3%
- Active inventory
- 591
- Price-to-rent
- 7.8×
Monthly cashflow live
- Estimated rent
- $1,490 medium interval (Pro) →
- Mortgage (P&I)
- −$734
- Tax from tax record
- −$64 /mo · $770/yr
- Insurance
- −$58
- HOA
- −$0
- Vacancy / Maint / Mgmt
- −$313
- Net cashflow
- $321
Break-even live
UW: 25.0% down · 7.5% · 30yr · 1.5% tax · 5.0% vac · 8.0% maint · 8.0% mgmt
Financing live
Cash to close
- Down payment
- $34,975
- Closing costs
- $4,197
- Reserves months
- —
- Total cash needed
- —
Loan-product check · same deal, 3 products live
Conventional
25% down · 7.5% · 30yr
- Down + closing
- —
- Monthly P&I
- —
- Monthly cashflow
- —
- DSCR
- —
- Eligible?
- —
Personal DTI + credit; lowest rate.
DSCR
20% down · 8.5% · 30yr
- Down + closing
- —
- Monthly P&I
- —
- Monthly cashflow
- —
- DSCR
- —
- Eligible?
- —
No personal income docs; deal must DSCR.
Hard money
10% down · 12.0% · 12mo
- Down + closing
- —
- Monthly P&I
- —
- Monthly cashflow
- —
- DSCR
- —
- Eligible?
- —
Short-term bridge; refi at stabilization.
Listing history 15 events
-
2026-06-17status $139,900 Pending 33 DOM
-
2026-06-16days on market $139,900 Active 33 DOM
-
2026-06-15days on market $139,900 Active 32 DOM
-
2026-06-14days on market $139,900 Active 30 DOM
-
2026-06-13days on market $139,900 Active 29 DOM
-
2026-06-10days on market $139,900 Active 27 DOM
-
2026-06-09days on market $139,900 Active 26 DOM
-
2026-06-08days on market $139,900 Active 25 DOM
-
2026-06-07days on market $139,900 Active 24 DOM
-
2026-06-05days on market $139,900 Active 21 DOM
-
2026-06-02days on market $139,900 Active 19 DOM
-
2026-06-01days on market $139,900 Active 18 DOM
-
2026-05-31days on market $139,900 Active 17 DOM
-
2026-05-30days on market $139,900 Active 16 DOM
-
2026-05-14$139,900 Active 2392-char remark
ⓘ Source: listings_history table (triggers on properties + properties_extension) + one-shot
backfill from property_details.listing_events for pre-trigger history.
Tax reassessment forecast KY · Resets to sale price
- Current annual tax
- $770 · $64/mo
- Projected year-2 tax
- $1,203 · $100/mo
- Expected delta
- +$434/yr (+$36/mo · 56.4%)
ⓘ Screening estimate from a state-policy table — verify with the county assessor before closing.
Climate risk First Street
- Flood 1/10 Low FEMA zone X (unshaded) · 0% chance over 30 yrs
- Wildfire 2/10 Low
- Heat 5/10 Major 7 d/yr ≥106°F today · 17 d/yr by 30 yrs out
- Wind 2/10 Low 4% chance of damaging wind over 30 yrs
- Air quality 1/10 Low 0 unhealthy d/yr today · 0 by 30 yrs out
Nearby sold comps map
Loading sold comps map…
Walkable amenities ~0.75 mi
Loading nearby amenities…
Taxation est. · year 1
- Rental income
- $17,882
- − Mortgage interest
- −$7,837
- − Property taxes
- −$770
- − Insurance
- −$700
- − Repairs & maintenance
- −$1,431
- − Management
- −$1,431
- − Depreciation
- −$4,070
- Taxable income
- $1,645
- Est. tax owed @ 24.0%
- −$395
- After-tax cash flow
- $3,459/yr
For passive investors: Depreciation is non-cash, so a rental often shows a tax loss while cash-flowing — sheltering income. Rental losses are passive: they offset passive income freely, and up to $25,000/yr can offset ordinary (W-2) income if you actively participate and your MAGI is under $100k (phasing out to $0 by $150k); unused losses carry forward. On sale, claimed depreciation is recaptured at up to 25%, and gains may owe capital-gains tax (a 1031 exchange can defer both). Figures are a year-1 estimate at your 24.0% rate — not tax advice; consult a CPA.
Schools (NCES district)
- District
- Warren County
- NCES district ID
- 2105730
- Math proficiency
- 30% ▼ -18.00%
- Reading proficiency
- 43% ▼ -16.00%
- Median HH income
- $50,092
- Composite
- 31.55/100
- National rank
- #5958
- State rank
- #48 of 165 in KY
Livability — Woodbury
- Score
- 63/100
- State rank
- #315
- US rank
- #15070
Category grades
Schools grade is shown separately in the Schools card above.
Census & demographics
- County
- Warren County · 129,408 people
- Metro
- Bowling Green, KY
- Population (ZIP)
- 65,421
- Household income
- $48,217
- Rent vs Own
- Severe rent burden
- 3855.0
Population outlook (Warren County) Hauer SSP2
- Today (2025)
- 144,620 people
- By 2030
- 155,977 · +7.9%
- By 2040
- 179,381 · +24.0%
- By 2050
- 203,713 · +40.9%
- By 2075
- 267,291 · +84.8%
- By 2100
- 314,019 · +117.1%
Race, ethnicity, and origin ACS 2023
- Neighborhood character
- Predominantly White (68%)
- Race & ethnicity
- White 68% Black 13% Hispanic / Latino 10% Two or more races 7% Asian 3%
- Hispanic origin (detail)
- Mexican 6%
- Common ancestry
- Slovak 2% American 1% Italian 1%
- Foreign-born
- 10% · Canada, Philippines
- Languages at home
- 84% English-only · Spanish 8% Other Asian/Pacific 2% Russian/Polish/Slavic 2%
Political lean MEDSL · Warren
- 2024 margin
- Strong R (+24.3) · D 37.0% · R 61.3% · Other 1.6%
- 2008→2024 swing
- -5.4pp toward R · 2008: -18.9pp · 2024: -24.3pp
- All cycles
- 2024: R+24.3 2020: R+16.8 2016: R+24.2 2012: R+21.8 2008: R+18.9
Not yet ingested
- Civics
- —
Market trends
- HPI YoY
- ▼ -73.34%
- Current HPI
- 277.6554
- Rent YoY
- ▲ 0.28%
- Metro
- Bowling Green, KY
- State GDP YoY
- ▲ 1.81%
- F500 in state
- 4
Industry mix (Fortune 500 HQ in KY)
| Industry | F500 HQs | Revenue |
|---|---|---|
| Healthcare | 1 | $118B |
|
||
| Food / Beverage | 1 | $7B |
|
||
Price history
2 events — show timeline
- 2026-06-16 Pending — RASKMLS
- 2026-05-14 Listed $139,900 RASKMLS
Property tax history
+3.4%/yrLatest (2025): $770 · +16.2% YoY. Source: county tax records.
Cash-flow waterfall
monthlySold comps — $/sqft
last 12 mo · ≤1 miLoading sold comps…