510 W Irving St · Munday, TX
Flood risk 3/10 · Minor
- FEMA flood zone
- —
- Chance of flooding over 30 yrs
- 0.2%
- Est. flood insurance / yr
- —
Fire risk 1/10 · Minimal
- Est. fire insurance / yr
- $1,222 – $2,270
Heat risk 7/10 · Major
- Hot days now (above 108°F)
- 6 days/yr
- Hot days in 30 yrs
- 17 days/yr
Wind risk 3/10 · Minor
- Chance of severe wind over 30 yrs
- 8.0%
Air-quality risk 1/10 · Minimal
- Unhealthy air days now
- 0 days/yr
- Unhealthy air days in 30 yrs
- 0 days/yr
Risk factors via First Street. Map © Google.
Why this score? — see what drove the C- grade
The composite is a weighted blend of 9 inputs, each scored 0–100. Each bar is that input's sub-score; the figure is the points it added to the 100-point composite (weight × sub-score).
- Cash flow +20.7/30.0
- DSCR +6.6/10.0
- 1% rule +6.0/10.0
- Appreciation +5.5/10.0
- Schools +3.6/10.0
- Livability +3.3/5.0
- Rent growth +2.5/5.0
- Condition / age +2.5/5.0
- ARV discount +0.0/15.0
$94,900
🖨 Deal sheet (PDF) 📄 Offer letter ✓ Due diligence
Listing remarks MLS
GREAT INVESTMENT! Looking for small-town living in the quiet town of Munday? This two-bedroom, one-bath home sits on the edge of town with open pasture behind the house. Located in Knox County between Wichita Falls and Abilene, the home features a large dining room, a spacious living area, and a separate utility room. Enjoy the covered front patio and a well-built carport for convenient parking. This is a great starter or investment property offering comfortable West Texas living.
Key facts
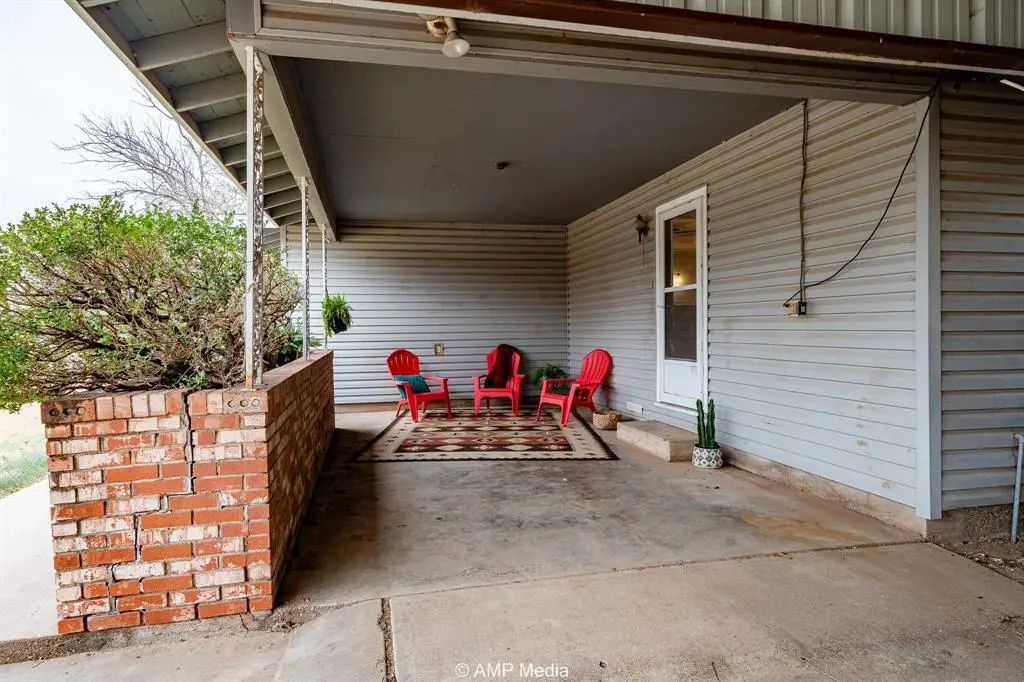
- Well-built carport
- Covered front patio
- 9,148 sq ft lot
Tags
Neighborhood map
What this means for you Summary
Snapshot
- This is a 2-bed/1.0-bath single-family listed at $95k.
Deal economics
- At list price, monthly cash flow is $128 ($2k/yr) — positive.
- The deal already cash-flows at list — no discount required.
- Meets the 1% rule at list price ($1k rent vs $95k).
- Recommended offer: $84k (12.0% below list) — sets the bar for market timing.
Location & tenants
- Location reads 66/100 on livability (#626 in TX) — a middle-class / working-renter tenant base. Strengths: cost of living A+, crime A-, housing B+; Watch: health & safety C-, amenities F, commute F.
- Munday CISD (rural): math 43% / reading 44% proficiency, ranked #326 of 826 in TX (top 40%) — families likely to look elsewhere, expect single-tenant / working-renter base with shorter leases.
- Zoned schools: Munday El (math 57% / reading 52%, grade C, #621 of 4,322 statewide, top 15%, 216 students, 58% FRL); Munday Secondary (math 32% / reading 37%, grade F, #963 of 1,632 statewide, top 61%, 193 students, 61% FRL) — zoned schools at 60% FRL track the district average.
- Market conditions: 18 active listings in the ZIP.
Forward outlook
- In year one you build about $2k of equity ($656 loan paydown + $968 appreciation (1.0% local appreciation)).
- Knox County population projected at +21% by 2050 — long-run rental-demand tailwind backs the buy-and-hold thesis.
- At projected returns (1.0% appreciation + 3.0% rent growth), your $27k cash investment doubles in ~7 years — after that, you're playing with house money.
Negotiation context
- It's been on market 173 days — a 12% lower offer ($84k) is reasonable based on typical stale-listing flexibility.
- 2 sale attempts with the ask held roughly flat each time — persistent listings suggest the price (not the market) is what's stuck; bring a comps-based counter.
Risks & watch-outs
- Watch-outs: built in 1951 — expect roof / HVAC / electrical / plumbing capex.
- Climate carrying-cost: extreme-heat days projected 6→17/yr by 2055 (HVAC capex compounding) — expect insurance premiums to compound above CPI over the hold.
Questions for the listing agent
- It's been on market 173 days. Have you received any prior offers? Is the seller open to a 12% concession, seller financing, or rate buy-down credit?
- Built in 1951 — when were the roof, HVAC, electrical panel, plumbing, and water heater last replaced?
- Why hasn't it sold? Are there any deal-killer items the seller is aware of (foundation, flood, title, zoning, code violations)?
- Is there a deadline driving the sale (1031 exchange, divorce, estate, relocation)? That informs how much negotiation room exists.
- Schools are D-rated, which usually means shorter tenancies and higher turnover. Who's the typical renter profile here, and what's been the actual vacancy rate?
- What's the average days-on-market for RENTAL listings here right now (not sales)? A rising rental-DOM trend means longer vacancies and softer asking-rent achievability than the comps imply.
- What's the recent tenant-quality profile in this submarket — average credit score on applications, eviction rate, late-payment / NSF rate, and stable-employment percentage? A property-management company in the area should have these aggregated.
- How much new for-sale + rental construction is in the pipeline within 1–3 miles? Heavy new supply typically softens prices + rents 12–24 months out; constrained supply supports both.
Investment metrics
- 1% rule
- 1.10% ✓
- Cap rate
- 7.92%
- Cash-on-cash
- 5.80%
- DSCR
- 1.26
- GRM
- 7.6
CMA / ARV
- ARV (median comp)
- $80,327
- List price
- $94,900
- Delta
- 18.14%
- Verdict
- OVERPRICED
- Comps
- 20 within 1.0 mi
Show comp detail 6 sales within ~0.75 mi
| Address | Dist | Beds/Ba | Sqft | Sold | Price | $/sf | Match |
|---|---|---|---|---|---|---|---|
| 1150 W Eden St | 0.36mi | 2/2.0 | 1,392 (+8%) | 6mo | $165,000 | $119 | 61 |
| 420 W D St | 0.61mi | 2/1.0 | 1,216 (-5%) | 6mo | $88,000 | $72 | 58 |
| 311 S Fir Ave | 0.55mi | 3/1.0 (+1) | 1,225 (-5%) | 7mo | $94,000 | $77 | 56 |
| 530 W E St | 0.66mi | 3/2.0 (+1) | 1,296 (+1%) | 11mo | $83,000 | $64 | 49 |
| 231 N 5th Ave | 0.56mi | 2/1.0 | 1,144 (-11%) | 10mo | $94,500 | $83 | 48 |
| 1281 W Eden St | 0.46mi | 3/1.0 (+1) | 1,440 (+12%) | 11mo | $81,000 | $56 | 44 |
Match score weights: distance 35% · size 25% · config 20% · recency 20%. Top-matched comps best support the ARV.
Projected returns pro-forma
1.02% appreciation · 3.0% rent growth · sell at horizon
- IRR
- 7.5%
- Equity multiple
- 1.38×
- Total profit
- $10,087
- Equity at exit
- $32,494
- IRR
- 11.6%
- Equity multiple
- 2.41×
- Total profit
- $37,420
- Equity at exit
- $43,257
Cash invested: $26,572 (down + closing). Projections, not guarantees.
Landlord ↔ Tenant lean methodology
- Overall (STATE)
- 87 Strongly Landlord-Friendly
- State Texas
- 87 Strongly Landlord-Friendly · R+5
- County
- — inherits STATE
- City
- — inherits STATE
ZIP-level market 76371
- Home prices YoY
- 1.0%
- Active inventory
- 18
- Price-to-rent
- 7.6×
Monthly cashflow live
- Estimated rent
- $1,047 medium interval (Pro) →
- Mortgage (P&I)
- −$498
- Tax from tax record
- −$161 /mo · $1,937/yr
- Insurance
- −$40
- HOA
- −$0
- Vacancy / Maint / Mgmt
- −$220
- Net cashflow
- $128
Break-even live
Sensitivity live
| Price | -10% $182 | -5% $155 | +0% $128 | +5% $102 | +10% $75 |
|---|---|---|---|---|---|
| Rent | -10% $46 | -5% $87 | +0% $128 | +5% $170 | +10% $211 |
| Rate | -1.0pp $176 | -0.5pp $153 | base $128 | +0.5pp $104 | +1.0pp $79 |
UW: 25.0% down · 7.5% · 30yr · 1.5% tax · 5.0% vac · 8.0% maint · 8.0% mgmt
Financing live
Cash to close
- Down payment
- $23,725
- Closing costs
- $2,847
- Reserves months
- —
- Total cash needed
- —
Loan-product check · same deal, 3 products live
Conventional
25% down · 7.5% · 30yr
- Down + closing
- —
- Monthly P&I
- —
- Monthly cashflow
- —
- DSCR
- —
- Eligible?
- —
Personal DTI + credit; lowest rate.
DSCR
20% down · 8.5% · 30yr
- Down + closing
- —
- Monthly P&I
- —
- Monthly cashflow
- —
- DSCR
- —
- Eligible?
- —
No personal income docs; deal must DSCR.
Hard money
10% down · 12.0% · 12mo
- Down + closing
- —
- Monthly P&I
- —
- Monthly cashflow
- —
- DSCR
- —
- Eligible?
- —
Short-term bridge; refi at stabilization.
Listing history 23 events
-
2026-06-21days on market $94,900 Active 173 DOM
-
2026-06-21days on market $94,900 Active 172 DOM
-
2026-06-18days on market $94,900 Active 170 DOM
-
2026-06-17days on market $94,900 Active 169 DOM
-
2026-06-16days on market $94,900 Active 168 DOM
-
2026-06-15days on market $94,900 Active 167 DOM
-
2026-06-15days on market $94,900 Active 166 DOM
-
2026-06-13days on market $94,900 Active 165 DOM
-
2026-06-12days on market $94,900 Active 164 DOM
-
2026-06-10days on market $94,900 Active 161 DOM
-
2026-06-08days on market $94,900 Active 160 DOM
-
2026-06-08days on market $94,900 Active 159 DOM
-
2026-06-07days on market $94,900 Active 158 DOM
-
2026-06-03days on market $94,900 Active 155 DOM
-
2026-06-02days on market $94,900 Active 154 DOM
-
2026-06-01days on market $94,900 Active 153 DOM
-
2026-05-31days on market $94,900 Active 152 DOM
-
2026-04-08price $94,900 486-char remark
Show marketing remark (486 chars)
GREAT INVESTMENT! Looking for small-town living in the quiet town of Munday? This two-bedroom, one-bath home sits on the edge of town with open pasture behind the house. Located in Knox County between Wichita Falls and Abilene, the home features a large dining room, a spacious living area, and a separate utility room. Enjoy the covered front patio and a well-built carport for convenient parking. This is a great starter or investment property offering comfortable West Texas living.
-
2025-12-30$99,000 Active 486-char remark
Show marketing remark (486 chars)
GREAT INVESTMENT! Looking for small-town living in the quiet town of Munday? This two-bedroom, one-bath home sits on the edge of town with open pasture behind the house. Located in Knox County between Wichita Falls and Abilene, the home features a large dining room, a spacious living area, and a separate utility room. Enjoy the covered front patio and a well-built carport for convenient parking. This is a great starter or investment property offering comfortable West Texas living.
-
2025-11-22historical
-
2025-10-24price $99,900
-
2025-06-05$110,000 Active
-
2010-08-16soldstatus
ⓘ Source: listings_history table (triggers on properties + properties_extension) + one-shot
backfill from property_details.listing_events for pre-trigger history.
Tax reassessment forecast TX · Resets to sale price
- Current annual tax
- $1,937 · $161/mo
- Projected year-2 tax
- $1,937 · $161/mo
- Expected delta
- $0/yr ($0/mo · 0.0%)
ⓘ Screening estimate from a state-policy table — verify with the county assessor before closing.
Climate risk First Street
- Flood 3/10 Moderate 20% chance over 30 yrs
- Wildfire 1/10 Low
- Heat 7/10 Severe 6 d/yr ≥108°F today · 17 d/yr by 30 yrs out
- Wind 3/10 Moderate 8% chance of damaging wind over 30 yrs
- Air quality 1/10 Low 0 unhealthy d/yr today · 0 by 30 yrs out
Nearby sold comps map
Loading sold comps map…
Walkable amenities ~0.75 mi
Loading nearby amenities…
Taxation est. · year 1
- Rental income
- $12,563
- − Mortgage interest
- −$5,316
- − Property taxes
- −$1,937
- − Insurance
- −$474
- − Repairs & maintenance
- −$1,005
- − Management
- −$1,005
- − Depreciation
- −$2,761
- Taxable income
- $65
- Est. tax owed @ 24.0%
- −$15
- After-tax cash flow
- $1,526/yr
For passive investors: Depreciation is non-cash, so a rental often shows a tax loss while cash-flowing — sheltering income. Rental losses are passive: they offset passive income freely, and up to $25,000/yr can offset ordinary (W-2) income if you actively participate and your MAGI is under $100k (phasing out to $0 by $150k); unused losses carry forward. On sale, claimed depreciation is recaptured at up to 25%, and gains may owe capital-gains tax (a 1031 exchange can defer both). Figures are a year-1 estimate at your 24.0% rate — not tax advice; consult a CPA.
Schools (NCES district)
- District
- Munday CISD
- NCES district ID
- 4831970
- Math proficiency
- 43% ▼ -2.00%
- Reading proficiency
- 44% ▲ 9.00%
- Median HH income
- $37,618
- Composite
- 36.22/100
- National rank
- #4727
- State rank
- #326 of 826 in TX
Livability — Munday
- Score
- 66/100
- State rank
- #626
- US rank
- #11937
Category grades
Schools grade is shown separately in the Schools card above.
Census & demographics
- Census place
- Munday, TX
- Population (ZIP)
- 1,801
Population outlook (Knox County) Hauer SSP2
- Today (2025)
- 4,136 people
- By 2030
- 4,291 · +3.7%
- By 2040
- 4,655 · +12.5%
- By 2050
- 5,005 · +21.0%
- By 2075
- 6,051 · +46.3%
- By 2100
- 6,427 · +55.4%
Race, ethnicity, and origin ACS 2023
- Neighborhood character
- Majority White (54%)
- Race & ethnicity
- White 54% Hispanic / Latino 40% Two or more races 22%
- Hispanic origin (detail)
- Mexican 38%
- Common ancestry
- Subsaharan African 4% Iranian 2% Slovak 1%
- Foreign-born
- 9% · Canada
- Languages at home
- 74% English-only · Spanish 26%
Political lean MEDSL · Knox
- 2024 margin
- Solid R (+68.5) · D 15.6% · R 84.0%
- 2008→2024 swing
- -23.2pp toward R · 2008: -45.2pp · 2024: -68.5pp
- All cycles
- 2024: R+68.5 2020: R+62.8 2016: R+61.2 2012: R+54.8 2008: R+45.2
Not yet ingested
- Civics
- —
Market trends
- HPI YoY
- ▲ 1.02%
- Current HPI
- 103.0505
- Rent YoY
- —
- Metro
- —
- State GDP YoY
- ▲ 3.95%
- F500 in state
- 110
Industry mix (Fortune 500 HQ in TX)
| Industry | F500 HQs | Revenue |
|---|---|---|
| Energy | 16 | $1,198B |
|
||
| Technology | 5 | $198B |
|
||
| Engineering / Construction | 4 | $72B |
|
||
| Energy Services | 3 | $60B |
|
||
| Utilities | 3 | $41B |
|
||
| Healthcare | 2 | $330B |
|
||
Price history
-13.7% since first listed6 events — show timeline
- 2026-04-08 Price Changed $94,900 NTREIS
- 2025-12-30 Listed $99,000 NTREIS
- 2025-11-22 Listing Removed — NTREIS
- 2025-10-24 Price Changed $99,900 NTREIS
- 2025-06-05 Listed $110,000 NTREIS
- 2010-08-16 Sold (Public Records) — Public Records
Property tax history
+6.4%/yrLatest (2025): $1,937 · +41.8% YoY. Source: county tax records.
Cash-flow waterfall
monthlySold comps — $/sqft
last 12 mo · ≤1 miLoading sold comps…