 Multi-family
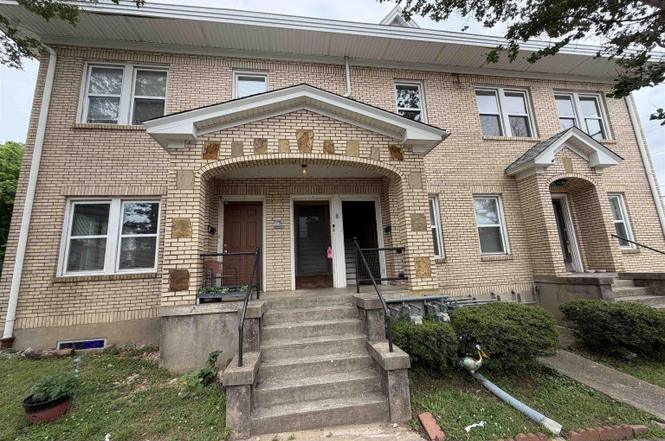
200 Hawthorne St · Hot Springs, AR
Flood risk 1/10 · Minimal
- FEMA flood zone
- X (unshaded)
- Chance of flooding over 30 yrs
- 0.0%
- Est. flood insurance / yr
- $507 – $1,088
Fire risk 3/10 · Minor
- Est. fire insurance / yr
- $1,499 – $2,785
Heat risk 6/10 · Moderate
- Hot days now (above 111°F)
- 8 days/yr
- Hot days in 30 yrs
- 22 days/yr
Wind risk 4/10 · Minor
- Chance of severe wind over 30 yrs
- 9.0%
Air-quality risk 1/10 · Minimal
- Unhealthy air days now
- 0 days/yr
- Unhealthy air days in 30 yrs
- 0 days/yr
Risk factors via First Street. Map © Google.
Why this score? — see what drove the C+ grade
The composite is a weighted blend of 9 inputs, each scored 0–100. Each bar is that input's sub-score; the figure is the points it added to the 100-point composite (weight × sub-score).
- Cash flow +30.0/30.0
- 1% rule +10.0/10.0
- DSCR +10.0/10.0
- Livability +3.2/5.0
- Rent growth +2.5/5.0
- Condition / age +2.5/5.0
- Schools +2.0/10.0
- ARV discount +0.0/15.0
- Appreciation +0.0/10.0
$550,000
🖨 Deal sheet 📄 Offer letter ✓ Due diligence
Multi-family units
County records classify this as Multi-Family (5+ Unit). Listing-text estimate: 1 unit. estimate disagrees with records
5+ unit building — per-unit beds/baths from public records are typically unavailable; the breakdown below (if shown) is an estimate from the listing text.
Listing remarks
Welcome to 200 Hawthorne, a rare opportunity to own a beautifully maintained multi-family investment property in the heart of Hot Springs. Constructed in 1945, this solidly built six-unit apartment building offers timeless character, strong rental appeal, and dependable long-term cash flow. The property consists of four 2 bedroom, 1 bath units and two 1 bedroom, 1 bath units. All apartments are equipped with either central heating and cooling or mini-split systems for tenant comfort and efficiency. Inside, tenants enjoy classic architectural details including hardwood floors, French doors, and spacious well-designed floorplans that continue to make this a highly desirable place to live. Pos
Key facts
- Mini-split systems
- French doors
- Hardwood floors
Tags
Property features AI
Exterior
- Utilities: Natural gas available
- Home design: Residential income property; Multi-family (apartment); 2 stories
- Construction: Brick construction; Slab foundation; Shingle roof; Built with insulated windows
- Exterior features: Patio; Porch; Corner lot; Level lot; Sloped lot; Wooded lot
Interior
- Kitchen: Electric range; Cooktop
- Flooring: Tile; Wood
- Interior features: Insulated windows; Has basement; Has a view
- Laundry & utility: Electric water heater
Neighborhood map
What this means for you Summary
Snapshot
- This is a multifamily listed at $550k.
Deal economics
- At list price, monthly cash flow is $3k ($33k/yr) — positive.
- The deal already cash-flows at list — no discount required.
- Meets the 1% rule at list price ($8k rent vs $550k).
- Recommended offer: $534k (3.0% below list) — sets the bar for market timing.
- Cap rate 12.2% vs local median 2.8% in Hot Springs — top-decile yield for the area; either an underpriced asset or a hidden risk that comps aren't pricing in. Stress-test before assuming the spread holds.
Location & tenants
- Location reads 65/100 on livability (#140 in AR) — a middle-class / working-renter tenant base. Strengths: cost of living A+, housing A+, health & safety A-; Watch: schools D, crime F, amenities F.
- Hot Springs School District (urban): math 24% / reading 25% proficiency, ranked #195 of 238 in AR (top 82%) — low school quality limits family demand, transient renter base, plan for 1-2y turnover; 72% free/reduced lunch — lower-income household profile, screen leases tightly.
- Market conditions: 363 active listings in the ZIP; 117 units permitted in Garland County in 2024 (24 in 5+ unit buildings).
- At $8,259/mo this rent would consume 185% of the median local household income ($54k/yr) (locally 961% of renters already pay >50% of income on rent) — very limited rent-growth headroom before tenants either downsize or default.
Forward outlook
- Local home prices are declining (-3.0%/yr); year-one equity from $4k of loan paydown is wiped out by about $16k of value loss. Plan a longer hold.
- Garland County population projected at +7% by 2050 — modest demand growth; plan on rents tracking national, not racing it.
- At projected returns (-3.0% appreciation + 3.0% rent growth), your $154k cash investment doubles in ~6 years — after that, you're playing with house money.
Negotiation context
- It's been on market 43 days — a 3% lower offer ($534k) is reasonable based on typical stale-listing flexibility.
- 10 sale attempts since 14y ago with the ask held roughly flat each time — persistent listings suggest the price (not the market) is what's stuck; bring a comps-based counter.
- Current owner paid $315k; list at $550k implies a 75% gain — meaningful room to come down on a strong offer.
Risks & watch-outs
- Watch-outs: built in 1945 — expect roof / HVAC / electrical / plumbing capex.
- Climate carrying-cost: extreme-heat days projected 8→22/yr by 2055 (HVAC capex compounding) — expect insurance premiums to compound above CPI over the hold.
Questions for the listing agent
- It's been on market 43 days. Have you received any prior offers? Is the seller open to a 3% concession, seller financing, or rate buy-down credit?
- Built in 1945 — when were the roof, HVAC, electrical panel, plumbing, and water heater last replaced?
- Is there a deadline driving the sale (1031 exchange, divorce, estate, relocation)? That informs how much negotiation room exists.
- Schools are D-rated, which usually means shorter tenancies and higher turnover. Who's the typical renter profile here, and what's been the actual vacancy rate?
- Crime grade is F in this area — have there been break-ins, vandalism, or insurance claims at this property in the last 3 years? What carrier currently insures it and at what premium?
- What's the average days-on-market for RENTAL listings here right now (not sales)? A rising rental-DOM trend means longer vacancies and softer asking-rent achievability than the comps imply.
- What's the recent tenant-quality profile in this submarket — average credit score on applications, eviction rate, late-payment / NSF rate, and stable-employment percentage? A property-management company in the area should have these aggregated.
- How much new apartment / multifamily construction is in the pipeline within 1–3 miles? Heavy new supply (>2% of stock underway) typically softens rents 12–24 months out; light construction supports rent growth.
Investment metrics
- 1% rule
- 1.50% ✓
- Cap rate
- 12.24%
- Cash-on-cash
- 21.22%
- DSCR
- 1.94
- GRM
- 5.5
CMA / ARV
- ARV (on-the-fly)
- $417,100
- Comps found
- 1
Show comp detail 1 sale within ~0.75 mi
| Address | Dist | Beds/Ba | Sqft | Sold | Price | $/sf | Match |
|---|---|---|---|---|---|---|---|
| 400 & 402 Quapaw | 0.23mi | 15/— | 10,546 (+9%) | 20mo | $450,000 | $43 | 58 |
Match score weights: distance 35% · size 25% · config 20% · recency 20%. Top-matched comps best support the ARV.
Projected returns pro-forma
-3.0% appreciation · 3.0% rent growth · sell at horizon
- IRR
- 13.7%
- Equity multiple
- 1.55×
- Total profit
- $84,474
- Equity at exit
- $82,007
- IRR
- 22.6%
- Equity multiple
- 2.93×
- Total profit
- $297,439
- Equity at exit
- $47,554
Cash invested: $154,000 (down + closing). Projections, not guarantees.
Landlord ↔ Tenant lean methodology
- Overall (STATE)
- 92 Strongly Landlord-Friendly
- State Arkansas
- 92 Strongly Landlord-Friendly · R+14
- County
- — inherits STATE
- City
- — inherits STATE
ZIP-level market 71901
- Home prices YoY
- -3.6%
- Active inventory
- 363
- Price-to-rent
- 31.0×
Monthly cashflow live
- Estimated rent
- $8,259 high interval (Pro) →
- Mortgage (P&I)
- −$2,884
- Tax est. 1.5%
- −$688 /mo · $8,250/yr
- Insurance
- −$229
- HOA
- −$0
- Vacancy / Maint / Mgmt
- −$1,734
- Net cashflow
- $2,724
Break-even live
6-unit breakdown (identical units grouped — click to expand)
| Units | Beds | Baths | Est. rent |
|---|---|---|---|
| 4× units | 2 | 1 | $5,916 |
| #1 | 2 | 1 | $1,479 |
| #2 | 2 | 1 | $1,479 |
| #3 | 2 | 1 | $1,479 |
| #4 | 2 | 1 | $1,479 |
| 2× units | 1 | 1 | $2,344 |
| #5 | 1 | 1 | $1,172 |
| #6 | 1 | 1 | $1,172 |
| Total (6 units) | $8,259 | ||
UW: 25.0% down · 7.5% · 30yr · 1.5% tax · 5.0% vac · 8.0% maint · 8.0% mgmt
Financing live
Cash to close
- Down payment
- $137,500
- Closing costs
- $16,500
- Reserves months
- —
- Total cash needed
- —
Loan-product check · same deal, 3 products live
Conventional
25% down · 7.5% · 30yr
- Down + closing
- —
- Monthly P&I
- —
- Monthly cashflow
- —
- DSCR
- —
- Eligible?
- —
Personal DTI + credit; lowest rate.
DSCR
20% down · 8.5% · 30yr
- Down + closing
- —
- Monthly P&I
- —
- Monthly cashflow
- —
- DSCR
- —
- Eligible?
- —
No personal income docs; deal must DSCR.
Hard money
10% down · 12.0% · 12mo
- Down + closing
- —
- Monthly P&I
- —
- Monthly cashflow
- —
- DSCR
- —
- Eligible?
- —
Short-term bridge; refi at stabilization.
Listing history 43 events
-
2026-06-19days on market $550,000 Active 43 DOM
-
2026-06-18days on market $550,000 Active 42 DOM
-
2026-06-17days on market $550,000 Active 41 DOM
-
2026-06-17status $550,000 Active 40 DOM
-
2026-06-16days on market $550,000 Active Under Contract 40 DOM
-
2026-06-15days on market $550,000 Active Under Contract 39 DOM
-
2026-06-14days on market $550,000 Active Under Contract 37 DOM
-
2026-06-13days on market $550,000 Active Under Contract 36 DOM
-
2026-06-10days on market $550,000 Active Under Contract 34 DOM
-
2026-06-09days on market $550,000 Active Under Contract 33 DOM
-
2026-06-08days on market $550,000 Active Under Contract 32 DOM
-
2026-06-07days on market $550,000 Active Under Contract 31 DOM
-
2026-06-05days on market $550,000 Active Under Contract 28 DOM
-
2026-06-02days on market $550,000 Active Under Contract 26 DOM
-
2026-06-01days on market $550,000 Active Under Contract 25 DOM
-
2026-05-31days on market $550,000 Active Under Contract 24 DOM
-
2026-05-30days on market $550,000 Active Under Contract 23 DOM
-
2026-05-09historical Active Under Contract
-
2026-05-08$550,000 Active
-
2025-07-08historical
-
2025-05-09price $725,000
-
2025-05-08price $725,000
-
2025-02-21price $675,000
-
2025-02-20price $675,000
-
2024-12-04historical $1,175
-
2024-12-04$1,175
-
2024-07-07$617,000 New Listing
-
2024-05-02historical
-
2023-11-01$625,000 New Listing
-
2023-06-02historical
-
2022-11-30price $799,000
-
2022-06-01$699,000 New Listing
-
2019-08-12historical
-
2019-02-11$575,000 New Listing
-
2018-06-25soldstatus $315,000
-
2018-05-13$315,000
-
2016-04-29soldstatus $247,000 Sold
-
2016-02-22historical Take Backups
-
2016-02-08status Back on Market
-
2016-01-07historical Take Backups
-
2015-08-07$350,000 New Listing
-
2012-12-07soldstatus $97,000
-
2012-02-24$175,000
ⓘ Source: listings_history table (triggers on properties + properties_extension) + one-shot
backfill from property_details.listing_events for pre-trigger history.
Climate risk First Street
- Flood 1/10 Low FEMA zone X (unshaded) · 0% chance over 30 yrs
- Wildfire 3/10 Moderate
- Heat 6/10 Major 8 d/yr ≥111°F today · 22 d/yr by 30 yrs out
- Wind 4/10 Moderate 9% chance of damaging wind over 30 yrs
- Air quality 1/10 Low 0 unhealthy d/yr today · 0 by 30 yrs out
Nearby sold comps map
Loading sold comps map…
Walkable amenities ~0.75 mi
Loading nearby amenities…
Taxation est. · year 1
- Rental income
- $99,108
- − Mortgage interest
- −$30,809
- − Property taxes
- −$8,250
- − Insurance
- −$2,750
- − Repairs & maintenance
- −$7,929
- − Management
- −$7,929
- − Depreciation
- −$16,000
- Taxable income
- $25,442
- Est. tax owed @ 24.0%
- −$6,106
- After-tax cash flow
- $26,578/yr
For passive investors: Depreciation is non-cash, so a rental often shows a tax loss while cash-flowing — sheltering income. Rental losses are passive: they offset passive income freely, and up to $25,000/yr can offset ordinary (W-2) income if you actively participate and your MAGI is under $100k (phasing out to $0 by $150k); unused losses carry forward. On sale, claimed depreciation is recaptured at up to 25%, and gains may owe capital-gains tax (a 1031 exchange can defer both). Figures are a year-1 estimate at your 24.0% rate — not tax advice; consult a CPA.
Schools (NCES district)
- District
- Hot Springs School District
- NCES district ID
- 0507890
- Math proficiency
- 24% ▼ -15.00%
- Reading proficiency
- 25% ▼ -12.00%
- Median HH income
- $28,817
- Composite
- 19.62/100
- National rank
- #8746
- State rank
- #195 of 238 in AR
Livability — Hot Springs
- Score
- 65/100
- State rank
- #140
- US rank
- #12498
Category grades
Schools grade is shown separately in the Schools card above.
Census & demographics
- Census place
- Hot Springs, AR
- County
- Garland County · 76,414 people
- City population
- 76,414
- Metro
- Hot Springs, AR
- Population (ZIP)
- 28,937
- Household income
- $53,514
- Rent vs Own
- Severe rent burden
- 961.0
Population outlook (Garland County) Hauer SSP2
- Today (2025)
- 100,343 people
- By 2030
- 101,880 · +1.5%
- By 2040
- 104,804 · +4.4%
- By 2050
- 107,292 · +6.9%
- By 2075
- 113,182 · +12.8%
- By 2100
- 112,247 · +11.9%
Race, ethnicity, and origin ACS 2023
- Neighborhood character
- Predominantly White (71%)
- Race & ethnicity
- White 71% Black 13% Hispanic / Latino 10% Two or more races 6%
- Hispanic origin (detail)
- Mexican 7%
- Common ancestry
- Italian 2% Slovak 2% Portuguese 1%
- Foreign-born
- 5% · Canada, Vietnam
- Languages at home
- 90% English-only · Spanish 7% Vietnamese 1%
Political lean MEDSL · Garland
- 2024 margin
- Solid R (+36.2) · D 30.8% · R 67.0% · Other 2.2%
- 2008→2024 swing
- -11.3pp toward R · 2008: -25.0pp · 2024: -36.2pp
- All cycles
- 2024: R+36.2 2020: R+34.0 2016: R+34.1 2012: R+29.9 2008: R+25.0
Not yet ingested
- Civics
- —
Market trends
- HPI YoY
- ▼ -11.75%
- Current HPI
- 317.2542
- Rent YoY
- —
- Metro
- Hot Springs, AR
- State GDP YoY
- ▲ 3.80%
- F500 in state
- 10
Industry mix (Fortune 500 HQ in AR)
| Industry | F500 HQs | Revenue |
|---|---|---|
| Retail | 1 | $681B |
|
||
| Food / Agriculture | 1 | $53B |
|
||
| Retail / Energy | 1 | $22B |
|
||
| Transportation / Logistics | 1 | $12B |
|
||
| Energy | 1 | $4B |
|
||
Price history
+214.3% since first listed26 events — show timeline
- 2026-05-09 Contingent — HSBOR
- 2026-05-08 Listed $550,000 HSBOR
- 2025-07-08 Listing Removed — CARMLS
- 2025-05-09 Price Changed $725,000 CARMLS
- 2025-05-08 Price Changed $725,000 HSBOR
- 2025-02-21 Price Changed $675,000 CARMLS
- 2025-02-20 Price Changed $675,000 HSBOR
- 2024-12-04 Rental Removed $1,175 LEASESTAR
- 2024-12-04 Listed for Rent $1,175 LEASESTAR
- 2024-07-07 Listed $617,000 CARMLS
- 2024-05-02 Listing Removed — CARMLS
- 2023-11-01 Listed $625,000 CARMLS
- 2023-06-02 Listing Removed — CARMLS
- 2022-11-30 Price Changed $799,000 CARMLS
- 2022-06-01 Listed $699,000 CARMLS
- 2019-08-12 Listing Removed — CARMLS
- 2019-02-11 Listed $575,000 CARMLS
- 2018-06-25 Sold (MLS) $315,000 HSBOR
- 2018-05-13 Listed $315,000 HSBOR
- 2016-04-29 Sold (MLS) $247,000 CARMLS
- 2016-02-22 Contingent — CARMLS
- 2016-02-08 Relisted — CARMLS
- 2016-01-07 Contingent — CARMLS
- 2015-08-07 Listed $350,000 CARMLS
- 2012-12-07 Sold (MLS) $97,000 CARMLS
- 2012-02-24 Listed $175,000 CARMLS
Cash-flow waterfall
monthlySold comps — $/sqft
last 12 mo · ≤1 miLoading sold comps…