 Fourplex
7632 Pleasant Ave · Richfield, MN
Flood risk 1/10 · Minimal
- FEMA flood zone
- X (unshaded)
- Chance of flooding over 30 yrs
- 0.0%
- Est. flood insurance / yr
- $507 – $1,088
Fire risk 1/10 · Minimal
- Est. fire insurance / yr
- $888 – $1,650
Heat risk 2/10 · Minimal
- Hot days now (above 99°F)
- 7 days/yr
- Hot days in 30 yrs
- 14 days/yr
Wind risk 2/10 · Minimal
- Chance of severe wind over 30 yrs
- —
Air-quality risk 2/10 · Minimal
- Unhealthy air days now
- 1 days/yr
- Unhealthy air days in 30 yrs
- 1 days/yr
Risk factors via First Street. Map © Google.
Why this score? — see what drove the C- grade
The composite is a weighted blend of 9 inputs, each scored 0–100. Each bar is that input's sub-score; the figure is the points it added to the 100-point composite (weight × sub-score).
- Cash flow +20.4/30.0
- ARV discount +7.5/15.0
- DSCR +6.5/10.0
- 1% rule +5.4/10.0
- Livability +4.2/5.0
- Rent growth +3.2/5.0
- Schools +2.9/10.0
- Condition / age +2.5/5.0
- Appreciation +0.0/10.0
$599,900
🖨 Deal sheet 📄 Offer letter ✓ Due diligence
Multi-family units
County records classify this as Multi-Family (5+ Unit). Listing-text estimate: 4 units. estimate disagrees with records
5+ unit building — per-unit beds/baths from public records are typically unavailable; the breakdown below (if shown) is an estimate from the listing text.
Listing remarks MLS
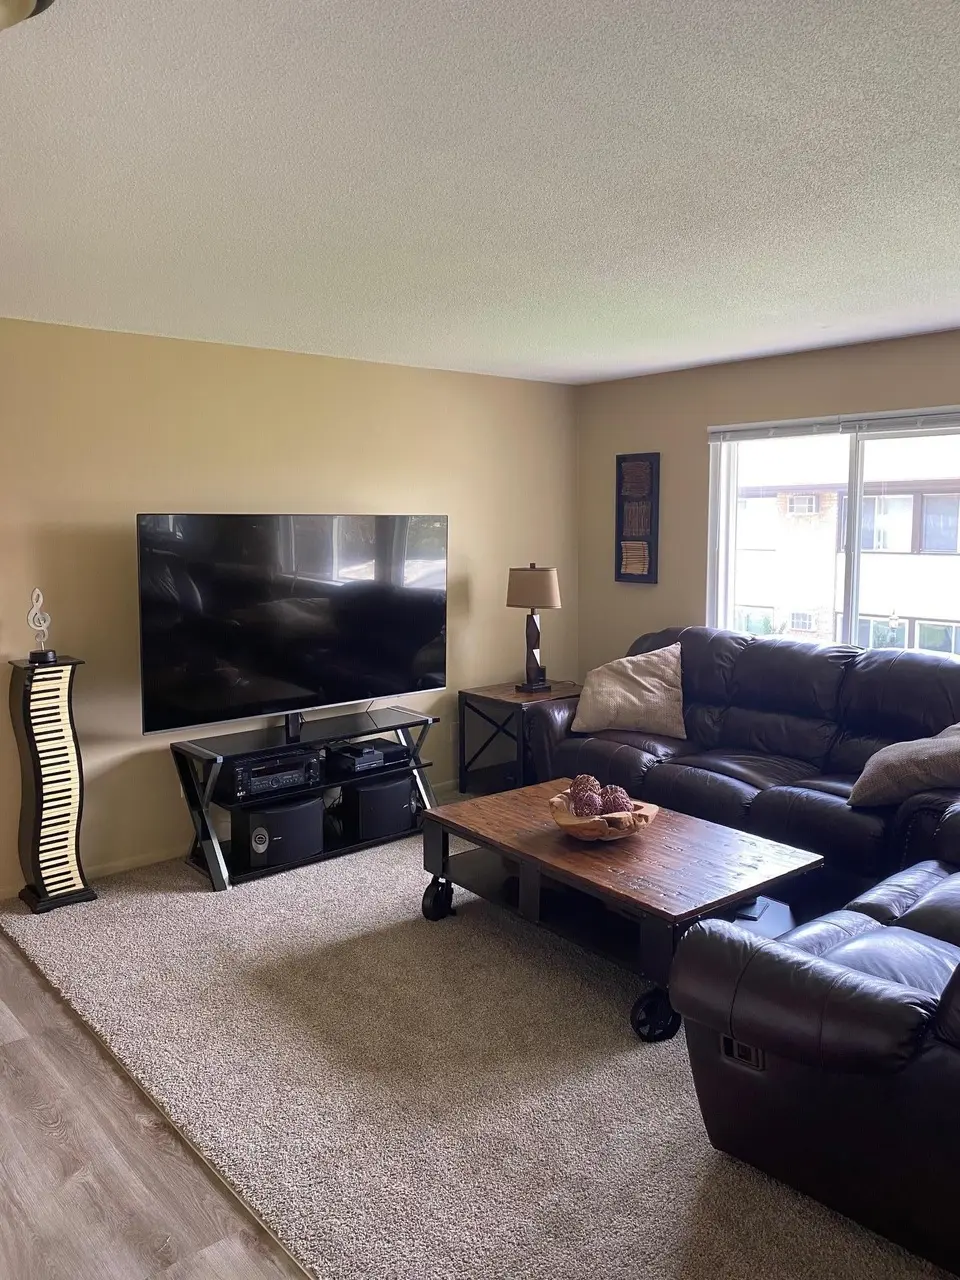
Rarely available fourplex in a highly convenient Richfield location offering strong rental demand and long-term tenants. This well-maintained property features three 2-bedroom units and one 1-bedroom unit, making it an ideal addition to an investor’s portfolio, owner occupant or a great opportunity for a first-time multifamily buyer looking to build passive income. Recent capital improvements provide peace of mind, including a new boiler (2025), newer windows and a complete remodel of Unit 2 in 2024 featuring new carpet, fresh paint, new blinds, new living room windows, updated kitchen cabinets, countertops, appliances, and remodeled bathroom with tile tub/shower. The property benefits from month-to-month leases with long-term tenants and historically low turnover, helping provide consistent income and flexibility for future rent adjustments. Located in Southwest Richfield, the property offers excellent accessibility to major highways, shopping, restaurants, and parks, and is just minutes from the Mall of America and MSP Airport, making it an attractive location for renters. The neighborhood also offers strong amenities and transportation access, further supporting long-term rental demand.
Key facts
- New boiler
- New carpet
- Newer windows
Tags
Neighborhood map
What this means for you Summary
Snapshot
- This is a 3×2bd/1ba + 1×1bd/1ba units multifamily listed at $600k.
Deal economics
- At list price, monthly cash flow is $778 ($9k/yr) — positive. Per door: $194/mo.
- The deal already cash-flows at list — no discount required.
- Meets the 1% rule at list price ($6k rent vs $600k).
- Recommended offer: $564k (6.0% below list) — sets the bar for market timing.
- Cap rate 7.8% vs local median 3.6% in Richfield — top-decile yield for the area; either an underpriced asset or a hidden risk that comps aren't pricing in. Stress-test before assuming the spread holds.
Location & tenants
- Location reads 85/100 on livability (#22 in MN, #599 nationally) — a professional / high-income tenant draw. Strengths: commute A+, housing A+, employment A; Watch: crime C-.
- Richfield Public School District (suburban): math 27% / reading 38% proficiency, ranked #262 of 301 in MN (top 87%) — families likely to look elsewhere, expect single-tenant / working-renter base with shorter leases.
- Market conditions: Rents rising (+2.7%/yr); 155 active listings in the ZIP; solid renter incomes; 4,651 units permitted in Hennepin County in 2024 (2,443 in 5+ unit buildings).
- At $6,224/mo this rent would consume 88% of the median local household income ($85k/yr) (locally 1472% of renters already pay >50% of income on rent) — very limited rent-growth headroom before tenants either downsize or default.
Forward outlook
- Local home prices are declining (-3.0%/yr); year-one equity from $4k of loan paydown is wiped out by about $18k of value loss. Plan a longer hold.
- Hennepin County population projected at +30% by 2050 — long-run rental-demand tailwind backs the buy-and-hold thesis.
Negotiation context
- It's been on market 69 days — a 6% lower offer ($564k) is reasonable based on typical stale-listing flexibility.
- 2 sale attempts since 17y ago with the ask held roughly flat each time — persistent listings suggest the price (not the market) is what's stuck; bring a comps-based counter.
- Current owner paid $486k; 23% above their basis — modest negotiation headroom, anchor on the comps not their cost.
Questions for the listing agent
- It's been on market 69 days. Have you received any prior offers? Is the seller open to a 6% concession, seller financing, or rate buy-down credit?
- Can we see the unit-by-unit rent roll, current vacancy, and any below-market leases? What's the average tenancy length?
- What capital expenditures (roof, boiler, parking lot, exteriors) have been made in the last 5 years, and what's planned in the next 2?
- Built in 1966 — when were the roof, HVAC, electrical panel, plumbing, and water heater last replaced?
- Why hasn't it sold? Are there any deal-killer items the seller is aware of (foundation, flood, title, zoning, code violations)?
- Is there a deadline driving the sale (1031 exchange, divorce, estate, relocation)? That informs how much negotiation room exists.
- What's the average days-on-market for RENTAL listings here right now (not sales)? A rising rental-DOM trend means longer vacancies and softer asking-rent achievability than the comps imply.
- What's the recent tenant-quality profile in this submarket — average credit score on applications, eviction rate, late-payment / NSF rate, and stable-employment percentage? A property-management company in the area should have these aggregated.
- How much new apartment / multifamily construction is in the pipeline within 1–3 miles? Heavy new supply (>2% of stock underway) typically softens rents 12–24 months out; light construction supports rent growth.
Investment metrics
- 1% rule
- 1.04% ✓
- Cap rate
- 7.85%
- Cash-on-cash
- 5.56%
- DSCR
- 1.25
- GRM
- 8.0
CMA / ARV
No comps found within radius.
Projected returns pro-forma
-3.0% appreciation · 2.7% rent growth · sell at horizon
- IRR
- -8.0%
- Equity multiple
- 0.71×
- Total profit
- $-49,462
- Equity at exit
- $89,447
- IRR
- 1.1%
- Equity multiple
- 1.08×
- Total profit
- $13,434
- Equity at exit
- $51,868
Cash invested: $167,972 (down + closing). Projections, not guarantees.
Landlord ↔ Tenant lean methodology
- Overall (STATE)
- 46 Balanced
- State Minnesota
- 46 Balanced · D+2
- County
- — inherits STATE
- City
- — inherits STATE
ZIP-level market 55423
- Rents YoY
- 2.7%
- Active inventory
- 155
- Price-to-rent
- 30.5×
Monthly cashflow live
- Estimated rent
- $6,224 high interval (Pro) →
- Mortgage (P&I)
- −$3,146
- Tax from tax record
- −$743 /mo · $8,921/yr
- Insurance
- −$250
- HOA
- −$0
- Vacancy / Maint / Mgmt
- −$1,307
- Net cashflow
- $778
Break-even live
4-unit breakdown (identical units grouped — click to expand)
| Units | Beds | Baths | Est. rent |
|---|---|---|---|
| 3× units | 2 | 1 | $4,914 |
| #1 | 2 | 1 | $1,638 |
| #2 | 2 | 1 | $1,638 |
| #3 | 2 | 1 | $1,638 |
| 1× unit | 1 | 1 | $1,311 |
| Total (4 units) | $6,224 | ||
UW: 25.0% down · 7.5% · 30yr · 1.5% tax · 5.0% vac · 8.0% maint · 8.0% mgmt
Financing live
Cash to close
- Down payment
- $149,975
- Closing costs
- $17,997
- Reserves months
- —
- Total cash needed
- —
Loan-product check · same deal, 3 products live
Conventional
25% down · 7.5% · 30yr
- Down + closing
- —
- Monthly P&I
- —
- Monthly cashflow
- —
- DSCR
- —
- Eligible?
- —
Personal DTI + credit; lowest rate.
DSCR
20% down · 8.5% · 30yr
- Down + closing
- —
- Monthly P&I
- —
- Monthly cashflow
- —
- DSCR
- —
- Eligible?
- —
No personal income docs; deal must DSCR.
Hard money
10% down · 12.0% · 12mo
- Down + closing
- —
- Monthly P&I
- —
- Monthly cashflow
- —
- DSCR
- —
- Eligible?
- —
Short-term bridge; refi at stabilization.
Listing history 23 events
-
2026-06-18days on market $599,900 Active 69 DOM
-
2026-06-17days on market $599,900 Active 68 DOM
-
2026-06-16days on market $599,900 Active 67 DOM
-
2026-06-15days on market $599,900 Active 66 DOM
-
2026-06-13days on market $599,900 Active 64 DOM
-
2026-06-13days on market $599,900 Active 63 DOM
-
2026-06-09days on market $599,900 Active 60 DOM
-
2026-06-08days on market $599,900 Active 59 DOM
-
2026-06-07days on market $599,900 Active 58 DOM
-
2026-06-04days on market $599,900 Active 55 DOM
-
2026-06-03days on market $599,900 Active 54 DOM
-
2026-06-02days on market $599,900 Active 53 DOM
-
2026-06-01days on market $599,900 Active 52 DOM
-
2026-05-31days on market $599,900 Active 51 DOM
-
2026-05-04price $614,990 1215-char remark
Show marketing remark (1215 chars)
Rarely available fourplex in a highly convenient Richfield location offering strong rental demand and long-term tenants. This well-maintained property features three 2-bedroom units and one 1-bedroom unit, making it an ideal addition to an investor’s portfolio, owner occupant or a great opportunity for a first-time multifamily buyer looking to build passive income. Recent capital improvements provide peace of mind, including a new boiler (2025), newer windows and a complete remodel of Unit 2 in 2024 featuring new carpet, fresh paint, new blinds, new living room windows, updated kitchen cabinets, countertops, appliances, and remodeled bathroom with tile tub/shower. The property benefits from month-to-month leases with long-term tenants and historically low turnover, helping provide consistent income and flexibility for future rent adjustments. Located in Southwest Richfield, the property offers excellent accessibility to major highways, shopping, restaurants, and parks, and is just minutes from the Mall of America and MSP Airport, making it an attractive location for renters. The neighborhood also offers strong amenities and transportation access, further supporting long-term rental demand.
-
2026-04-10$624,999 Active 1215-char remark
Show marketing remark (1215 chars)
Rarely available fourplex in a highly convenient Richfield location offering strong rental demand and long-term tenants. This well-maintained property features three 2-bedroom units and one 1-bedroom unit, making it an ideal addition to an investor’s portfolio, owner occupant or a great opportunity for a first-time multifamily buyer looking to build passive income. Recent capital improvements provide peace of mind, including a new boiler (2025), newer windows and a complete remodel of Unit 2 in 2024 featuring new carpet, fresh paint, new blinds, new living room windows, updated kitchen cabinets, countertops, appliances, and remodeled bathroom with tile tub/shower. The property benefits from month-to-month leases with long-term tenants and historically low turnover, helping provide consistent income and flexibility for future rent adjustments. Located in Southwest Richfield, the property offers excellent accessibility to major highways, shopping, restaurants, and parks, and is just minutes from the Mall of America and MSP Airport, making it an attractive location for renters. The neighborhood also offers strong amenities and transportation access, further supporting long-term rental demand.
-
2021-05-05soldstatus $486,000
-
2014-09-16soldstatus $125,000
-
2009-08-05soldstatus $208,900 184-char remark
Show marketing remark (184 chars)
4-PLEX, 3 UNITS OCCUPIED. ONE 1 BEDROOM UNIT AND THREE 2 BEDROOM UNITS. NEEDS COSMETICS AND REPAIRS. CONVENIENT LOCATION. BUYERS TO VERIFY ALL INFORMATION. SOLD AS-IS. NO WARRANTIES.
-
2009-07-25historical 184-char remark
Show marketing remark (184 chars)
4-PLEX, 3 UNITS OCCUPIED. ONE 1 BEDROOM UNIT AND THREE 2 BEDROOM UNITS. NEEDS COSMETICS AND REPAIRS. CONVENIENT LOCATION. BUYERS TO VERIFY ALL INFORMATION. SOLD AS-IS. NO WARRANTIES.
-
2009-07-09$207,500 184-char remark
Show marketing remark (184 chars)
4-PLEX, 3 UNITS OCCUPIED. ONE 1 BEDROOM UNIT AND THREE 2 BEDROOM UNITS. NEEDS COSMETICS AND REPAIRS. CONVENIENT LOCATION. BUYERS TO VERIFY ALL INFORMATION. SOLD AS-IS. NO WARRANTIES.
-
2005-09-26soldstatus $400,000
-
1992-06-30soldstatus $51,000
ⓘ Source: listings_history table (triggers on properties + properties_extension) + one-shot
backfill from property_details.listing_events for pre-trigger history.
Tax reassessment forecast MN · Partial reset (capped growth)
- Current annual tax
- $8,921 · $743/mo
- Projected year-2 tax
- $8,921 · $743/mo
- Expected delta
- $0/yr ($0/mo · 0.0%)
ⓘ Screening estimate from a state-policy table — verify with the county assessor before closing.
Climate risk First Street
- Flood 1/10 Low FEMA zone X (unshaded) · 0% chance over 30 yrs
- Wildfire 1/10 Low
- Heat 2/10 Low 7 d/yr ≥99°F today · 14 d/yr by 30 yrs out
- Wind 2/10 Low
- Air quality 2/10 Low 1 unhealthy d/yr today · 1 by 30 yrs out
Nearby sold comps map
Loading sold comps map…
Walkable amenities ~0.75 mi
Loading nearby amenities…
Taxation est. · year 1
- Rental income
- $74,688
- − Mortgage interest
- −$33,604
- − Property taxes
- −$8,921
- − Insurance
- −$3,000
- − Repairs & maintenance
- −$5,975
- − Management
- −$5,975
- − Depreciation
- −$17,452
- Taxable loss
- −$237
- Est. tax savings @ 24.0%
- +$57
- After-tax cash flow
- $9,389/yr
For passive investors: Depreciation is non-cash, so a rental often shows a tax loss while cash-flowing — sheltering income. Rental losses are passive: they offset passive income freely, and up to $25,000/yr can offset ordinary (W-2) income if you actively participate and your MAGI is under $100k (phasing out to $0 by $150k); unused losses carry forward. On sale, claimed depreciation is recaptured at up to 25%, and gains may owe capital-gains tax (a 1031 exchange can defer both). Figures are a year-1 estimate at your 24.0% rate — not tax advice; consult a CPA.
Schools (NCES district)
- District
- Richfield Public School District
- NCES district ID
- 2731750
- Math proficiency
- 27% ▼ -10.00%
- Reading proficiency
- 38% ▼ -6.00%
- Median HH income
- $53,367
- Composite
- 28.56/100
- National rank
- #6727
- State rank
- #262 of 301 in MN
Livability — Richfield
- Score
- 85/100
- State rank
- #22
- US rank
- #599
Category grades
Schools grade is shown separately in the Schools card above.
Census & demographics
- Census place
- Richfield, MN
- County
- Hennepin County · 1,150,272 people
- City population
- 36,724
- Metro
- Minneapolis-St. Paul-Bloomington, MN-WI
- Population (ZIP)
- 36,724
- Household income
- $85,182
- Rent vs Own
- Severe rent burden
- 1472.0
Population outlook (Hennepin County) Hauer SSP2
- Today (2025)
- 1,405,227 people
- By 2030
- 1,492,650 · +6.2%
- By 2040
- 1,660,157 · +18.1%
- By 2050
- 1,823,498 · +29.8%
- By 2075
- 2,221,283 · +58.1%
- By 2100
- 2,509,976 · +78.6%
Race, ethnicity, and origin ACS 2023
- Neighborhood character
- Diverse neighborhood (Simpson 0.58)
- Race & ethnicity
- White 61% Hispanic / Latino 18% Two or more races 10% Black 10% Asian 6%
- Hispanic origin (detail)
- Mexican 14%
- Common ancestry
- Portuguese 11% Romanian 4% Lithuanian 3%
- Foreign-born
- 17% · Canada, China, Vietnam
- Languages at home
- 76% English-only · Spanish 14% Other Asian/Pacific 2% Other Indo-European 2%
Political lean MEDSL · Hennepin
- 2024 margin
- Solid D (+42.6) · D 70.2% · R 27.5% · Other 2.3%
- 2008→2024 swing
- +14.0pp toward D · 2008: 28.6pp · 2024: 42.6pp
- All cycles
- 2024: D+42.6 2020: D+43.2 2016: D+35.3 2012: D+27.1 2008: D+28.6
Not yet ingested
- Civics
- —
Market trends
- HPI YoY
- ▼ -288.10%
- Current HPI
- 262.1432
- Rent YoY
- ▲ 2.70%
- Metro
- Minneapolis-St. Paul-Bloomington, MN-WI
- State GDP YoY
- ▲ 2.41%
- F500 in state
- 34
Industry mix (Fortune 500 HQ in MN)
| Industry | F500 HQs | Revenue |
|---|---|---|
| Healthcare | 2 | $407B |
|
||
| Retail | 2 | $150B |
|
||
| Consumer Goods | 2 | $32B |
|
||
| Industrial Machinery | 2 | $6B |
|
||
| Agriculture | 1 | $40B |
|
||
| Healthcare / Medical Devices | 1 | $32B |
|
||
Price history
+1105.9% since first listed9 events — show timeline
- 2026-05-04 Price Changed $614,990 NORTHSTARMLS as Distributed by MLS Grid
- 2026-04-10 Listed $624,999 NORTHSTARMLS as Distributed by MLS Grid
- 2021-05-05 Sold (Public Records) $486,000 Public Records
- 2014-09-16 Sold (Public Records) $125,000 Public Records
- 2009-08-05 Sold (MLS) $208,900 NORTHSTARMLS as Distributed by MLS Grid
- 2009-07-25 Listing Removed — NORTHSTARMLS as Distributed by MLS Grid
- 2009-07-09 Listed $207,500 NORTHSTARMLS as Distributed by MLS Grid
- 2005-09-26 Sold (Public Records) $400,000 Public Records
- 1992-06-30 Sold (Public Records) $51,000 Public Records
Property tax history
+6.0%/yrLatest (2025): $8,921 · +8.3% YoY. Source: county tax records.
Cash-flow waterfall
monthlySold comps — $/sqft
last 12 mo · ≤1 miLoading sold comps…