83796 Calle Moreno St · Coachella, CA
Flood risk No data
- FEMA flood zone
- —
- Chance of flooding over 30 yrs
- —
- Est. flood insurance / yr
- —
Fire risk No data
- Est. fire insurance / yr
- —
Heat risk No data
- Hot days now (above threshold)
- —
- Hot days in 30 yrs
- —
Wind risk No data
- Chance of severe wind over 30 yrs
- —
Air-quality risk No data
- Unhealthy air days now
- —
- Unhealthy air days in 30 yrs
- —
Risk factors via First Street. Map © Google.
Why this score? — see what drove the F grade
The composite is a weighted blend of 9 inputs, each scored 0–100. Each bar is that input's sub-score; the figure is the points it added to the 100-point composite (weight × sub-score).
- ARV discount +7.5/15.0
- Condition / age +4.8/5.0
- Cash flow +3.6/30.0
- Rent growth +2.5/5.0
- Livability +2.4/5.0
- Schools +1.5/10.0
- 1% rule +0.0/10.0
- DSCR +0.0/10.0
- Appreciation +0.0/10.0
$999,000
🖨 Deal sheet 📄 Offer letter ✓ Due diligence
Listing remarks
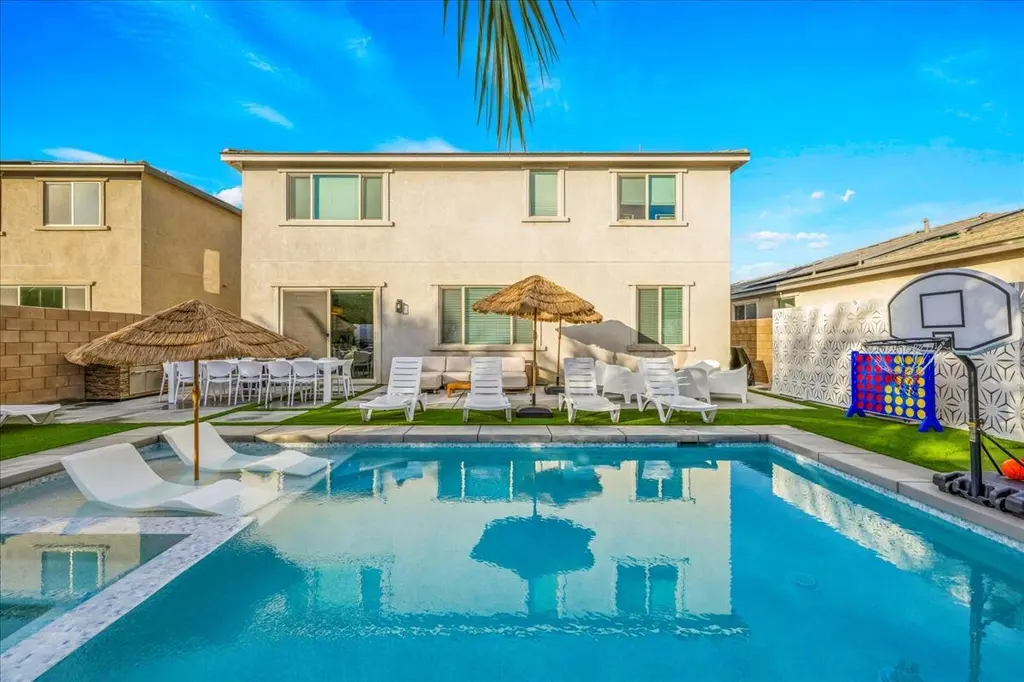
SHORT TERM RENTAL APPROVED! Income producing stunning brand new 2025 construction offered fully furnished and designed for modern resort style living. This turnkey home features an open concept layout filled with natural light, wide plank flooring, recessed lighting, and stylish designer finishes throughout. The contemporary kitchen showcases sleek cabinetry, stainless steel appliances, a gas cooktop with modern hood, expansive countertops, and a large island that flows seamlessly into the dining and living areas, perfect for entertaining. The living room is highlighted by a custom accent wall and thoughtfully curated furnishings included with the sale. Step outside to a private backyard oa
Key facts
- Contemporary kitchen
- Fully furnished
- Open concept layout
Tags
Neighborhood map
What this means for you Summary
Snapshot
- This is a 5-bed/3.0-bath other listed at $999k. Condition is rated excellent.
Deal economics
- At list price, monthly cash flow is $-3k ($-36k/yr) — negative.
- To cash-flow at today's rent, offer at most $472k (52.8% below list).
- To meet the 1% rule (rent ≥ 1% of price), the offer needs to be $364k (63.5% below list).
- Recommended offer: $364k (63.5% below list) — sets the bar for 1% rule.
- Cap rate 2.7% vs local median 4.4% in Coachella — below-typical yield; the buyer is paying a premium for something (appreciation thesis, condition, location) that the cap rate doesn't capture.
Location & tenants
- Location reads 47/100 on livability (#1,230 in CA) — a working-class tenant base; expect higher turnover. Watch: schools F, amenities F, commute F.
- Coachella Valley Unified (rural): math 12% / reading 23% proficiency, ranked #481 of 517 in CA (top 93%) — low school quality limits family demand, transient renter base, plan for 1-2y turnover; 79% free/reduced lunch — lower-income household profile, screen leases tightly.
- Market conditions: 103 active listings in the ZIP; 11 comparable units currently listed for rent nearby; rentals lingering (median 44d on market — plan ~5-8 weeks vacancy on turnover, expect pricing pressure); 82% of comp listings sitting > 30 days — soft ceiling on asking rent; 9,195 units permitted in Riverside County in 2024 (1,512 in 5+ unit buildings).
Forward outlook
- Local home prices are declining (-3.0%/yr); year-one equity from $7k of loan paydown is wiped out by about $30k of value loss. Plan a longer hold.
- Riverside County population projected at +22% by 2050 — long-run rental-demand tailwind backs the buy-and-hold thesis.
Negotiation context
- Only 1 days on market — expect competitive offers; lowballing is unlikely to land.
- 2 sale attempts with the ask held roughly flat each time — persistent listings suggest the price (not the market) is what's stuck; bring a comps-based counter.
Questions for the listing agent
- What do current leases actually rent for vs. the listed asking? Can we see a recent rent roll and the last 12 months of T-12 income?
- Is there a deadline driving the sale (1031 exchange, divorce, estate, relocation)? That informs how much negotiation room exists.
- Schools are F-rated, which usually means shorter tenancies and higher turnover. Who's the typical renter profile here, and what's been the actual vacancy rate?
- The area grade is low — what's the realistic commute time and amenity access for the typical tenant pool here? Any planned neighborhood developments (good or bad) we should know about?
- What's the average days-on-market for RENTAL listings here right now (not sales)? A rising rental-DOM trend means longer vacancies and softer asking-rent achievability than the comps imply.
- What's the recent tenant-quality profile in this submarket — average credit score on applications, eviction rate, late-payment / NSF rate, and stable-employment percentage? A property-management company in the area should have these aggregated.
- How much new for-sale + rental construction is in the pipeline within 1–3 miles? Heavy new supply typically softens prices + rents 12–24 months out; constrained supply supports both.
Investment metrics
- 1% rule
- 0.36% ✗
- Cap rate
- 2.71%
- Cash-on-cash
- -12.81%
- DSCR
- 0.43
- GRM
- 22.8
CMA / ARV
No comps found within radius.
Projected returns pro-forma
-3.0% appreciation · 3.0% rent growth · sell at horizon
- IRR
- -40.3%
- Equity multiple
- -0.26×
- Total profit
- $-352,588
- Equity at exit
- $148,954
- IRR
- -65.7%
- Equity multiple
- -0.98×
- Total profit
- $-554,215
- Equity at exit
- $86,375
Cash invested: $279,720 (down + closing). Projections, not guarantees.
Landlord ↔ Tenant lean methodology
- Overall (STATE)
- 18 Strongly Tenant-Friendly
- State California
- 18 Strongly Tenant-Friendly · D+13
- County
- — inherits STATE
- City
- — inherits STATE
ZIP-level market 92236
- Home prices YoY
- -5.1%
- Active inventory
- 103
- Price-to-rent
- 22.8×
Monthly cashflow live
- Estimated rent
- $3,644 high interval (Pro) →
- Mortgage (P&I)
- −$5,239
- Tax from tax record
- −$209 /mo · $2,502/yr
- Insurance
- −$416
- HOA
- −$0
- Vacancy / Maint / Mgmt
- −$765
- Net cashflow
- $-2,985
Break-even live
UW: 25.0% down · 7.5% · 30yr · 1.5% tax · 5.0% vac · 8.0% maint · 8.0% mgmt
Financing live
Cash to close
- Down payment
- $249,750
- Closing costs
- $29,970
- Reserves months
- —
- Total cash needed
- —
Loan-product check · same deal, 3 products live
Conventional
25% down · 7.5% · 30yr
- Down + closing
- —
- Monthly P&I
- —
- Monthly cashflow
- —
- DSCR
- —
- Eligible?
- —
Personal DTI + credit; lowest rate.
DSCR
20% down · 8.5% · 30yr
- Down + closing
- —
- Monthly P&I
- —
- Monthly cashflow
- —
- DSCR
- —
- Eligible?
- —
No personal income docs; deal must DSCR.
Hard money
10% down · 12.0% · 12mo
- Down + closing
- —
- Monthly P&I
- —
- Monthly cashflow
- —
- DSCR
- —
- Eligible?
- —
Short-term bridge; refi at stabilization.
Rent comps 11 comps
| Address | Beds | Baths | Sqft | Rent | $/sqft | DOM | Units | Dist |
|---|---|---|---|---|---|---|---|---|
| 83958 Calle Moreno Coachella, CA | 4.0 | 2.0 | 2000 | $3,350 | $1.68 | 44d | 1 | 0.14mi |
| 84422 Calle Larriva Coachella, CA | 5.0 | 3.0 | 2824 | $3,780 | $1.34 | 44d | 1 | 0.34mi |
| 84086 Manhattan Ave Coachella, CA | 4.0 | 2.5 | 2393 | $3,000 | $1.25 | 44d | 1 | 0.35mi |
| 83934 Avenida Verano Coachella, CA | 5.0 | 3.0 | 2976 | $4,199 | $1.41 | 44d | 1 | 0.44mi |
| 82787 Matthau Dr Indio, CA | 4.0 | 2.5 | 1947 | $3,300 | $1.69 | 44d | 1 | 0.97mi |
| 49990 Eastwood Ln Indio, CA | 4.0 | 2.5 | 1947 | $5,000 | $2.57 | 44d | 1 | 0.98mi |
| 82779 Matthau Dr Indio, CA | 4.0 | 2.5 | 1947 | $3,600 | $1.85 | 18d | 1 | 0.99mi |
| 49115 Mesa Ct Coachella, CA | 5.0 | 2.0 | 2000 | $3,200 | $1.60 | 44d | 1 | 1.12mi |
| 49580 Wayne St Indio, CA | 4.0 | 3.0 | 2112 | $4,800 | $2.27 | 44d | 1 | 1.19mi |
| 82668 Rosewood Dr Indio, CA | 4.0 | 3.0 | 2152 | $3,500 | $1.63 | 3d | 1 | 1.28mi |
| 82580 Yeager Way Indio, CA | 4.0 | 2.5 | 2212 | $4,500 | $2.03 | 44d | 1 | 1.48mi |
Listing history 5 events
-
2026-04-23status Pending
-
2026-04-22$999,000 Active
-
2026-04-21historical
-
2026-03-21price $999,000
-
2025-12-22$899,000 Active
ⓘ Source: listings_history table (triggers on properties + properties_extension) + one-shot
backfill from property_details.listing_events for pre-trigger history.
Tax reassessment forecast CA · Resets to sale price
- Current annual tax
- $2,502 · $209/mo
- Projected year-2 tax
- $7,592 · $633/mo
- Expected delta
- +$5,090/yr (+$424/mo · 203.4%)
ⓘ Screening estimate from a state-policy table — verify with the county assessor before closing.
Nearby sold comps map
Loading sold comps map…
Walkable amenities ~0.75 mi
Loading nearby amenities…
Taxation est. · year 1
- Rental income
- $43,724
- − Mortgage interest
- −$55,960
- − Property taxes
- −$2,502
- − Insurance
- −$4,995
- − Repairs & maintenance
- −$3,498
- − Management
- −$3,498
- − Depreciation
- −$29,062
- Taxable loss
- −$55,790
- Est. tax savings @ 24.0%
- +$13,390
- After-tax cash flow
- $-22,432/yr
For passive investors: Depreciation is non-cash, so a rental often shows a tax loss while cash-flowing — sheltering income. Rental losses are passive: they offset passive income freely, and up to $25,000/yr can offset ordinary (W-2) income if you actively participate and your MAGI is under $100k (phasing out to $0 by $150k); unused losses carry forward. On sale, claimed depreciation is recaptured at up to 25%, and gains may owe capital-gains tax (a 1031 exchange can defer both). Figures are a year-1 estimate at your 24.0% rate — not tax advice; consult a CPA.
Condition & rehab AI · 13 photos
This stunning, brand-new home is move-in ready with modern amenities and a private backyard oasis. It's an excellent investment opportunity for both resale and rental.
Value-add opportunities
- Both Landscaping and pool maintenance — A well-maintained pool and landscaping can significantly increase both resale and rental value.
- Resale Interior lighting upgrades — Modern lighting can enhance the home's appeal and make it more inviting for potential buyers.
- Rental Outdoor furniture and decor — Upgrading outdoor furniture and decor can attract more renters and increase rental income.
- Both Smart home integration — Smart home features can increase convenience and appeal to both buyers and renters, enhancing both resale and rental value.
Renovation cost estimate screening
Value-add ROI direction
- Both Landscaping and pool maintenance — A well-maintained pool and landscaping can significantly increase both resale and rental value. ↑
- Resale Interior lighting upgrades — Modern lighting can enhance the home's appeal and make it more inviting for potential buyers. ↑
- Rental Outdoor furniture and decor — Upgrading outdoor furniture and decor can attract more renters and increase rental income. ↑
- Both Smart home integration — Smart home features can increase convenience and appeal to both buyers and renters, enhancing both resale and rental value. ↑
ⓘ Cost ranges are severity-bucket heuristics (US national rule-of-thumb). Get contractor quotes + a written scope before underwriting a rehab budget.
Schools (NCES district)
- District
- Coachella Valley Unified
- NCES district ID
- 0609070
- Math proficiency
- 12% ▼ -8.00%
- Reading proficiency
- 23% ▼ -6.00%
- Median HH income
- $37,683
- Composite
- 14.62/100
- National rank
- #9408
- State rank
- #481 of 517 in CA
Livability — Coachella
- Score
- 47/100
- State rank
- #1230
- US rank
- #26216
Category grades
Schools grade is shown separately in the Schools card above.
Census & demographics
- Census place
- Coachella, CA
- Population (ZIP)
- 42,884
Population outlook (Riverside County) Hauer SSP2
- Today (2025)
- 2,664,475 people
- By 2030
- 2,802,692 · +5.2%
- By 2040
- 3,050,904 · +14.5%
- By 2050
- 3,256,783 · +22.2%
- By 2075
- 3,655,058 · +37.2%
- By 2100
- 3,766,594 · +41.4%
Race, ethnicity, and origin ACS 2023
- Neighborhood character
- Predominantly Hispanic (97%)
- Race & ethnicity
- Hispanic / Latino 97% Two or more races 47% White 1%
- Hispanic origin (detail)
- Mexican 94%
- Foreign-born
- 39% · Canada
- Languages at home
- 19% English-only · Spanish 81%
Political lean MEDSL · Riverside
- 2024 margin
- Toss-up / Even · D 48.0% · R 49.3% · Other 2.6%
- 2008→2024 swing
- -3.6pp toward R · 2008: 2.3pp · 2024: -1.3pp
- All cycles
- 2024: R+1.3 2020: D+8.0 2016: D+4.3 2012: R+0.4 2008: D+2.3
Not yet ingested
- Civics
- —
Market trends
- HPI YoY
- ▼ -21.87%
- Current HPI
- 406.8857
- Rent YoY
- —
- Metro
- —
- State GDP YoY
- ▲ 3.21%
- F500 in state
- 116
Industry mix (Fortune 500 HQ in CA)
| Industry | F500 HQs | Revenue |
|---|---|---|
| Technology | 27 | $1,492B |
|
||
| Financial Services | 3 | $174B |
|
||
| Retail | 3 | $44B |
|
||
| Insurance | 3 | $26B |
|
||
| Media / Entertainment | 2 | $115B |
|
||
| Pharmaceuticals / Biotech | 2 | $62B |
|
||
Price history
+11.1% since first listed5 events — show timeline
- 2026-04-23 Pending — GPSMLS
- 2026-04-22 Listed $999,000 GPSMLS
- 2026-04-21 Listing Removed — GPSMLS
- 2026-03-21 Price Changed $999,000 GPSMLS
- 2025-12-22 Listed $899,000 GPSMLS
Cash-flow waterfall
monthlySold comps — $/sqft
last 12 mo · ≤1 miLoading sold comps…