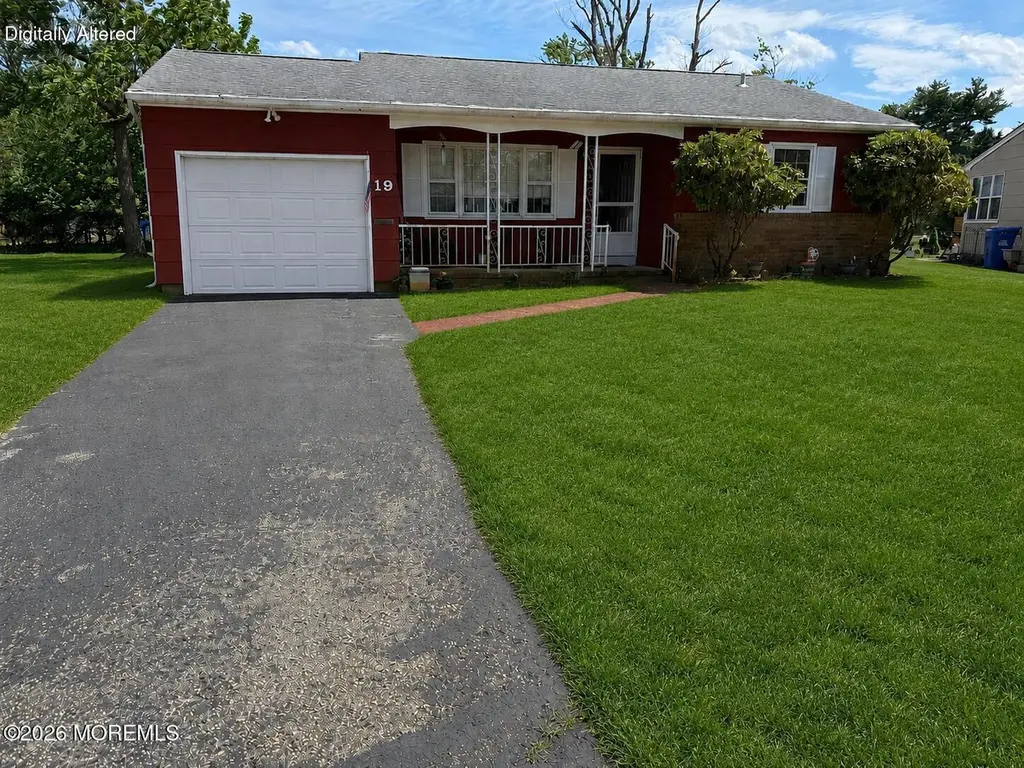
19 Sherwood Ct · Silver Ridge, NJ
Flood risk 4/10 · Minor
- FEMA flood zone
- X (unshaded)
- Chance of flooding over 30 yrs
- 0.24%
- Est. flood insurance / yr
- $507 – $1,088
Fire risk 3/10 · Minor
- Est. fire insurance / yr
- $526 – $976
Heat risk 7/10 · Major
- Hot days now (above 102°F)
- 7 days/yr
- Hot days in 30 yrs
- 15 days/yr
Wind risk 6/10 · Moderate
- Chance of severe wind over 30 yrs
- 66.0%
Air-quality risk 3/10 · Minor
- Unhealthy air days now
- 3 days/yr
- Unhealthy air days in 30 yrs
- 4 days/yr
Risk factors via First Street. Map © Google.
Why this score? — see what drove the D+ grade
The composite is a weighted blend of 9 inputs, each scored 0–100. Each bar is that input's sub-score; the figure is the points it added to the 100-point composite (weight × sub-score).
- Cash flow +17.8/30.0
- ARV discount +10.7/15.0
- DSCR +5.6/10.0
- 1% rule +4.4/10.0
- Livability +3.4/5.0
- Schools +2.6/10.0
- Rent growth +2.5/5.0
- Condition / age +2.5/5.0
- Appreciation +0.0/10.0
$249,000
🖨 Deal sheet (PDF) 📄 Offer letter ✓ Due diligence
Listing remarks MLS
If your looking for solitude, this Sussex model is located on a quiet cul-de-sac just close enough to shopping and transportation to be convenient, yet secluded enough to enjoy the country like atmosphere. If your looking for a well maintained affordable home, then this is the Sussex for you.
Key facts
- Community clubhouse
- Tree lined loop
- Medical facilities
Tags
Property features AI
Finance
- HOA & community: Part of Silver Ridge Park East association; Quarterly association fee of $100; Association amenities include clubhouse and common areas (no pool)
Exterior
- Parking: Attached 1-car garage
- Utilities: Public sewer
- Home design: Model: Sussex; Fee simple ownership
- Construction: Crawl space basement
- Exterior features: Shingle roof
Interior
- Kitchen: Stove; Microwave; Dishwasher; Refrigerator
- Bedrooms: 2 bedrooms
- Bathrooms: 1 full bathroom
- Heating & cooling: Electric heating; Multiple cooling units
- Interior features: AC units; Garage door opener
- Laundry & utility: Washer; Dryer
Neighborhood map
What this means for you Summary
Snapshot
- This is a 2-bed/1.0-bath single-family listed at $249k.
Deal economics
- At list price, monthly cash flow is $207 ($2k/yr) — positive.
- The deal already cash-flows at list — no discount required.
- To meet the 1% rule (rent ≥ 1% of price), the offer needs to be $235k (5.7% below list).
- Recommended offer: $235k (5.7% below list) — sets the bar for 1% rule.
Location & tenants
- Location reads 67/100 on livability (#338 in NJ) — a middle-class / working-renter tenant base. Strengths: crime A+, health & safety A+, housing A-; Watch: amenities F, commute F, employment D-.
- Central Regional School District (suburban): math 17% / reading 43% proficiency, ranked #357 of 472 in NJ (top 76%) — families likely to look elsewhere, expect single-tenant / working-renter base with shorter leases.
- Zoned schools: Central Regional Middle School (math 19% / reading 46%, grade F, #279 of 431 statewide, top 66%, 716 students, 37% FRL); Central Regional High School (math 15% / reading 39%, grade F, #312 of 399 statewide, top 79%, 1,606 students, 36% FRL).
- Market conditions: 509 active listings in the ZIP; 1 comparable units currently listed for rent nearby; 4,434 units permitted in Ocean County in 2024 (868 in 5+ unit buildings).
- At $2,349/mo this rent would consume 48% of the median local household income ($58k/yr) (locally 1010% of renters already pay >50% of income on rent) — very limited rent-growth headroom before tenants either downsize or default.
Forward outlook
- Local home prices are declining (-3.0%/yr); year-one equity from $2k of loan paydown is wiped out by about $7k of value loss. Plan a longer hold.
- Ocean County population projected to shrink 8% by 2050 — rents likely to lag national; underwrite the cash flow, not the appreciation.
Negotiation context
- Only 2 days on market — expect competitive offers; lowballing is unlikely to land.
- 2 sale attempts since 14y ago with the ask held roughly flat each time — persistent listings suggest the price (not the market) is what's stuck; bring a comps-based counter.
- Current owner paid $78k; list at $249k implies a 217% gain — meaningful room to come down on a strong offer.
Risks & watch-outs
- Climate carrying-cost: major wind risk, 66% chance of damaging wind over 30y; extreme-heat days projected 7→15/yr by 2055 (HVAC capex compounding) — expect insurance premiums to compound above CPI over the hold.
Questions for the listing agent
- Built in 1970 — when were the roof, HVAC, electrical panel, plumbing, and water heater last replaced?
- What does the HOA fee cover, when was the last increase, and are there any pending special assessments or reserve-fund shortfalls?
- Is there a deadline driving the sale (1031 exchange, divorce, estate, relocation)? That informs how much negotiation room exists.
- Schools are F-rated, which usually means shorter tenancies and higher turnover. Who's the typical renter profile here, and what's been the actual vacancy rate?
- The area grade is low — what's the realistic commute time and amenity access for the typical tenant pool here? Any planned neighborhood developments (good or bad) we should know about?
- What's the average days-on-market for RENTAL listings here right now (not sales)? A rising rental-DOM trend means longer vacancies and softer asking-rent achievability than the comps imply.
- What's the recent tenant-quality profile in this submarket — average credit score on applications, eviction rate, late-payment / NSF rate, and stable-employment percentage? A property-management company in the area should have these aggregated.
- How much new for-sale + rental construction is in the pipeline within 1–3 miles? Heavy new supply typically softens prices + rents 12–24 months out; constrained supply supports both.
Investment metrics
- 1% rule
- 0.94% ✗
- Cap rate
- 7.29%
- Cash-on-cash
- 3.56%
- DSCR
- 1.16
- GRM
- 8.8
CMA / ARV
- ARV (on-the-fly)
- $267,996
- Comps found
- 12
Show comp detail 12 sales within ~0.75 mi
| Address | Dist | Beds/Ba | Sqft | Sold | Price | $/sf | Match |
|---|---|---|---|---|---|---|---|
| 29 Sherwood Ln | 0.04mi | 2/1.0 | 1,083 (+12%) | 4mo | $248,000 | $229 | 75 |
| 57 Eton Rd | 0.56mi | 2/1.0 | 971 (0%) | 2mo | $280,000 | $288 | 72 |
| 9 Hamilton Ct | 0.57mi | 2/1.0 | 971 (0%) | 2mo | $225,000 | $232 | 72 |
| 63 Brakenbury Dr | 0.58mi | 2/1.0 | 971 (0%) | 2mo | $265,000 | $273 | 71 |
| 1 Cambridge Ct | 0.46mi | 2/1.0 | 944 (-3%) | 3mo | $305,000 | $323 | 71 |
| 1111 Waterberry Ct S | 0.27mi | 2/1.5 | 1,083 (+12%) | 4mo | $299,000 | $276 | 62 |
| 18 Bolingbroke Dr | 0.40mi | 2/1.5 | 1,074 (+11%) | 2mo | $320,000 | $298 | 60 |
| 1086 Edgebrook Dr S | 0.45mi | 2/1.0 | 1,083 (+12%) | 3mo | $310,000 | $286 | 57 |
| 1074 Edgebrook Dr S | 0.51mi | 2/1.0 | 1,074 (+11%) | 2mo | $255,000 | $237 | 56 |
| 11 Margarita St | 0.49mi | 2/1.0 | 1,092 (+12%) | 3mo | $282,000 | $258 | 54 |
| 14 Saint Pierri Ct | 0.44mi | 2/1.5 | 1,092 (+12%) | 3mo | $295,000 | $270 | 54 |
| 48 Harrington Dr S | 0.68mi | 2/2.0 | 1,100 (+13%) | 3mo | $349,900 | $318 | 40 |
Match score weights: distance 35% · size 25% · config 20% · recency 20%. Top-matched comps best support the ARV.
Projected returns pro-forma
-3.0% appreciation · 3.0% rent growth · sell at horizon
- IRR
- -10.7%
- Equity multiple
- 0.61×
- Total profit
- $-27,190
- Equity at exit
- $37,127
- IRR
- -1.4%
- Equity multiple
- 0.90×
- Total profit
- $-6,757
- Equity at exit
- $21,529
Cash invested: $69,720 (down + closing). Projections, not guarantees.
Landlord ↔ Tenant lean methodology
- Overall (STATE)
- 21 Tenant-Leaning
- State New Jersey
- 21 Tenant-Leaning · D+6
- County
- — inherits STATE
- City
- — inherits STATE
ZIP-level market 08757
- Active inventory
- 509
- Price-to-rent
- 8.8×
Monthly cashflow live
- Estimated rent
- $2,349 medium interval (Pro) →
- Mortgage (P&I)
- −$1,306
- Tax from tax record
- −$206 /mo · $2,473/yr
- Insurance
- −$104
- HOA
- −$33
- Vacancy / Maint / Mgmt
- −$493
- Net cashflow
- $207
Break-even live
Sensitivity live
| Price | -10% $348 | -5% $277 | +0% $207 | +5% $136 | +10% $66 |
|---|---|---|---|---|---|
| Rent | -10% $21 | -5% $114 | +0% $207 | +5% $300 | +10% $392 |
| Rate | -1.0pp $332 | -0.5pp $270 | base $207 | +0.5pp $142 | +1.0pp $77 |
UW: 25.0% down · 7.5% · 30yr · 1.5% tax · 5.0% vac · 8.0% maint · 8.0% mgmt
Financing live
Cash to close
- Down payment
- $62,250
- Closing costs
- $7,470
- Reserves months
- —
- Total cash needed
- —
Loan-product check · same deal, 3 products live
Conventional
25% down · 7.5% · 30yr
- Down + closing
- —
- Monthly P&I
- —
- Monthly cashflow
- —
- DSCR
- —
- Eligible?
- —
Personal DTI + credit; lowest rate.
DSCR
20% down · 8.5% · 30yr
- Down + closing
- —
- Monthly P&I
- —
- Monthly cashflow
- —
- DSCR
- —
- Eligible?
- —
No personal income docs; deal must DSCR.
Hard money
10% down · 12.0% · 12mo
- Down + closing
- —
- Monthly P&I
- —
- Monthly cashflow
- —
- DSCR
- —
- Eligible?
- —
Short-term bridge; refi at stabilization.
Rent comps 1 comps
| Address | Beds | Baths | Sqft | Rent | $/sqft | DOM | Units | Dist |
|---|---|---|---|---|---|---|---|---|
| 2 York St Toms River, NJ | 2.0 | 1.5 | 1105 | $2,200 | $1.99 | 0d | 1 | 0.17mi |
HOA detail
- Monthly dues
- $33 · $396/yr
Listing history 2 events
-
2026-06-21remarks 663-char remark
-
2026-06-21$249,000 Active 2 DOM
ⓘ Source: listings_history table (triggers on properties + properties_extension) + one-shot
backfill from property_details.listing_events for pre-trigger history.
Tax reassessment forecast NJ · Partial reset (capped growth)
- Current annual tax
- $2,473 · $206/mo
- Projected year-2 tax
- $4,337 · $361/mo
- Expected delta
- +$1,863/yr (+$155/mo · 75.3%)
ⓘ Screening estimate from a state-policy table — verify with the county assessor before closing.
Climate risk First Street
- Flood 4/10 Moderate FEMA zone X (unshaded) · 24% chance over 30 yrs
- Wildfire 3/10 Moderate
- Heat 7/10 Severe 7 d/yr ≥102°F today · 15 d/yr by 30 yrs out
- Wind 6/10 Major 66% chance of damaging wind over 30 yrs
- Air quality 3/10 Moderate 3 unhealthy d/yr today · 4 by 30 yrs out
Nearby sold comps map
Loading sold comps map…
Walkable amenities ~0.75 mi
Loading nearby amenities…
Taxation est. · year 1
- Rental income
- $28,183
- − Mortgage interest
- −$13,948
- − Property taxes
- −$2,473
- − Insurance
- −$1,245
- − Repairs & maintenance
- −$2,255
- − Management
- −$2,255
- − HOA
- −$396
- − Depreciation
- −$7,244
- Taxable loss
- −$1,632
- Est. tax savings @ 24.0%
- +$392
- After-tax cash flow
- $2,873/yr
For passive investors: Depreciation is non-cash, so a rental often shows a tax loss while cash-flowing — sheltering income. Rental losses are passive: they offset passive income freely, and up to $25,000/yr can offset ordinary (W-2) income if you actively participate and your MAGI is under $100k (phasing out to $0 by $150k); unused losses carry forward. On sale, claimed depreciation is recaptured at up to 25%, and gains may owe capital-gains tax (a 1031 exchange can defer both). Figures are a year-1 estimate at your 24.0% rate — not tax advice; consult a CPA.
Schools (NCES district)
- District
- Central Regional School District
- NCES district ID
- 3402910
- Math proficiency
- 17% ▼ -14.00%
- Reading proficiency
- 43% ▲ 7.00%
- Median HH income
- $44,676
- Composite
- 25.59/100
- National rank
- #7422
- State rank
- #357 of 472 in NJ
Livability — Silver Ridge
- Score
- 67/100
- State rank
- #338
- US rank
- #10927
Category grades
Schools grade is shown separately in the Schools card above.
Census & demographics
- Census place
- Silver Ridge, NJ
- County
- Ocean County · 439,426 people
- Metro
- New York-Newark-Jersey City, NY-NJ-PA
- Population (ZIP)
- 36,087
- Household income
- $58,319
- Rent vs Own
- Severe rent burden
- 1010.0
Population outlook (Ocean County) Hauer SSP2
- Today (2025)
- 586,991 people
- By 2030
- 581,403 · -1.0%
- By 2040
- 564,913 · -3.8%
- By 2050
- 538,149 · -8.3%
- By 2075
- 468,845 · -20.1%
- By 2100
- 350,297 · -40.3%
Race, ethnicity, and origin ACS 2023
- Neighborhood character
- Predominantly White (75%)
- Race & ethnicity
- White 75% Hispanic / Latino 15% Two or more races 9% Black 5% Asian 2%
- Hispanic origin (detail)
- Mexican 4% Puerto Rican 6% Dominican 1%
- Common ancestry
- Romanian 9% Slovak 2% Iranian 2%
- Foreign-born
- 11% · Canada, Jamaica
- Languages at home
- 85% English-only · Spanish 7% Other Indo-European 3% Russian/Polish/Slavic 2%
Political lean MEDSL · Ocean
- 2024 margin
- Solid R (+36.0) · D 31.4% · R 67.4% · Other 1.2%
- 2008→2024 swing
- -17.6pp toward R · 2008: -18.4pp · 2024: -36.0pp
- All cycles
- 2024: R+36.0 2020: R+28.7 2016: R+34.0 2012: R+17.7 2008: R+18.4
Not yet ingested
- Civics
- —
Market trends
- HPI YoY
- ▼ -429.32%
- Current HPI
- 305.1341
- Rent YoY
- —
- Metro
- New York-Newark-Jersey City, NY-NJ-PA
- State GDP YoY
- ▲ 2.05%
- F500 in state
- 34
Industry mix (Fortune 500 HQ in NJ)
| Industry | F500 HQs | Revenue |
|---|---|---|
| Consumer Goods | 3 | $31B |
|
||
| Pharmaceuticals | 2 | $153B |
|
||
| Technology | 2 | $21B |
|
||
| Insurance | 2 | $20B |
|
||
| Healthcare | 2 | $19B |
|
||
| Financial Services | 1 | $70B |
|
||
Price history
+194.7% since first listed4 events — show timeline
- 2026-06-19 Listed $249,000 MOMLS
- 2013-01-16 Sold (Public Records) $78,500 Public Records
- 2012-12-28 Sold (MLS) $78,250 MOMLS
- 2012-07-18 Listed $84,500 MOMLS
Property tax history
+1.0%/yrLatest (2025): $2,473 · +7.4% YoY. Source: county tax records.
Cash-flow waterfall
monthlySold comps — $/sqft
last 12 mo · ≤1 miLoading sold comps…