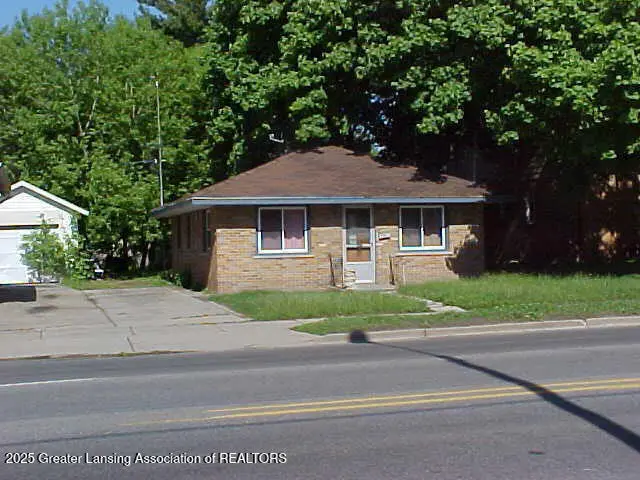
933 N Martin Luther King Jr Blvd · Lansing, MI
Flood risk 1/10 · Minimal
- FEMA flood zone
- X (unshaded)
- Chance of flooding over 30 yrs
- 0.0%
- Est. flood insurance / yr
- $507 – $1,088
Fire risk 1/10 · Minimal
- Est. fire insurance / yr
- $784 – $1,456
Heat risk 2/10 · Minimal
- Hot days now (above 97°F)
- 7 days/yr
- Hot days in 30 yrs
- 16 days/yr
Wind risk 2/10 · Minimal
- Chance of severe wind over 30 yrs
- —
Air-quality risk 2/10 · Minimal
- Unhealthy air days now
- 1 days/yr
- Unhealthy air days in 30 yrs
- 2 days/yr
Risk factors via First Street. Map © Google.
Why this score? — see what drove the B grade
The composite is a weighted blend of 9 inputs, each scored 0–100. Each bar is that input's sub-score; the figure is the points it added to the 100-point composite (weight × sub-score).
- Cash flow +30.0/30.0
- ARV discount +14.0/15.0
- DSCR +10.0/10.0
- 1% rule +9.9/10.0
- Livability +4.0/5.0
- Rent growth +2.5/5.0
- Condition / age +2.5/5.0
- Schools +1.9/10.0
- Appreciation +0.0/10.0
$74,900
🖨 Deal sheet 📄 Offer letter ✓ Due diligence
Listing remarks MLS
PROPERTY SOLD AS IS INSPECTIONS FOR INFORMATION PURPOSE ONLY GREAT STARTER HOME INCLUDE VACANT LOT SOUTH OF PROPERTY
Key facts
- 4,356 sq ft lot
- Built 1954
- Listed 181 days
Neighborhood map
What this means for you Summary
Snapshot
- This is a 2-bed/1.0-bath single-family listed at $75k.
Deal economics
- At list price, monthly cash flow is $327 ($4k/yr) — positive.
- The deal already cash-flows at list — no discount required.
- Meets the 1% rule at list price ($1k rent vs $75k).
- Recommended offer: $66k (12.0% below list) — sets the bar for market timing.
- Cap rate 11.5% vs local median 6.0% in Lansing — top-decile yield for the area; either an underpriced asset or a hidden risk that comps aren't pricing in. Stress-test before assuming the spread holds.
Location & tenants
- Location reads 79/100 on livability (#94 in MI, #2,182 nationally) — a middle-class / working-renter tenant base. Strengths: amenities A+, commute A+, cost of living A+; Watch: employment D, schools F, crime F.
- Lansing Public School District (urban): math 14% / reading 23% proficiency, ranked #650 of 760 in MI (top 86%) — low school quality limits family demand, transient renter base, plan for 1-2y turnover; 68% free/reduced lunch — lower-income household profile, screen leases tightly.
- Market conditions: 68 active listings in the ZIP; 36 comparable units currently listed for rent nearby; rentals lingering (median 44d on market — plan ~5-8 weeks vacancy on turnover, expect pricing pressure); 67% of comp listings sitting > 30 days — soft ceiling on asking rent; 350 units permitted in Ingham County in 2024 (186 in 5+ unit buildings).
Forward outlook
- Local home prices are declining (-3.0%/yr); year-one equity from $518 of loan paydown is wiped out by about $2k of value loss. Plan a longer hold.
- Ingham County population projected at +11% by 2050 — modest demand growth; plan on rents tracking national, not racing it.
- At projected returns (-3.0% appreciation + 3.0% rent growth), your $21k cash investment doubles in ~7 years — after that, you're playing with house money.
Negotiation context
- It's been on market 182 days — a 12% lower offer ($66k) is reasonable based on typical stale-listing flexibility.
- 2 sale attempts with the ask held roughly flat each time — persistent listings suggest the price (not the market) is what's stuck; bring a comps-based counter.
Risks & watch-outs
- Watch-outs: built in 1954 — expect roof / HVAC / electrical / plumbing capex.
Questions for the listing agent
- It's been on market 182 days. Have you received any prior offers? Is the seller open to a 12% concession, seller financing, or rate buy-down credit?
- Built in 1954 — when were the roof, HVAC, electrical panel, plumbing, and water heater last replaced?
- Why hasn't it sold? Are there any deal-killer items the seller is aware of (foundation, flood, title, zoning, code violations)?
- Is there a deadline driving the sale (1031 exchange, divorce, estate, relocation)? That informs how much negotiation room exists.
- Schools are F-rated, which usually means shorter tenancies and higher turnover. Who's the typical renter profile here, and what's been the actual vacancy rate?
- Crime grade is F in this area — have there been break-ins, vandalism, or insurance claims at this property in the last 3 years? What carrier currently insures it and at what premium?
- What's the average days-on-market for RENTAL listings here right now (not sales)? A rising rental-DOM trend means longer vacancies and softer asking-rent achievability than the comps imply.
- What's the recent tenant-quality profile in this submarket — average credit score on applications, eviction rate, late-payment / NSF rate, and stable-employment percentage? A property-management company in the area should have these aggregated.
- How much new for-sale + rental construction is in the pipeline within 1–3 miles? Heavy new supply typically softens prices + rents 12–24 months out; constrained supply supports both.
Investment metrics
- 1% rule
- 1.49% ✓
- Cap rate
- 11.53%
- Cash-on-cash
- 18.69%
- DSCR
- 1.83
- GRM
- 5.6
CMA / ARV
- ARV (median comp)
- $87,650
- List price
- $74,900
- Delta
- -14.55%
- Verdict
- UNDERPRICED
- Comps
- 20 within 1.0 mi
Show comp detail 12 sales within ~0.75 mi
| Address | Dist | Beds/Ba | Sqft | Sold | Price | $/sf | Match |
|---|---|---|---|---|---|---|---|
| 1129 N Martin Luther King Jr Blvd | 0.16mi | 2/1.0 | 798 (+4%) | 4mo | $52,500 | $66 | 82 |
| 1430 N Martin Luther King Jr Blvd | 0.44mi | 3/1.0 (+1) | 768 (0%) | 6mo | $62,000 | $81 | 70 |
| 819 Cawood St | 0.42mi | 2/1.0 | 726 (-6%) | 4mo | $55,000 | $76 | 68 |
| 2014 Hyland St | 0.60mi | 2/1.0 | 744 (-3%) | 0mo | $152,500 | $205 | 67 |
| 1230 Glenn St | 0.21mi | 2/1.0 | 875 (+14%) | 5mo | $43,000 | $49 | 63 |
| 1112 W Willow St | 0.26mi | 3/1.0 (+1) | 870 (+13%) | 4mo | $96,000 | $110 | 57 |
| 1348 N Jenison Ave | 0.43mi | 2/1.0 | 672 (-12%) | 3mo | $68,900 | $103 | 56 |
| 1706 N Martin Luther King Jr Blvd | 0.66mi | 3/1.0 (+1) | 818 (+6%) | 3mo | $129,900 | $159 | 51 |
| 1522 Robertson Ave | 0.53mi | 3/1.0 (+1) | 866 (+13%) | 1mo | $45,000 | $52 | 48 |
| 1016 Cleo St | 0.45mi | 3/1.0 (+1) | 875 (+14%) | 5mo | $100,150 | $114 | 46 |
| 1616 Roseneath Ave | 0.61mi | 2/1.0 | 660 (-14%) | 4mo | $73,000 | $111 | 44 |
| 1004 Greenwood Ave | 0.59mi | 3/2.0 (+1) | 878 (+14%) | 3mo | $121,000 | $138 | 37 |
Match score weights: distance 35% · size 25% · config 20% · recency 20%. Top-matched comps best support the ARV.
Projected returns pro-forma
-3.0% appreciation · 3.0% rent growth · sell at horizon
- IRR
- 10.5%
- Equity multiple
- 1.42×
- Total profit
- $8,706
- Equity at exit
- $11,168
- IRR
- 19.6%
- Equity multiple
- 2.65×
- Total profit
- $34,531
- Equity at exit
- $6,476
Cash invested: $20,972 (down + closing). Projections, not guarantees.
Landlord ↔ Tenant lean methodology
- Overall (STATE)
- 62 Landlord-Friendly
- State Michigan
- 62 Landlord-Friendly · EVEN
- County
- — inherits STATE
- City
- — inherits STATE
ZIP-level market 48915
- Active inventory
- 68
- Price-to-rent
- 5.6×
Monthly cashflow live
- Estimated rent
- $1,116 high interval (Pro) →
- Mortgage (P&I)
- −$393
- Tax from tax record
- −$131 /mo · $1,568/yr
- Insurance
- −$31
- HOA
- −$0
- Vacancy / Maint / Mgmt
- −$234
- Net cashflow
- $327
Break-even live
UW: 25.0% down · 7.5% · 30yr · 1.5% tax · 5.0% vac · 8.0% maint · 8.0% mgmt
Financing live
Cash to close
- Down payment
- $18,725
- Closing costs
- $2,247
- Reserves months
- —
- Total cash needed
- —
Loan-product check · same deal, 3 products live
Conventional
25% down · 7.5% · 30yr
- Down + closing
- —
- Monthly P&I
- —
- Monthly cashflow
- —
- DSCR
- —
- Eligible?
- —
Personal DTI + credit; lowest rate.
DSCR
20% down · 8.5% · 30yr
- Down + closing
- —
- Monthly P&I
- —
- Monthly cashflow
- —
- DSCR
- —
- Eligible?
- —
No personal income docs; deal must DSCR.
Hard money
10% down · 12.0% · 12mo
- Down + closing
- —
- Monthly P&I
- —
- Monthly cashflow
- —
- DSCR
- —
- Eligible?
- —
Short-term bridge; refi at stabilization.
Rent comps 36 comps
| Address | Beds | Baths | Sqft | Rent | $/sqft | DOM | Units | Dist |
|---|---|---|---|---|---|---|---|---|
| 919 Princeton Ave Lansing, MI | 3.0 | 1.5 | 1119 | $1,475 | $1.32 | 21d | 1 | 0.11mi |
| 731 N Sycamore St Unit 1 Lansing, MI | 2.0 | 1.0 | 950 | $945 | $0.99 | 43d | 1 | 0.37mi |
| 712 N Sycamore St Lansing, MI | 3.0 | 1.0 | 1100 | $1,650 | $1.50 | 21d | 1 | 0.41mi |
| 1010 N Pine St Unit B Lansing, MI | 2.0 | 1.0 | 750 | $1,100 | $1.47 | 43d | 1 | 0.43mi |
| 1443 Roselawn Ave Lansing, MI | 2.0 | 1.0 | 656 | $750 | $1.14 | 43d | 1 | 0.46mi |
| 610 N Sycamore St Unit 1 Lansing, MI | 1.0 | 1.0 | 900 | $875 | $0.97 | 13d | 1 | 0.47mi |
| 1216 N Chestnut St Lansing, MI | 1.0 | 1.0 | 562 | $900 | $1.60 | 13d | 1 | 0.55mi |
| 927 W Shiawassee St Unit 10 Lansing, MI | 1.0 | 1.0 | 700 | $845 | $1.21 | 43d | 1 | 0.56mi |
| 504 W Lapeer St Apt A Lansing, MI | 2.0 | 1.0 | 600 | $895 | $1.49 | 43d | 1 | 0.58mi |
| 826 N Walnut St Lansing, MI | 1.0 | 1.0 | 700 | $700 | $1.00 | 43d | 2 | 0.60mi |
| 410 W Lapeer St Unit 1 Lansing, MI | 2.0 | 1.0 | 800 | $1,050 | $1.31 | 21d | 1 | 0.63mi |
| 316 W Saginaw St Unit 318 Lansing, MI | 1.0 | 1.0 | 750 | $950 | $1.27 | 43d | 1 | 0.65mi |
| 323 W Saginaw St Unit 1 Lansing, MI | 1.0 | 1.0 | 1000 | $1,000 | $1.00 | 43d | 1 | 0.66mi |
| 314 N Sycamore St Unit 1 Lansing, MI | 1.0 | 1.0 | 800 | $1,450 | $1.81 | 43d | 1 | 0.68mi |
| 524 N Walnut St Lansing, MI | 2.0 | 1.0 | 1000 | $1,150 | $1.15 | 43d | 1 | 0.69mi |
| 801 N Capitol Ave Unit 1 Lansing, MI | 1.0 | 1.0 | 550 | $950 | $1.73 | 43d | 1 | 0.73mi |
| 801 N Capitol Ave Unit 4 Lansing, MI | 1.0 | 1.0 | 600 | $1,000 | $1.67 | 43d | 1 | 0.73mi |
| 1016 N Capitol Ave Unit 1 Lansing, MI | 1.0 | 1.0 | 700 | $850 | $1.21 | 43d | 1 | 0.74mi |
| 427 Seymour Ave Unit 315 Lansing, MI | 2.0 | 1.0 | 550 | $1,300 | $2.36 | 43d | 1 | 0.78mi |
| 427 Seymour Ave Unit 315 Lansing, MI | 2.0 | 1.0 | 550 | $1,300 | $2.36 | 21d | 1 | 0.78mi |
| 427 Seymour Ave Unit 205 Lansing, MI | 1.0 | 1.0 | 570 | $1,100 | $1.93 | 43d | 1 | 0.78mi |
| 427 Seymour Ave Unit 102 Lansing, MI | 1.0 | 1.0 | 540 | $850 | $1.57 | 21d | 1 | 0.78mi |
| 1025 N Washington Ave Unit 9 Lansing, MI | 1.0 | 1.0 | 670 | $1,000 | $1.49 | 43d | 1 | 0.79mi |
| 307 N Walnut St Unit 307 Lansing, MI | 1.0 | 1.0 | 550 | $1,100 | $2.00 | 43d | 1 | 0.81mi |
| 117 E North St Unit A Lansing, MI | 2.0 | 1.0 | 812 | $1,050 | $1.29 | 13d | 1 | 0.95mi |
| 1109 W Washtenaw St Unit 5 Lansing, MI | 2.0 | 1.0 | 755 | $795 | $1.05 | 43d | 1 | 0.95mi |
| 420 S Walnut St Lansing, MI | 1.0 | 1.0 | 525 | $875 | $1.67 | 43d | 1 | 1.21mi |
| 832 N Larch St Apt 3 Lansing, MI | 2.0 | 1.0 | 890 | $1,095 | $1.23 | 43d | 1 | 1.21mi |
| 1330 W Hillsdale St Lansing, MI | 3.0 | 1.0 | 1008 | $1,550 | $1.54 | 43d | 1 | 1.21mi |
| 122 Hathaway St Lansing, MI | 2.0 | 1.0 | 768 | $1,250 | $1.63 | 43d | 1 | 1.22mi |
| 400 N Catherine St Lansing, MI | 3.0 | 1.0 | 760 | $1,395 | $1.84 | 13d | 1 | 1.22mi |
| 620 May St Lansing, MI | 1.0–2.0 | 1.0–2.0 | 1126 | $1,578 | $1.40 | 13d | 12 | 1.27mi |
| 515 S Chestnut St Lansing, MI | 1.0 | 1.0 | 646 | $942 | $1.46 | 13d | 8 | 1.27mi |
| 401 S Washington Sq Unit 212 Lansing, MI | 1.0 | 1.0 | 827 | $1,330 | $1.61 | 43d | 1 | 1.34mi |
| 401 S Washington Sq Unit 205 Lansing, MI | 2.0 | 1.0 | 968 | $1,355 | $1.40 | 43d | 1 | 1.34mi |
| 113 Pere Marquette Dr Lansing, MI | 1.0–2.0 | 1.0–2.0 | 1065 | $2,250 | $2.11 | 13d | 9 | 1.45mi |
Listing history 9 events
-
2026-06-07days on market $74,900 Active 182 DOM
-
2026-06-05days on market $74,900 Active 179 DOM
-
2026-06-03days on market $74,900 Active 178 DOM
-
2026-06-02days on market $74,900 Active 177 DOM
-
2026-06-01days on market $74,900 Active 176 DOM
-
2026-05-31days on market $74,900 Active 175 DOM
-
2026-05-30days on market $74,900 Active 174 DOM
-
2025-12-07$74,900 Active 116-char remark
Show marketing remark (116 chars)
PROPERTY SOLD AS IS INSPECTIONS FOR INFORMATION PURPOSE ONLY GREAT STARTER HOME INCLUDE VACANT LOT SOUTH OF PROPERTY
-
2025-12-07$74,900 Active 116-char remark
Show marketing remark (116 chars)
PROPERTY SOLD AS IS INSPECTIONS FOR INFORMATION PURPOSE ONLY GREAT STARTER HOME INCLUDE VACANT LOT SOUTH OF PROPERTY
ⓘ Source: listings_history table (triggers on properties + properties_extension) + one-shot
backfill from property_details.listing_events for pre-trigger history.
Tax reassessment forecast MI · Partial reset (capped growth)
- Current annual tax
- $1,568 · $131/mo
- Projected year-2 tax
- $1,568 · $131/mo
- Expected delta
- $0/yr ($0/mo · 0.0%)
ⓘ Screening estimate from a state-policy table — verify with the county assessor before closing.
Climate risk First Street
- Flood 1/10 Low FEMA zone X (unshaded) · 0% chance over 30 yrs
- Wildfire 1/10 Low
- Heat 2/10 Low 7 d/yr ≥97°F today · 16 d/yr by 30 yrs out
- Wind 2/10 Low
- Air quality 2/10 Low 1 unhealthy d/yr today · 2 by 30 yrs out
Nearby sold comps map
Loading sold comps map…
Walkable amenities ~0.75 mi
Loading nearby amenities…
Taxation est. · year 1
- Rental income
- $13,387
- − Mortgage interest
- −$4,196
- − Property taxes
- −$1,568
- − Insurance
- −$374
- − Repairs & maintenance
- −$1,071
- − Management
- −$1,071
- − Depreciation
- −$2,179
- Taxable income
- $2,928
- Est. tax owed @ 24.0%
- −$703
- After-tax cash flow
- $3,217/yr
For passive investors: Depreciation is non-cash, so a rental often shows a tax loss while cash-flowing — sheltering income. Rental losses are passive: they offset passive income freely, and up to $25,000/yr can offset ordinary (W-2) income if you actively participate and your MAGI is under $100k (phasing out to $0 by $150k); unused losses carry forward. On sale, claimed depreciation is recaptured at up to 25%, and gains may owe capital-gains tax (a 1031 exchange can defer both). Figures are a year-1 estimate at your 24.0% rate — not tax advice; consult a CPA.
Schools (NCES district)
- District
- Lansing Public School District
- NCES district ID
- 2621150
- Math proficiency
- 14% ▲ 1.00%
- Reading proficiency
- 23% ▲ 3.00%
- Median HH income
- $37,453
- Composite
- 18.76/100
- National rank
- #14002
- State rank
- #650 of 760 in MI
Livability — Lansing
- Score
- 79/100
- State rank
- #94
- US rank
- #2182
Category grades
Schools grade is shown separately in the Schools card above.
Census & demographics
- Census place
- Lansing, MI
- County
- Ingham County · 237,052 people
- City population
- 161,269
- Metro
- Lansing-East Lansing, MI
- Population (ZIP)
- 9,428
- Household income
- $54,465
- Rent vs Own
- Severe rent burden
- 307.0
Population outlook (Ingham County) Hauer SSP2
- Today (2025)
- 300,362 people
- By 2030
- 307,808 · +2.5%
- By 2040
- 320,492 · +6.7%
- By 2050
- 333,223 · +10.9%
- By 2075
- 373,693 · +24.4%
- By 2100
- 392,021 · +30.5%
Race, ethnicity, and origin ACS 2023
- Neighborhood character
- Diverse neighborhood (Simpson 0.64)
- Race & ethnicity
- White 54% Black 24% Two or more races 13% Hispanic / Latino 13%
- Hispanic origin (detail)
- Mexican 10%
- Common ancestry
- Romanian 7% Lithuanian 2% Iranian 2%
- Foreign-born
- 5% · Canada, Philippines
- Languages at home
- 90% English-only · Spanish 7% Other Asian/Pacific 1% German/W. Germanic 1%
Political lean MEDSL · Ingham
- 2024 margin
- Strong D (+29.7) · D 63.9% · R 34.2% · Other 2.0%
- 2008→2024 swing
- -3.6pp toward R · 2008: 33.3pp · 2024: 29.7pp
- All cycles
- 2024: D+29.7 2020: D+32.2 2016: D+27.6 2012: D+27.9 2008: D+33.3
Not yet ingested
- Civics
- —
Market trends
- HPI YoY
- ▼ -129.90%
- Current HPI
- 177.0906
- Rent YoY
- —
- Metro
- Lansing-East Lansing, MI
- State GDP YoY
- ▲ 1.37%
- F500 in state
- 28
Industry mix (Fortune 500 HQ in MI)
| Industry | F500 HQs | Revenue |
|---|---|---|
| Automotive Parts | 3 | $48B |
|
||
| Automotive | 2 | $372B |
|
||
| Chemicals | 1 | $45B |
|
||
| Automotive Retail | 1 | $29B |
|
||
| Healthcare / Medical Devices | 1 | $23B |
|
||
| Automotive Technology | 1 | $20B |
|
||
Price history
+0.0% since first listed2 events — show timeline
- 2025-12-07 Listed $74,900 REALCOMP
- 2025-12-07 Listed $74,900 Greater Lansing AoR
Property tax history
+2.9%/yrLatest (2025): $1,568 · +2.9% YoY. Source: county tax records.
Cash-flow waterfall
monthlySold comps — $/sqft
last 12 mo · ≤1 miLoading sold comps…