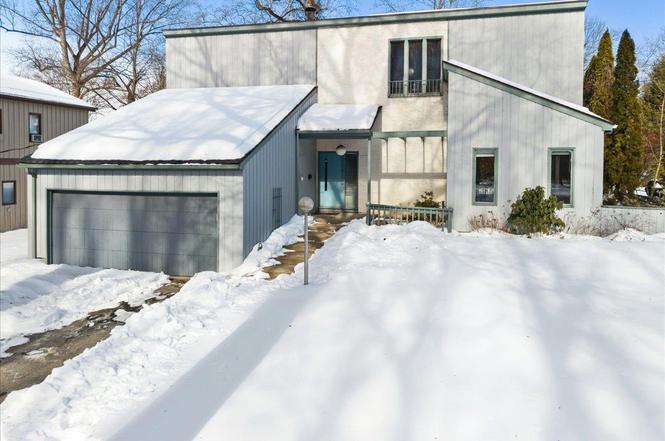
206 Emerson Ave · Hartsdale, NY
Flood risk 1/10 · Minimal
- FEMA flood zone
- X (unshaded)
- Chance of flooding over 30 yrs
- 0.0%
- Est. flood insurance / yr
- $507 – $1,088
Fire risk 3/10 · Minor
- Est. fire insurance / yr
- $691 – $1,283
Heat risk 5/10 · Moderate
- Hot days now (above 98°F)
- 7 days/yr
- Hot days in 30 yrs
- 15 days/yr
Wind risk 6/10 · Moderate
- Chance of severe wind over 30 yrs
- 27.0%
Air-quality risk 4/10 · Minor
- Unhealthy air days now
- 3 days/yr
- Unhealthy air days in 30 yrs
- 5 days/yr
Risk factors via First Street. Map © Google.
Why this score? — see what drove the D+ grade
The composite is a weighted blend of 9 inputs, each scored 0–100. Each bar is that input's sub-score; the figure is the points it added to the 100-point composite (weight × sub-score).
- Cash flow +13.9/30.0
- ARV discount +12.4/15.0
- Schools +4.9/10.0
- DSCR +4.2/10.0
- Livability +4.0/5.0
- 1% rule +3.4/10.0
- Rent growth +2.5/5.0
- Condition / age +2.5/5.0
- Appreciation +0.0/10.0
$839,900
🖨 Deal sheet (PDF) 📄 Offer letter ✓ Due diligence
Listing remarks
Set on a quiet residential street in the highly sought-after Poets Corner neighborhood, this lovingly maintained home offers a gracious layout and the opportunity to personalize at your own pace. Designed for both entertaining and everyday living, the heart of the home features a charming country kitchen with a spacious eat-in dining area and seamless access to either a formal dining room or a cozy family room. Rounding out the main level is a generously sized living room that comfortably accommodates gatherings both large and small. A striking floating staircase serves as an architectural focal point, adding visual interest while connecting the main living spaces to the upper level. Upstai
Key facts
- 9,579 sq ft lot
- 2 garage spots
- Built 1975
Neighborhood map
What this means for you Summary
Snapshot
- This is a 4-bed/2.5-bath single-family listed at $840k.
Deal economics
- At list price, monthly cash flow is $85 ($1k/yr) — positive.
- The deal already cash-flows at list — no discount required.
- To meet the 1% rule (rent ≥ 1% of price), the offer needs to be $704k (16.2% below list).
- Recommended offer: $704k (16.2% below list) — sets the bar for 1% rule.
Location & tenants
- Location reads 81/100 on livability (#94 in NY, #1,430 nationally) — a professional / high-income tenant draw. Strengths: crime A+, employment A+, housing A+; Watch: amenities F, cost of living F.
- Greenburgh Central School District (suburban): math 51% / reading 55% proficiency, ranked #267 of 590 in NY (top 45%) — acceptable for families but not a draw, mixed tenant base, ~2y average lease.
- Zoned schools: Lee F Jackson School (261 students, 41% FRL); Richard J Bailey School (math 45% / reading 53%, grade C-, #294 of 729 statewide, top 41%, 336 students, 0% FRL); Woodlands Middle/High School (math 62% / reading 52%, grade C, #887 of 1,100 statewide, top 82%, 681 students, 66% FRL).
- Market conditions: 156 active listings in the ZIP; 5 comparable units currently listed for rent nearby; rentals at typical pace (median 18d on market — plan ~3-4 weeks tenant-placement turnaround); 954 units permitted in Westchester County in 2024 (649 in 5+ unit buildings).
Forward outlook
- Local home prices are declining (-3.0%/yr); year-one equity from $6k of loan paydown is wiped out by about $25k of value loss. Plan a longer hold.
- Westchester County population projected at +10% by 2050 — modest demand growth; plan on rents tracking national, not racing it.
Negotiation context
- Only 14 days on market — expect competitive offers; lowballing is unlikely to land.
Risks & watch-outs
- Climate carrying-cost: major wind risk, 27% chance of damaging wind over 30y; extreme-heat days projected 7→15/yr by 2055 (HVAC capex compounding) — expect insurance premiums to compound above CPI over the hold.
Questions for the listing agent
- Built in 1975 — when were the roof, HVAC, electrical panel, plumbing, and water heater last replaced?
- Is there a deadline driving the sale (1031 exchange, divorce, estate, relocation)? That informs how much negotiation room exists.
- Schools are B-rated — typically a magnet for longer-tenancy family renters. What's the average tenant stay here, and is there a school-zone premium baked into asking?
- The area grade is low — what's the realistic commute time and amenity access for the typical tenant pool here? Any planned neighborhood developments (good or bad) we should know about?
- What's the average days-on-market for RENTAL listings here right now (not sales)? A rising rental-DOM trend means longer vacancies and softer asking-rent achievability than the comps imply.
- What's the recent tenant-quality profile in this submarket — average credit score on applications, eviction rate, late-payment / NSF rate, and stable-employment percentage? A property-management company in the area should have these aggregated.
- How much new for-sale + rental construction is in the pipeline within 1–3 miles? Heavy new supply typically softens prices + rents 12–24 months out; constrained supply supports both.
Investment metrics
- 1% rule
- 0.84% ✗
- Cap rate
- 6.41%
- Cash-on-cash
- 0.44%
- DSCR
- 1.02
- GRM
- 9.9
CMA / ARV
- ARV (on-the-fly)
- $943,658
- Comps found
- 12
Show comp detail 12 sales within ~0.75 mi
| Address | Dist | Beds/Ba | Sqft | Sold | Price | $/sf | Match |
|---|---|---|---|---|---|---|---|
| 206 Emerson Ave | 0.00mi | 4/2.5 | 2,371 (0%) | 1mo | $899,000 | $379 | 99 |
| 132 Holmes Ave | 0.06mi | 4/4.0 | 2,520 (+6%) | 4mo | $885,000 | $351 | 78 |
| 6 Burns St | 0.11mi | 3/2.5 (-1) | 2,394 (+1%) | 17mo | $953,000 | $398 | 74 |
| 12 Jennifer Ln | 0.43mi | 4/2.0 | 2,280 (-4%) | 3mo | $775,000 | $340 | 69 |
| 1 Topland Rd | 0.55mi | 4/2.5 | 2,325 (-2%) | 12mo | $1,035,000 | $445 | 61 |
| 8 Hood Ct | 0.25mi | 3/2.5 (-1) | 2,574 (+9%) | 10mo | $1,200,000 | $466 | 61 |
| 320 W Hartsdale Ave | 0.45mi | 3/3.0 (-1) | 2,428 (+2%) | 14mo | $1,030,000 | $424 | 57 |
| 18 Barnaby Ln | 0.64mi | 3/2.0 (-1) | 2,352 (-1%) | 7mo | $950,000 | $404 | 56 |
| 67 Ridge Rd | 0.66mi | 4/2.5 | 2,254 (-5%) | 10mo | $875,000 | $388 | 53 |
| 445 Ridge Rd | 0.44mi | 3/2.0 (-1) | 2,585 (+9%) | 10mo | $880,000 | $340 | 49 |
| 29 Whittier St | 0.31mi | 3/2.0 (-1) | 2,072 (-13%) | 14mo | $878,000 | $424 | 46 |
| 13 Jean Ln | 0.45mi | 5/3.0 (+1) | 2,608 (+10%) | 18mo | $920,000 | $353 | 41 |
Match score weights: distance 35% · size 25% · config 20% · recency 20%. Top-matched comps best support the ARV.
Projected returns pro-forma
-3.0% appreciation · 3.0% rent growth · sell at horizon
- IRR
- -15.6%
- Equity multiple
- 0.44×
- Total profit
- $-130,760
- Equity at exit
- $125,232
- IRR
- -7.2%
- Equity multiple
- 0.54×
- Total profit
- $-107,250
- Equity at exit
- $72,619
Cash invested: $235,172 (down + closing). Projections, not guarantees.
Landlord ↔ Tenant lean methodology
- Overall (STATE)
- 15 Strongly Tenant-Friendly
- State New York
- 15 Strongly Tenant-Friendly · D+10
- County
- — inherits STATE
- City
- — inherits STATE
ZIP-level market 10530
- Active inventory
- 156
- Price-to-rent
- 9.9×
Monthly cashflow live
- Estimated rent
- $7,043 high interval (Pro) →
- Mortgage (P&I)
- −$4,405
- Tax from tax record
- −$724 /mo · $8,686/yr
- Insurance
- −$350
- HOA
- −$0
- Vacancy / Maint / Mgmt
- −$1,479
- Net cashflow
- $85
Break-even live
Sensitivity live
| Price | -10% $561 | -5% $323 | +0% $85 | +5% $-152 | +10% $-390 |
|---|---|---|---|---|---|
| Rent | -10% $-471 | -5% $-193 | +0% $85 | +5% $363 | +10% $642 |
| Rate | -1.0pp $508 | -0.5pp $299 | base $85 | +0.5pp $-132 | +1.0pp $-354 |
UW: 25.0% down · 7.5% · 30yr · 1.5% tax · 5.0% vac · 8.0% maint · 8.0% mgmt
Financing live
Cash to close
- Down payment
- $209,975
- Closing costs
- $25,197
- Reserves months
- —
- Total cash needed
- —
Loan-product check · same deal, 3 products live
Conventional
25% down · 7.5% · 30yr
- Down + closing
- —
- Monthly P&I
- —
- Monthly cashflow
- —
- DSCR
- —
- Eligible?
- —
Personal DTI + credit; lowest rate.
DSCR
20% down · 8.5% · 30yr
- Down + closing
- —
- Monthly P&I
- —
- Monthly cashflow
- —
- DSCR
- —
- Eligible?
- —
No personal income docs; deal must DSCR.
Hard money
10% down · 12.0% · 12mo
- Down + closing
- —
- Monthly P&I
- —
- Monthly cashflow
- —
- DSCR
- —
- Eligible?
- —
Short-term bridge; refi at stabilization.
Rent comps 5 comps
| Address | Beds | Baths | Sqft | Rent | $/sqft | DOM | Units | Dist |
|---|---|---|---|---|---|---|---|---|
| 19 Primrose Ave W White Plains, NY | 4.0 | 2.5 | 2717 | $8,550 | $3.15 | 5d | 1 | 0.76mi |
| 15 Homewood Rd Hartsdale, NY | 3.0 | 2.0 | 1868 | $7,000 | $3.75 | 26d | 1 | 0.79mi |
| 181 Finmor Dr White Plains, NY | 3.0 | 1.5 | 1789 | $6,200 | $3.47 | 20d | 1 | 1.23mi |
| 12 Francine Ct White Plains, NY | 4.0 | 2.5 | 2000 | $6,800 | $3.40 | 17d | 1 | 1.26mi |
| 30 Mortimer Ter White Plains, NY | 4.0 | 2.5 | 2849 | $5,250 | $1.84 | 17d | 1 | 1.48mi |
Listing history 3 events
-
2026-02-27status Pending
-
2026-02-14$839,900 Active
-
2026-02-12historical $839,900
ⓘ Source: listings_history table (triggers on properties + properties_extension) + one-shot
backfill from property_details.listing_events for pre-trigger history.
Tax reassessment forecast NY · Partial reset (capped growth)
- Current annual tax
- $8,686 · $724/mo
- Projected year-2 tax
- $11,440 · $953/mo
- Expected delta
- +$2,754/yr (+$230/mo · 31.7%)
ⓘ Screening estimate from a state-policy table — verify with the county assessor before closing.
Climate risk First Street
- Flood 1/10 Low FEMA zone X (unshaded) · 0% chance over 30 yrs
- Wildfire 3/10 Moderate
- Heat 5/10 Major 7 d/yr ≥98°F today · 15 d/yr by 30 yrs out
- Wind 6/10 Major 27% chance of damaging wind over 30 yrs
- Air quality 4/10 Moderate 3 unhealthy d/yr today · 5 by 30 yrs out
Nearby sold comps map
Loading sold comps map…
Walkable amenities ~0.75 mi
Loading nearby amenities…
Taxation est. · year 1
- Rental income
- $84,510
- − Mortgage interest
- −$47,047
- − Property taxes
- −$8,686
- − Insurance
- −$4,200
- − Repairs & maintenance
- −$6,761
- − Management
- −$6,761
- − Depreciation
- −$24,433
- Taxable loss
- −$13,377
- Est. tax savings @ 24.0%
- +$3,211
- After-tax cash flow
- $4,234/yr
For passive investors: Depreciation is non-cash, so a rental often shows a tax loss while cash-flowing — sheltering income. Rental losses are passive: they offset passive income freely, and up to $25,000/yr can offset ordinary (W-2) income if you actively participate and your MAGI is under $100k (phasing out to $0 by $150k); unused losses carry forward. On sale, claimed depreciation is recaptured at up to 25%, and gains may owe capital-gains tax (a 1031 exchange can defer both). Figures are a year-1 estimate at your 24.0% rate — not tax advice; consult a CPA.
Schools (NCES district)
- District
- Greenburgh Central School District
- NCES district ID
- 3612720
- Math proficiency
- 51% ▲ 4.00%
- Reading proficiency
- 55% ▲ 5.00%
- Median HH income
- $93,626
- Composite
- 49.43/100
- National rank
- #2005
- State rank
- #267 of 590 in NY
Livability — Hartsdale
- Score
- 81/100
- State rank
- #94
- US rank
- #1430
Category grades
Schools grade is shown separately in the Schools card above.
Census & demographics
- Population (ZIP)
- 13,955
Population outlook (Westchester County) Hauer SSP2
- Today (2025)
- 1,028,035 people
- By 2030
- 1,051,636 · +2.3%
- By 2040
- 1,098,520 · +6.9%
- By 2050
- 1,136,044 · +10.5%
- By 2075
- 1,196,925 · +16.4%
- By 2100
- 1,175,147 · +14.3%
Race, ethnicity, and origin ACS 2023
- Neighborhood character
- Predominantly White (68%)
- Race & ethnicity
- White 68% Hispanic / Latino 12% Asian 10% Two or more races 9% Black 7%
- Hispanic origin (detail)
- Mexican 2% Puerto Rican 4% Dominican 2%
- Common ancestry
- Romanian 9% Scotch-Irish 5% Italian 2%
- Foreign-born
- 23% · Canada, China, South Korea
- Languages at home
- 71% English-only · Spanish 9% Other Indo-European 6% Russian/Polish/Slavic 5%
Political lean MEDSL · Westchester
- 2024 margin
- Strong D (+26.3) · D 63.1% · R 36.9%
- 2008→2024 swing
- -1.3pp toward R · 2008: 27.6pp · 2024: 26.3pp
- All cycles
- 2024: D+26.3 2020: D+36.3 2016: D+32.8 2012: D+22.2 2008: D+27.6
Not yet ingested
- Civics
- —
Market trends
- HPI YoY
- ▼ -616.16%
- Current HPI
- 320.7324
- Rent YoY
- —
- Metro
- —
- State GDP YoY
- ▲ 2.60%
- F500 in state
- 92
Industry mix (Fortune 500 HQ in NY)
| Industry | F500 HQs | Revenue |
|---|---|---|
| Financial Services | 10 | $950B |
|
||
| Consumer Goods | 9 | $162B |
|
||
| Insurance | 4 | $225B |
|
||
| Telecommunications | 2 | $144B |
|
||
| Pharmaceuticals | 2 | $112B |
|
||
| Media / Entertainment | 2 | $69B |
|
||
Price history
+0.0% since first listed3 events — show timeline
- 2026-02-27 Pending — OneKey® MLS as Distributed by MLS Grid
- 2026-02-14 Listed $839,900 OneKey® MLS as Distributed by MLS Grid
- 2026-02-12 Coming Soon $839,900 OneKey® MLS as Distributed by MLS Grid
Property tax history
-1.6%/yrLatest (2025): $8,686 · +10.6% YoY. Source: county tax records.
Cash-flow waterfall
monthlySold comps — $/sqft
last 12 mo · ≤1 miLoading sold comps…