401 Golden Isles Dr #712 · Hallandale Beach, FL
Flood risk 8/10 · Major
- FEMA flood zone
- X (shaded)
- Chance of flooding over 30 yrs
- 0.98%
- Est. flood insurance / yr
- $507 – $1,088
Fire risk 1/10 · Minimal
- Est. fire insurance / yr
- $947 – $1,759
Heat risk 10/10 · Severe
- Hot days now (above 103°F)
- 6 days/yr
- Hot days in 30 yrs
- 21 days/yr
Wind risk 10/10 · Severe
- Chance of severe wind over 30 yrs
- 99.0%
Air-quality risk 2/10 · Minimal
- Unhealthy air days now
- 1 days/yr
- Unhealthy air days in 30 yrs
- 2 days/yr
Risk factors via First Street. Map © Google.
Why this score? — see what drove the D grade
The composite is a weighted blend of 9 inputs, each scored 0–100. Each bar is that input's sub-score; the figure is the points it added to the 100-point composite (weight × sub-score).
- Cash flow +10.6/30.0
- 1% rule +9.8/10.0
- ARV discount +7.5/15.0
- Schools +4.1/10.0
- Livability +4.0/5.0
- DSCR +3.1/10.0
- Rent growth +2.6/5.0
- Condition / age +2.5/5.0
- Appreciation +0.0/10.0
$279,900
🖨 Deal sheet (PDF) 📄 Offer letter ✓ Due diligence
Listing remarks
Bright and spacious corner unit featuring 2 bedrooms and 2 bathrooms in the heart of Hallandale Beach. This residence offers ceramic flooring throughout, abundant natural light, and a large wraparound balcony with views of the bay and pool area. Functional split floor plan with spacious living and dining areas, ideal for full-time residence or seasonal use. Well-maintained building with amenities including pool, fitness center, sauna, lounge room, and on-site management. Conveniently located near beaches, shopping, dining, parks, and major highways. Pet-friendly building. Building has completed the 40-year certification and is currently undergoing the 50-year recertification process. Great
Key facts
- Ceramic flooring
- Views of the bay
- Corner unit
Tags
Property features AI
Finance
- Other: Association pool
- Financial info: Pets allowed with restrictions or conditions
- HOA & community: Monthly association fee (includes cable TV); Association amenities: fitness center, pool, elevators
Exterior
- Parking: Attached garage with 1 covered space
- Security: Key card entry; Fire sprinkler system
- Utilities: Cable available
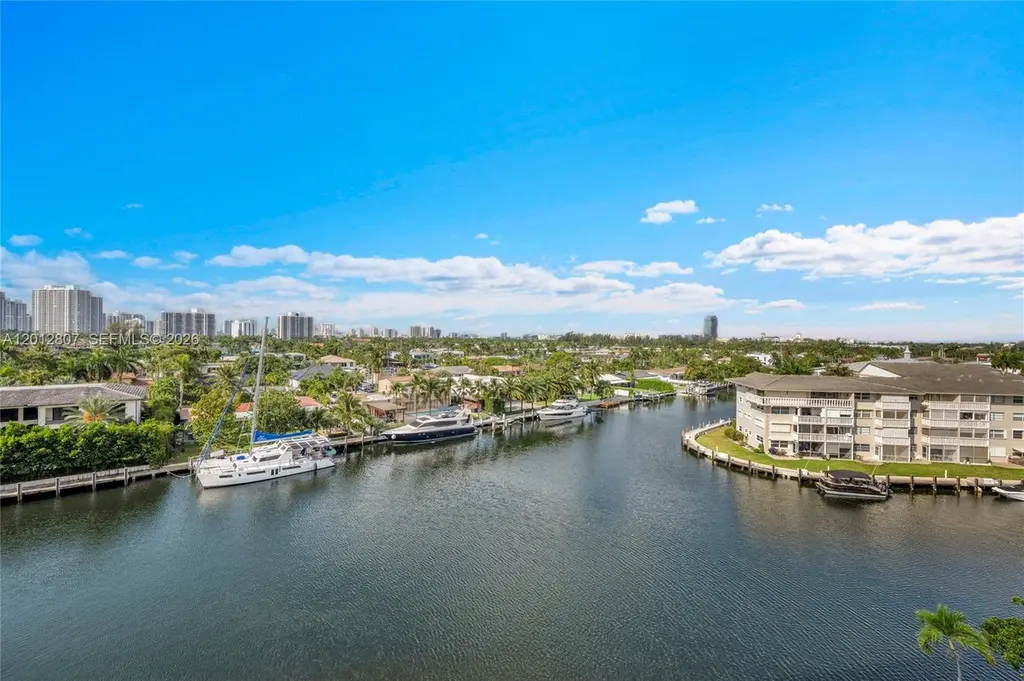
- Home design: Condominium; 11-story building; Entry on level 7; Southeast-facing; Waterfront with bay front view
- Construction: Block construction; Resale property
- Exterior features: Balcony (open)
Interior
- Kitchen: Dishwasher; Microwave; Refrigerator
- Bedrooms: Bedroom on main level
- Flooring: Ceramic tile
- Bathrooms: 2 full bathrooms
- Heating & cooling: Central heating; Central electric air conditioning
- Interior features: Impact glass windows; Closet cabinetry; Open living/dining area
Neighborhood map
What this means for you Summary
Snapshot
- This is a 2-bed/2.0-bath condo listed at $280k.
Deal economics
- At list price, monthly cash flow is $-204 ($-2k/yr) — negative.
- To cash-flow at today's rent, offer at most $244k (12.9% below list).
- Meets the 1% rule at list price ($4k rent vs $280k).
- Recommended offer: $244k (12.9% below list) — sets the bar for cash-flow.
Location & tenants
- Location reads 81/100 on livability (#86 in FL, #1,400 nationally) — a professional / high-income tenant draw. Strengths: commute A+, health & safety A+, crime B+; Watch: schools C-, employment D-.
- Broward (suburban): math 42% / reading 53% proficiency, ranked #46 of 73 in FL (top 63%) — families likely to look elsewhere, expect single-tenant / working-renter base with shorter leases.
- Market conditions: Rents flat; 1380 active listings in the ZIP; 40 comparable units currently listed for rent nearby; rentals at typical pace (median 22d on market — plan ~3-4 weeks tenant-placement turnaround); 2,111 units permitted in Broward County in 2024 (1,265 in 5+ unit buildings).
- At $4,131/mo this rent would consume 95% of the median local household income ($52k/yr) (locally 3293% of renters already pay >50% of income on rent) — very limited rent-growth headroom before tenants either downsize or default.
Forward outlook
- Local home prices are declining (-3.0%/yr); year-one equity from $2k of loan paydown is wiped out by about $8k of value loss. Plan a longer hold.
- Broward County population projected at +34% by 2050 — long-run rental-demand tailwind backs the buy-and-hold thesis.
Negotiation context
- It's been on market 48 days — a 3% lower offer ($272k) is reasonable based on typical stale-listing flexibility.
- 10 sale attempts since 12y ago with the ask held roughly flat each time — persistent listings suggest the price (not the market) is what's stuck; bring a comps-based counter.
- Current owner paid $178k; list at $280k implies a 57% gain — meaningful room to come down on a strong offer.
Risks & watch-outs
- Watch-outs: property tax is 2.6% of price; flood insurance adds $66/mo; HOA is 29% of rent.
- Climate carrying-cost: severe flood risk; severe wind risk, 99% chance of damaging wind over 30y; extreme-heat days projected 6→21/yr by 2055 (HVAC capex compounding) — expect insurance premiums to compound above CPI over the hold.
Questions for the listing agent
- What do current leases actually rent for vs. the listed asking? Can we see a recent rent roll and the last 12 months of T-12 income?
- It's been on market 48 days. Have you received any prior offers? Is the seller open to a 13% concession, seller financing, or rate buy-down credit?
- Built in 1970 — when were the roof, HVAC, electrical panel, plumbing, and water heater last replaced?
- Property tax is high relative to price — has the assessment been appealed recently, and will the sale trigger a re-assessment?
- What's the actual annual flood-insurance premium (NFIP or private), and is the property in a SFHA with mandatory coverage?
- What does the HOA fee cover, when was the last increase, and are there any pending special assessments or reserve-fund shortfalls?
- Any open or pending special assessments — roof, HVAC, plumbing, elevator, façade? What's the per-unit balance and payoff schedule, and is the seller paying it off at close or rolling it to the buyer?
- Is there a deadline driving the sale (1031 exchange, divorce, estate, relocation)? That informs how much negotiation room exists.
- The area grade is low — what's the realistic commute time and amenity access for the typical tenant pool here? Any planned neighborhood developments (good or bad) we should know about?
- What's the average days-on-market for RENTAL listings here right now (not sales)? A rising rental-DOM trend means longer vacancies and softer asking-rent achievability than the comps imply.
- What's the recent tenant-quality profile in this submarket — average credit score on applications, eviction rate, late-payment / NSF rate, and stable-employment percentage? A property-management company in the area should have these aggregated.
- How much new apartment / multifamily construction is in the pipeline within 1–3 miles? Heavy new supply (>2% of stock underway) typically softens rents 12–24 months out; light construction supports rent growth.
Investment metrics
- 1% rule
- 1.48% ✓
- Cap rate
- 5.70%
- Cash-on-cash
- -2.11%
- DSCR
- 0.91
- GRM
- 5.6
CMA / ARV
No comps found within radius.
Projected returns pro-forma
-3.0% appreciation · 0.43% rent growth · sell at horizon
- IRR
- -26.7%
- Equity multiple
- 0.14×
- Total profit
- $-67,768
- Equity at exit
- $41,734
- IRR
- -54.5%
- Equity multiple
- -0.43×
- Total profit
- $-112,266
- Equity at exit
- $24,201
Cash invested: $78,372 (down + closing). Projections, not guarantees.
Landlord ↔ Tenant lean methodology
- Overall (STATE)
- 87 Strongly Landlord-Friendly
- State Florida
- 87 Strongly Landlord-Friendly · R+3
- County
- — inherits STATE
- City
- — inherits STATE
ZIP-level market 33009
- Rents YoY
- 0.4%
- Active inventory
- 1380
- Price-to-rent
- 5.6×
Monthly cashflow live
- Estimated rent
- $4,131 high interval (Pro) →
- Mortgage (P&I)
- −$1,468
- Tax from tax record
- −$600 /mo · $7,197/yr
- Insurance
- −$117
- Flood insurance flood zone
- −$66 /mo · $798/yr
- HOA
- −$1,217
- Vacancy / Maint / Mgmt
- −$868
- Net cashflow
- $-204
Break-even live
Sensitivity live
| Price | -10% $-46 | -5% $-125 | +0% $-204 | +5% $-283 | +10% $-363 |
|---|---|---|---|---|---|
| Rent | -10% $-530 | -5% $-367 | +0% $-204 | +5% $-41 | +10% $122 |
| Rate | -1.0pp $-63 | -0.5pp $-133 | base $-204 | +0.5pp $-277 | +1.0pp $-350 |
UW: 25.0% down · 7.5% · 30yr · 1.5% tax · 5.0% vac · 8.0% maint · 8.0% mgmt
Financing live
Cash to close
- Down payment
- $69,975
- Closing costs
- $8,397
- Reserves months
- —
- Total cash needed
- —
Loan-product check · same deal, 3 products live
Conventional
25% down · 7.5% · 30yr
- Down + closing
- —
- Monthly P&I
- —
- Monthly cashflow
- —
- DSCR
- —
- Eligible?
- —
Personal DTI + credit; lowest rate.
DSCR
20% down · 8.5% · 30yr
- Down + closing
- —
- Monthly P&I
- —
- Monthly cashflow
- —
- DSCR
- —
- Eligible?
- —
No personal income docs; deal must DSCR.
Hard money
10% down · 12.0% · 12mo
- Down + closing
- —
- Monthly P&I
- —
- Monthly cashflow
- —
- DSCR
- —
- Eligible?
- —
Short-term bridge; refi at stabilization.
Rent comps 40 comps
| Address | Beds | Baths | Sqft | Rent | $/sqft | DOM | Units | Dist |
|---|---|---|---|---|---|---|---|---|
| 201 Golden Isles Dr #302 Hallandale Beach, FL | 2.0 | 2.0 | 1150 | $3,975 | $3.46 | 25d | 1 | 0.14mi |
| 121 Golden Isles Dr #1 Hallandale Beach, FL | 2.0 | 2.0 | 1379 | $4,000 | $2.90 | 25d | 1 | 0.25mi |
| 2017 S Ocean Dr #1107 Hallandale Beach, FL | 2.0 | 2.0 | 1270 | $3,900 | $3.07 | 15d | 1 | 0.35mi |
| 1965 S Ocean Dr Unit 14F Hallandale Beach, FL | 2.0 | 2.0 | 1275 | $4,800 | $3.76 | 0d | 1 | 0.37mi |
| 1985 S Ocean Dr Unit 9G Hallandale Beach, FL | 2.0 | 2.0 | 1240 | $3,700 | $2.98 | 25d | 1 | 0.37mi |
| 1985 S Ocean Dr Unit 22P Hallandale Beach, FL | 2.0 | 2.0 | 1380 | $4,000 | $2.90 | 25d | 1 | 0.37mi |
| 1985 S Ocean Dr Unit 21P Hallandale Beach, FL | 2.0 | 2.0 | 1380 | $3,800 | $2.75 | 8d | 1 | 0.37mi |
| 1985 S Ocean Dr Unit 22E Hallandale Beach, FL | 3.0 | 2.5 | 1780 | $5,900 | $3.31 | 8d | 1 | 0.37mi |
| 1985 S Ocean Dr Unit 22E Hallandale Beach, FL | 3.0 | 2.5 | 1780 | $5,900 | $3.31 | 25d | 1 | 0.37mi |
| 1945 S Ocean Dr Hallandale Beach, FL | 2.0–3.0 | 2.0–3.0 | 1542 | $4,500 | $2.92 | 13d | 2 | 0.40mi |
| 1945 S Ocean Dr Hallandale Beach, FL | 2.0–3.0 | 2.0–3.0 | 1542 | $4,500 | $2.92 | 8d | 2 | 0.40mi |
| 1945 S Ocean Dr Hallandale Beach, FL | 2.0–3.0 | 2.0–2.5 | 1522 | $3,650 | $2.40 | 19d | 3 | 0.40mi |
| 1945 S Ocean Dr Hallandale Beach, FL | 2.0–3.0 | 2.0–3.0 | 1542 | $4,000 | $2.59 | 16d | 3 | 0.40mi |
| 2069 S Ocean Dr Unit TH16 Hallandale Beach, FL | 3.0 | 3.0 | 1614 | $4,500 | $2.79 | 25d | 1 | 0.42mi |
| 2069 S Ocean Dr Unit TH16 Hallandale Beach, FL | 3.0 | 3.0 | 1614 | $4,500 | $2.79 | 4d | 1 | 0.42mi |
| 2069 S Ocean Dr Unit TH12 Hallandale Beach, FL | 3.0 | 3.0 | 1500 | $4,800 | $3.20 | 11d | 1 | 0.42mi |
| 2069 S Ocean Dr Unit TH12 Hallandale Beach, FL | 3.0 | 3.0 | 1500 | $4,800 | $3.20 | 25d | 1 | 0.42mi |
| 2602 E Hallandale Beach Blvd Hallandale Beach, FL | 1.0–2.0 | 1.0–2.0 | 1070 | $5,950 | $5.56 | 21d | 4 | 0.43mi |
| 2602 E Hallandale Beach Blvd Hallandale Beach, FL | 3.0 | 1.0–3.0 | 1011 | $5,495 | $5.44 | 2d | 5 | 0.43mi |
| 2602 E Hallandale Beach Blvd Hallandale Beach, FL | 1.0–2.0 | 1.0–2.0 | 1092 | $5,950 | $5.45 | 25d | 3 | 0.43mi |
| 2601 E Hallandale Beach Blvd Unit 1227344P Hallandale Beach, FL | 1.0–2.0 | 1.0–2.0 | 844 | $4,219 | $5.00 | 2d | 2 | 0.43mi |
| 2600 E Hallandale Beach Blvd Unit T3110 Hallandale Beach, FL | 2.0 | 2.0 | 1028 | $3,650 | $3.55 | 25d | 1 | 0.43mi |
| 2600 E Hallandale Beach Blvd Unit T3208 Hallandale Beach, FL | 2.0 | 2.0 | 1030 | $6,950 | $6.75 | 25d | 1 | 0.43mi |
| 2600 E Hallandale Beach Blvd Unit T3307 Hallandale Beach, FL | 2.0 | 2.0 | 1030 | $4,500 | $4.37 | 25d | 1 | 0.43mi |
| 2600 E Hallandale Beach Blvd Unit T2002 SEASONAL Hallandale Beach, FL | 3.0 | 3.0 | 1577 | $7,500 | $4.76 | 25d | 1 | 0.43mi |
| 1980 S Ocean Dr Unit 15Q Hallandale Beach, FL | 3.0 | 2.5 | 1740 | $4,250 | $2.44 | 25d | 1 | 0.49mi |
| 1880 N Ocean Dr Unit TS705 Hallandale Beach, FL | 2.0 | 2.0 | 1350 | $5,000 | $3.70 | 17d | 1 | 0.49mi |
| 1880 N Ocean Dr Unit TS705 Hallandale Beach, FL | 2.0 | 2.0 | 1350 | $5,000 | $3.70 | 25d | 1 | 0.49mi |
| 1880 N Ocean Dr Unit TS705 Hallandale Beach, FL | 2.0 | 2.0 | 1350 | $4,900 | $3.63 | 16d | 1 | 0.49mi |
| 1745 E Hallandale Beach Blvd Unit 802W Hallandale Beach, FL | 3.0 | 2.0 | 1481 | $3,600 | $2.43 | 25d | 1 | 0.50mi |
| 1745 E Hallandale Beach Blvd Unit 2302W Hallandale Beach, FL | 3.0 | 2.0 | 1481 | $3,900 | $2.63 | 25d | 1 | 0.50mi |
| 1745 E Hallandale Beach Blvd Unit 2302W Hallandale Beach, FL | 3.0 | 2.0 | 1481 | $3,900 | $2.63 | 16d | 1 | 0.50mi |
| 1950 S Ocean Dr Unit LE Hallandale Beach, FL | 3.0 | 2.5 | 1780 | $4,500 | $2.53 | 25d | 1 | 0.51mi |
| 1950 S Ocean Dr Unit 19E Hallandale Beach, FL | 3.0 | 2.5 | 1780 | $4,000 | $2.25 | 25d | 1 | 0.51mi |
| 1950 S Ocean Dr Unit 19E Hallandale Beach, FL | 3.0 | 2.5 | 1780 | $4,000 | $2.25 | 8d | 1 | 0.51mi |
| 1904 S Ocean Dr #1707 Hallandale Beach, FL | 2.0 | 2.0 | 1350 | $5,000 | $3.70 | 25d | 1 | 0.51mi |
| 2030 S Ocean Dr Hallandale Beach, FL | 2.0 | 2.0 | 1280 | $4,775 | $3.73 | 3d | 8 | 0.51mi |
| 2030 S Ocean Dr Hallandale Beach, FL | 2.0 | 2.0 | 1280 | $4,850 | $3.79 | 6d | 7 | 0.51mi |
| 2030 S Ocean Dr Hallandale Beach, FL | 2.0 | 2.0 | 1280 | $4,750 | $3.71 | 3d | 9 | 0.51mi |
| 2030 S Ocean Dr Hallandale Beach, FL | 2.0 | 2.0 | 1280 | $4,800 | $3.75 | 4d | 7 | 0.51mi |
HOA detail condo
- Monthly dues
- $1,217 · $14,604/yr
- Likely covers
- poolgym
- Assessments
- None detected in remarks — confirm with the listing agent.
Listing history 45 events
-
2026-06-21days on market $279,900 Active 48 DOM
-
2026-06-18days on market $279,900 Active 45 DOM
-
2026-06-17days on market $279,900 Active 44 DOM
-
2026-06-16days on market $279,900 Active 43 DOM
-
2026-06-15days on market $279,900 Active 42 DOM
-
2026-06-13days on market $279,900 Active 40 DOM
-
2026-06-09days on market $279,900 Active 36 DOM
-
2026-06-08days on market $279,900 Active 35 DOM
-
2026-06-07days on market $279,900 Active 34 DOM
-
2026-06-04days on market $279,900 Active 31 DOM
-
2026-06-03days on market $279,900 Active 30 DOM
-
2026-06-02days on market $279,900 Active 29 DOM
-
2026-06-01days on market $279,900 Active 28 DOM
-
2026-05-31days on market $279,900 Active 27 DOM
-
2026-05-04$279,900 Active
-
2026-04-27historical
-
2026-03-03price $280,000
-
2026-02-03historical $2,500
-
2026-01-01$2,500
-
2025-12-23historical $2,500
-
2025-11-27$2,500
-
2025-11-01historical $2,700
-
2025-10-30$2,700
-
2025-10-27price $299,000
-
2025-10-14historical $2,600
-
2025-09-27historical $2,600
-
2025-08-23$2,600
-
2025-07-24price $339,000
-
2025-06-21$2,700
-
2025-06-21historical $2,700
-
2025-06-14$2,700
-
2025-05-15price $358,000
-
2025-04-02$380,000 Active
-
2017-03-08historical
-
2016-12-09price $289,000
-
2016-10-10price $309,000
-
2016-09-26price $319,000
-
2016-09-19$329,000 Active
-
2014-07-31soldstatus $178,000
-
2014-07-25soldstatus $178,000 Sold
-
2014-03-13status Pending
-
2014-03-13price $199,900
-
2014-02-26$219,900 Active
-
1999-09-30soldstatus $78,000
-
1995-09-25soldstatus $119,800
ⓘ Source: listings_history table (triggers on properties + properties_extension) + one-shot
backfill from property_details.listing_events for pre-trigger history.
Tax reassessment forecast FL · Resets to sale price
- Current annual tax
- $7,197 · $600/mo
- Projected year-2 tax
- $7,197 · $600/mo
- Expected delta
- $0/yr ($0/mo · 0.0%)
ⓘ Screening estimate from a state-policy table — verify with the county assessor before closing.
Climate risk First Street
- Flood 8/10 Severe FEMA zone X (shaded) · 98% chance over 30 yrs
- Wildfire 1/10 Low
- Heat 10/10 Extreme 6 d/yr ≥103°F today · 21 d/yr by 30 yrs out
- Wind 10/10 Extreme 99% chance of damaging wind over 30 yrs
- Air quality 2/10 Low 1 unhealthy d/yr today · 2 by 30 yrs out
Nearby sold comps map
Loading sold comps map…
Walkable amenities ~0.75 mi
Loading nearby amenities…
Taxation est. · year 1
- Rental income
- $49,572
- − Mortgage interest
- −$15,679
- − Property taxes
- −$7,197
- − Insurance
- −$2,197
- − Repairs & maintenance
- −$3,966
- − Management
- −$3,966
- − HOA
- −$14,604
- − Depreciation
- −$8,143
- Taxable loss
- −$6,178
- Est. tax savings @ 24.0%
- +$1,483
- After-tax cash flow
- $-967/yr
For passive investors: Depreciation is non-cash, so a rental often shows a tax loss while cash-flowing — sheltering income. Rental losses are passive: they offset passive income freely, and up to $25,000/yr can offset ordinary (W-2) income if you actively participate and your MAGI is under $100k (phasing out to $0 by $150k); unused losses carry forward. On sale, claimed depreciation is recaptured at up to 25%, and gains may owe capital-gains tax (a 1031 exchange can defer both). Figures are a year-1 estimate at your 24.0% rate — not tax advice; consult a CPA.
Schools (NCES district)
- District
- Broward
- NCES district ID
- 1200180
- Math proficiency
- 42% ▼ -18.00%
- Reading proficiency
- 53% ▼ -5.00%
- Median HH income
- $52,139
- Composite
- 40.88/100
- National rank
- #3621
- State rank
- #46 of 73 in FL
Livability — Hallandale Beach
- Score
- 81/100
- State rank
- #86
- US rank
- #1400
Category grades
Schools grade is shown separately in the Schools card above.
Census & demographics
- Census place
- Hallandale Beach, FL
- County
- Broward County · 1,963,430 people
- City population
- 44,021
- Metro
- Miami-Fort Lauderdale-Pompano Beach, FL
- Population (ZIP)
- 44,502
- Household income
- $52,079
- Rent vs Own
- Severe rent burden
- 3293.0
Population outlook (Broward County) Hauer SSP2
- Today (2025)
- 2,207,033 people
- By 2030
- 2,360,704 · +7.0%
- By 2040
- 2,661,208 · +20.6%
- By 2050
- 2,946,698 · +33.5%
- By 2075
- 3,602,273 · +63.2%
- By 2100
- 3,970,984 · +79.9%
Race, ethnicity, and origin ACS 2023
- Neighborhood character
- Diverse neighborhood (Simpson 0.67)
- Race & ethnicity
- Hispanic / Latino 39% White 39% Two or more races 24% Black 17% Asian 1%
- Hispanic origin (detail)
- Mexican 2% Puerto Rican 3% Cuban 9% Dominican 3% Salvadoran 2%
- Common ancestry
- Scotch-Irish 5% Hispanic 5% Subsaharan African 3%
- Foreign-born
- 51% · Canada, Jamaica, Dominican Republic
- Languages at home
- 38% English-only · Spanish 36% Russian/Polish/Slavic 12% French/Haitian/Cajun 7%
Political lean MEDSL · Broward
- 2024 margin
- D (+17.0) · D 58.0% · R 41.0%
- 2008→2024 swing
- -17.8pp toward R · 2008: 34.7pp · 2024: 17.0pp
- All cycles
- 2024: D+17.0 2020: D+29.8 2016: D+35.0 2012: D+34.9 2008: D+34.7
Not yet ingested
- Civics
- —
Market trends
- HPI YoY
- ▼ -299.13%
- Current HPI
- 329.9081
- Rent YoY
- ▲ 0.43%
- Metro
- Miami-Fort Lauderdale-Pompano Beach, FL
- State GDP YoY
- ▲ 3.28%
- F500 in state
- 36
Industry mix (Fortune 500 HQ in FL)
| Industry | F500 HQs | Revenue |
|---|---|---|
| Industrial Technology | 2 | $29B |
|
||
| Insurance | 2 | $17B |
|
||
| Retail | 1 | $60B |
|
||
| Technology Distribution | 1 | $58B |
|
||
| Homebuilding | 1 | $35B |
|
||
| Technology Manufacturing | 1 | $35B |
|
||
Price history
+133.6% since first listed31 events — show timeline
- 2026-05-04 Listed $279,900 MARMLS
- 2026-04-27 Listing Removed — MARMLS
- 2026-03-03 Price Changed $280,000 MARMLS
- 2026-02-03 Rental Removed $2,500 MARMLS
- 2026-01-01 Listed for Rent $2,500 MARMLS
- 2025-12-23 Rental Removed $2,500 MARMLS
- 2025-11-27 Listed for Rent $2,500 MARMLS
- 2025-11-01 Rental Removed $2,700 REALLYO
- 2025-10-30 Listed for Rent $2,700 REALLYO
- 2025-10-27 Price Changed $299,000 MARMLS
- 2025-10-14 Rental Removed $2,600 MARMLS
- 2025-09-27 Rental Removed $2,600 VLS
- 2025-08-23 Listed for Rent $2,600 MARMLS
- 2025-07-24 Price Changed $339,000 MARMLS
- 2025-06-21 Listed for Rent $2,700 VLS
- 2025-06-21 Rental Removed $2,700 MARMLS
- 2025-06-14 Listed for Rent $2,700 MARMLS
- 2025-05-15 Price Changed $358,000 MARMLS
- 2025-04-02 Listed $380,000 MARMLS
- 2017-03-08 Listing Removed — MARMLS
- 2016-12-09 Price Changed $289,000 MARMLS
- 2016-10-10 Price Changed $309,000 MARMLS
- 2016-09-26 Price Changed $319,000 MARMLS
- 2016-09-19 Listed $329,000 MARMLS
- 2014-07-31 Sold (Public Records) $178,000 Public Records
- 2014-07-25 Sold (MLS) $178,000 MARMLS
- 2014-03-13 Pending — MARMLS
- 2014-03-13 Price Changed $199,900 MARMLS
- 2014-02-26 Listed $219,900 MARMLS
- 1999-09-30 Sold (Public Records) $78,000 Public Records
- 1995-09-25 Sold (Public Records) $119,800 Public Records
Property tax history
+9.1%/yrLatest (2025): $7,197 · +7.6% YoY. Source: county tax records.
Cash-flow waterfall
monthlySold comps — $/sqft
last 12 mo · ≤1 miLoading sold comps…