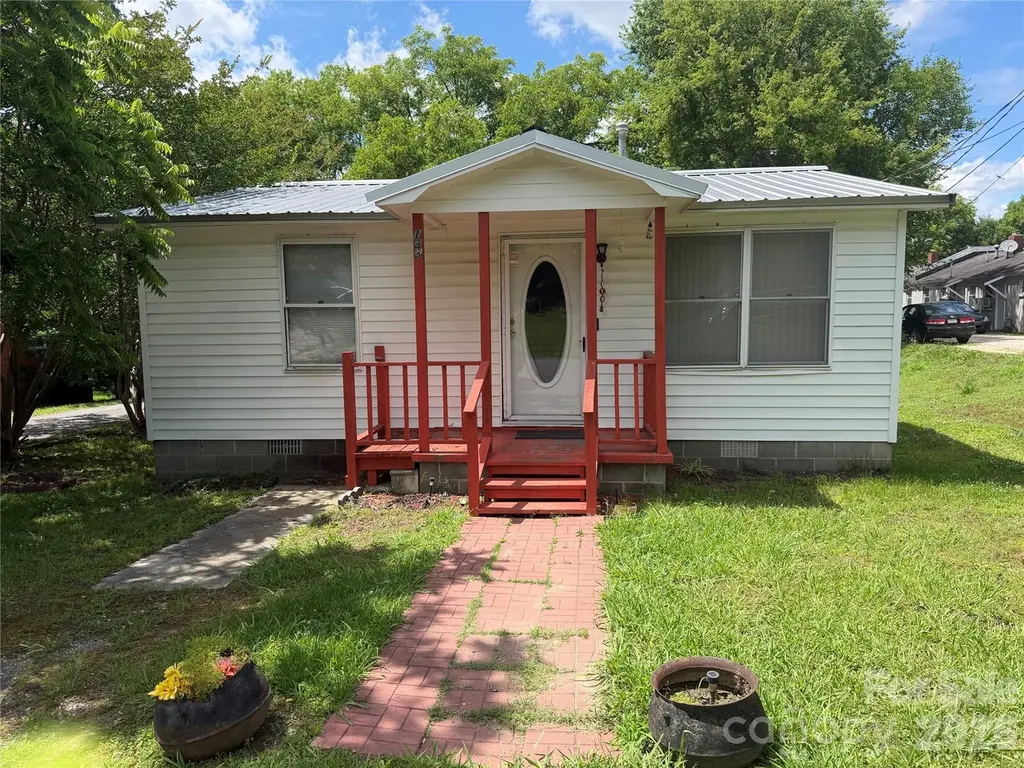
133 Mill St · Chester, SC
Flood risk 1/10 · Minimal
- FEMA flood zone
- X (unshaded)
- Chance of flooding over 30 yrs
- 0.0%
- Est. flood insurance / yr
- $507 – $1,088
Fire risk 4/10 · Minor
- Est. fire insurance / yr
- $783 – $1,453
Heat risk 6/10 · Moderate
- Hot days now (above 106°F)
- 7 days/yr
- Hot days in 30 yrs
- 16 days/yr
Wind risk 6/10 · Moderate
- Chance of severe wind over 30 yrs
- 27.0%
Air-quality risk 3/10 · Minor
- Unhealthy air days now
- 2 days/yr
- Unhealthy air days in 30 yrs
- 2 days/yr
Risk factors via First Street. Map © Google.
Why this score? — see what drove the B- grade
The composite is a weighted blend of 9 inputs, each scored 0–100. Each bar is that input's sub-score; the figure is the points it added to the 100-point composite (weight × sub-score).
- Cash flow +30.0/30.0
- 1% rule +10.0/10.0
- DSCR +10.0/10.0
- ARV discount +7.5/15.0
- Livability +2.6/5.0
- Rent growth +2.5/5.0
- Condition / age +2.5/5.0
- Schools +2.3/10.0
- Appreciation +0.0/10.0
$50,000
🖨 Deal sheet 📄 Offer letter ✓ Due diligence
Listing remarks
Investment opportunity in Chester! This 2-bedroom, 1-bath home offers 672 square feet of living space and features a recently installed metal roof. With a functional floor plan and plenty of potential, this property is ideal for an investor, rental property owner, or buyer looking for an affordable renovation project. The home offers an opportunity to add value through updates and improvements. The kitchen is dated, and the HVAC system and water heater are not currently functioning. During a recent inspection of the property, soft spots were observed in multiple areas of the flooring. Buyers are encouraged to conduct their own inspections and evaluations to determine the condition of the pr
Key facts
- Metal roof
- Functional layout
- Great foundation
Tags
Property features AI
Finance
- HOA & community: No HOA
Exterior
- Parking: Driveway (no main-level garage)
- Utilities: City water; Public sewer
- Home design: Single-family residence, site-built; One story; R-2 (Rural) zoning
- Construction: Vinyl exterior; Metal roof; Crawl space foundation; Built on site
- Exterior features: Side porch
Interior
- Kitchen: Electric cooktop; Microwave; Refrigerator
- Bedrooms: 2 bedrooms on the main level
- Bathrooms: 1 full bathroom
- Heating & cooling: Central heating; Central air conditioning
- Interior features: Attic access/space
- Laundry & utility: No laundry room (none specified)
Neighborhood map
What this means for you Summary
Snapshot
- This is a 2-bed/1.0-bath other listed at $50k.
Deal economics
- At list price, monthly cash flow is $274 ($3k/yr) — positive.
- The deal already cash-flows at list — no discount required.
- Meets the 1% rule at list price ($859 rent vs $50k).
- Recommended offer: $49k (1.5% below list) — sets the bar for market timing.
- Cap rate 12.9% vs local median 2.7% in Chester — top-decile yield for the area; either an underpriced asset or a hidden risk that comps aren't pricing in. Stress-test before assuming the spread holds.
Location & tenants
- Location reads 52/100 on livability (#344 in SC) — a working-class tenant base; expect higher turnover. Strengths: cost of living A+, housing B; Watch: schools F, crime F, amenities F.
- Chester 01 (rural): math 23% / reading 34% proficiency, ranked #59 of 80 in SC (top 74%) — low school quality limits family demand, transient renter base, plan for 1-2y turnover; 64% free/reduced lunch — lower-income household profile, screen leases tightly.
- Market conditions: 191 active listings in the ZIP; 4 comparable units currently listed for rent nearby; rentals leasing fast (median 2d on market — plan ~1-2 weeks tenant-placement turnaround); 269 units permitted in Chester County in 2024 (0 in 5+ unit buildings).
Forward outlook
- Local home prices are declining (-3.0%/yr); year-one equity from $346 of loan paydown is wiped out by about $2k of value loss. Plan a longer hold.
- Chester County population projected at -24% by 2050 — secular population decline; favor cash flow + early exit over multi-decade hold.
- At projected returns (-3.0% appreciation + 3.0% rent growth), your $14k cash investment doubles in ~6 years — after that, you're playing with house money.
Negotiation context
- It's been on market 17 days — a 2% lower offer ($49k) is reasonable based on typical stale-listing flexibility.
Risks & watch-outs
- Watch-outs: property tax is 2.9% of price.
- Climate carrying-cost: major wind risk, 27% chance of damaging wind over 30y; extreme-heat days projected 7→16/yr by 2055 (HVAC capex compounding) — expect insurance premiums to compound above CPI over the hold.
Questions for the listing agent
- Property tax is high relative to price — has the assessment been appealed recently, and will the sale trigger a re-assessment?
- Is there a deadline driving the sale (1031 exchange, divorce, estate, relocation)? That informs how much negotiation room exists.
- Schools are F-rated, which usually means shorter tenancies and higher turnover. Who's the typical renter profile here, and what's been the actual vacancy rate?
- Crime grade is F in this area — have there been break-ins, vandalism, or insurance claims at this property in the last 3 years? What carrier currently insures it and at what premium?
- What's the average days-on-market for RENTAL listings here right now (not sales)? A rising rental-DOM trend means longer vacancies and softer asking-rent achievability than the comps imply.
- What's the recent tenant-quality profile in this submarket — average credit score on applications, eviction rate, late-payment / NSF rate, and stable-employment percentage? A property-management company in the area should have these aggregated.
- How much new for-sale + rental construction is in the pipeline within 1–3 miles? Heavy new supply typically softens prices + rents 12–24 months out; constrained supply supports both.
Investment metrics
- 1% rule
- 1.72% ✓
- Cap rate
- 12.87%
- Cash-on-cash
- 23.48%
- DSCR
- 2.04
- GRM
- 4.8
CMA / ARV
No comps found within radius.
Projected returns pro-forma
-3.0% appreciation · 3.0% rent growth · sell at horizon
- IRR
- 16.6%
- Equity multiple
- 1.67×
- Total profit
- $9,398
- Equity at exit
- $7,455
- IRR
- 25.2%
- Equity multiple
- 3.20×
- Total profit
- $30,854
- Equity at exit
- $4,323
Cash invested: $14,000 (down + closing). Projections, not guarantees.
Landlord ↔ Tenant lean methodology
- Overall (STATE)
- 90 Strongly Landlord-Friendly
- State South Carolina
- 90 Strongly Landlord-Friendly · R+6
- County
- — inherits STATE
- City
- — inherits STATE
ZIP-level market 29706
- Home prices YoY
- -11.9%
- Active inventory
- 191
- Price-to-rent
- 4.8×
Monthly cashflow live
- Estimated rent
- $859 medium interval (Pro) →
- Mortgage (P&I)
- −$262
- Tax from tax record
- −$122 /mo · $1,460/yr
- Insurance
- −$21
- HOA
- −$0
- Vacancy / Maint / Mgmt
- −$180
- Net cashflow
- $274
Break-even live
UW: 25.0% down · 7.5% · 30yr · 1.5% tax · 5.0% vac · 8.0% maint · 8.0% mgmt
Financing live
Cash to close
- Down payment
- $12,500
- Closing costs
- $1,500
- Reserves months
- —
- Total cash needed
- —
Loan-product check · same deal, 3 products live
Conventional
25% down · 7.5% · 30yr
- Down + closing
- —
- Monthly P&I
- —
- Monthly cashflow
- —
- DSCR
- —
- Eligible?
- —
Personal DTI + credit; lowest rate.
DSCR
20% down · 8.5% · 30yr
- Down + closing
- —
- Monthly P&I
- —
- Monthly cashflow
- —
- DSCR
- —
- Eligible?
- —
No personal income docs; deal must DSCR.
Hard money
10% down · 12.0% · 12mo
- Down + closing
- —
- Monthly P&I
- —
- Monthly cashflow
- —
- DSCR
- —
- Eligible?
- —
Short-term bridge; refi at stabilization.
Rent comps 4 comps
| Address | Beds | Baths | Sqft | Rent | $/sqft | DOM | Units | Dist |
|---|---|---|---|---|---|---|---|---|
| 113 Mill St Chester, SC | 2.0 | 1.0 | 700 | $850 | $1.21 | 1d | 3 | 0.08mi |
| 120 Main St Chester, SC | 1.0–2.0 | 1.0 | 800 | $953 | $1.19 | 1d | 6 | 0.42mi |
| 110 Dye St Chester, SC | 1.0 | 1.0 | 600 | $850 | $1.42 | 2d | 1 | 0.97mi |
| 200 York St Chester, SC | 2.0 | 1.0 | 750 | $750 | $1.00 | 1d | 3 | 1.10mi |
Listing history 12 events
-
2026-06-18days on market $50,000 Active 17 DOM
-
2026-06-17days on market $50,000 Active 16 DOM
-
2026-06-16days on market $50,000 Active 15 DOM
-
2026-06-15days on market $50,000 Active 14 DOM
-
2026-06-13days on market $50,000 Active 12 DOM
-
2026-06-09days on market $50,000 Active 8 DOM
-
2026-06-08days on market $50,000 Active 7 DOM
-
2026-06-07days on market $50,000 Active 6 DOM
-
2026-06-04days on market $50,000 Active 3 DOM
-
2026-06-03days on market $50,000 Active 2 DOM
-
2026-06-01remarks 699-char remark
-
2026-06-01$50,000 Active 1 DOM
ⓘ Source: listings_history table (triggers on properties + properties_extension) + one-shot
backfill from property_details.listing_events for pre-trigger history.
Tax reassessment forecast SC · Resets to sale price
- Current annual tax
- $1,460 · $122/mo
- Projected year-2 tax
- $1,460 · $122/mo
- Expected delta
- $0/yr ($0/mo · 0.0%)
ⓘ Screening estimate from a state-policy table — verify with the county assessor before closing.
Climate risk First Street
- Flood 1/10 Low FEMA zone X (unshaded) · 0% chance over 30 yrs
- Wildfire 4/10 Moderate
- Heat 6/10 Major 7 d/yr ≥106°F today · 16 d/yr by 30 yrs out
- Wind 6/10 Major 27% chance of damaging wind over 30 yrs
- Air quality 3/10 Moderate 2 unhealthy d/yr today · 2 by 30 yrs out
Nearby sold comps map
Loading sold comps map…
Walkable amenities ~0.75 mi
Loading nearby amenities…
Taxation est. · year 1
- Rental income
- $10,310
- − Mortgage interest
- −$2,801
- − Property taxes
- −$1,460
- − Insurance
- −$250
- − Repairs & maintenance
- −$825
- − Management
- −$825
- − Depreciation
- −$1,455
- Taxable income
- $2,695
- Est. tax owed @ 24.0%
- −$647
- After-tax cash flow
- $2,641/yr
For passive investors: Depreciation is non-cash, so a rental often shows a tax loss while cash-flowing — sheltering income. Rental losses are passive: they offset passive income freely, and up to $25,000/yr can offset ordinary (W-2) income if you actively participate and your MAGI is under $100k (phasing out to $0 by $150k); unused losses carry forward. On sale, claimed depreciation is recaptured at up to 25%, and gains may owe capital-gains tax (a 1031 exchange can defer both). Figures are a year-1 estimate at your 24.0% rate — not tax advice; consult a CPA.
Schools (NCES district)
- District
- Chester 01
- NCES district ID
- 4501530
- Math proficiency
- 23% ▼ -6.00%
- Reading proficiency
- 34% ▬ 0.00%
- Median HH income
- $34,041
- Composite
- 23.39/100
- National rank
- #7902
- State rank
- #59 of 80 in SC
Livability — Chester
- Score
- 52/100
- State rank
- #344
- US rank
- #24754
Category grades
Schools grade is shown separately in the Schools card above.
Census & demographics
- Census place
- Chester, SC
- Population (ZIP)
- 19,181
Population outlook (Chester County) Hauer SSP2
- Today (2025)
- 30,121 people
- By 2030
- 28,700 · -4.7%
- By 2040
- 25,784 · -14.4%
- By 2050
- 23,001 · -23.6%
- By 2075
- 17,770 · -41.0%
- By 2100
- 13,584 · -54.9%
Race, ethnicity, and origin ACS 2023
- Neighborhood character
- Majority White (53%)
- Race & ethnicity
- White 53% Black 41% Hispanic / Latino 3% Two or more races 3%
- Common ancestry
- Serbian 4% Slovak 1% Romanian 1%
- Foreign-born
- 1% · Canada
- Languages at home
- 99% English-only · Spanish 1%
Political lean MEDSL · Chester
- 2024 margin
- R (+17.2) · D 40.8% · R 58.0% · Other 1.1%
- 2008→2024 swing
- -25.5pp toward R · 2008: 8.3pp · 2024: -17.2pp
- All cycles
- 2024: R+17.2 2020: R+10.9 2016: R+4.8 2012: D+10.5 2008: D+8.3
Not yet ingested
- Civics
- —
Market trends
- HPI YoY
- ▼ -35.18%
- Current HPI
- 259.4461
- Rent YoY
- —
- Metro
- —
- State GDP YoY
- ▲ 4.51%
- F500 in state
- 2
Industry mix (Fortune 500 HQ in SC)
| Industry | F500 HQs | Revenue |
|---|---|---|
| Packaging | 1 | $7B |
|
||
Price history
1 event — show timeline
- 2026-06-01 Listed $50,000 CANOPYMLS as Distributed by MLS Grid
Property tax history
+5.6%/yrLatest (2025): $1,460 · +6.4% YoY. Source: county tax records.
Cash-flow waterfall
monthlySold comps — $/sqft
last 12 mo · ≤1 miLoading sold comps…