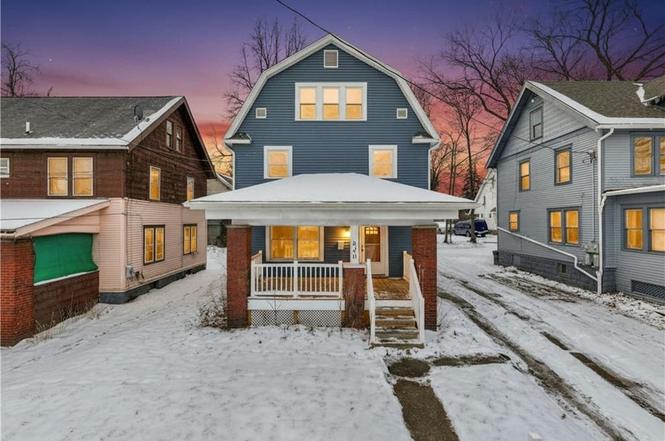
840 E Buchtel Ave · Akron, OH
Flood risk 1/10 · Minimal
- FEMA flood zone
- X (unshaded)
- Chance of flooding over 30 yrs
- 0.0%
- Est. flood insurance / yr
- $473 – $860
Fire risk 1/10 · Minimal
- Est. fire insurance / yr
- $713 – $1,323
Heat risk 3/10 · Minor
- Hot days now (above 97°F)
- 7 days/yr
- Hot days in 30 yrs
- 17 days/yr
Wind risk 1/10 · Minimal
- Chance of severe wind over 30 yrs
- —
Air-quality risk 3/10 · Minor
- Unhealthy air days now
- 2 days/yr
- Unhealthy air days in 30 yrs
- 4 days/yr
Risk factors via First Street. Map © Google.
Why this score? — see what drove the C- grade
The composite is a weighted blend of 9 inputs, each scored 0–100. Each bar is that input's sub-score; the figure is the points it added to the 100-point composite (weight × sub-score).
- Cash flow +21.3/30.0
- ARV discount +7.5/15.0
- DSCR +6.8/10.0
- 1% rule +4.8/10.0
- Livability +4.0/5.0
- Rent growth +3.6/5.0
- Condition / age +2.5/5.0
- Schools +2.1/10.0
- Appreciation +0.0/10.0
$139,000
🖨 Deal sheet 📄 Offer letter ✓ Due diligence
Listing remarks
Welcome to your freshly updated turn-key home! All updates were professionally done and inspected, with all mechanicals by licensed experts! The list is too long to fit here: New Roof, Siding, and Windows outside, kitchen, bathrooms and all mechanicals updated inside in 2023. Fresh paint and carpet recently allow for you to move right in and get to enjoying the spacious front porch just in time for spring! Schedule your showing now as this will not be on the market long! Sale restricted to owner occupants at or less than 80% AMI. Please call listing agent with any questions!
Key facts
- Kitchen
- Bathrooms
- Spacious front porch
Tags
Neighborhood map
What this means for you Summary
Snapshot
- This is a 3-bed/2.0-bath single-family listed at $139k.
Deal economics
- At list price, monthly cash flow is $204 ($2k/yr) — positive.
- The deal already cash-flows at list — no discount required.
- To meet the 1% rule (rent ≥ 1% of price), the offer needs to be $136k (1.9% below list).
- Recommended offer: $135k (3.0% below list) — sets the bar for market timing.
- Cap rate 8.1% vs local median 6.6% in Akron — meaningfully above typical; check what's discounted (condition, days-on-market, listing class) to confirm the premium yield is real.
Location & tenants
- Location reads 81/100 on livability (#104 in OH, #1,591 nationally) — a professional / high-income tenant draw. Strengths: amenities A+, commute A+, cost of living A+; Watch: crime F, employment F.
- Akron City (urban): math 22% / reading 30% proficiency, ranked #602 of 656 in OH (top 92%) — low school quality limits family demand, transient renter base, plan for 1-2y turnover; 66% free/reduced lunch — lower-income household profile, screen leases tightly.
- Market conditions: Rents rising fast (+4.5%/yr); 101 active listings in the ZIP; 40 comparable units currently listed for rent nearby; rentals lingering (median 44d on market — plan ~5-8 weeks vacancy on turnover, expect pricing pressure); 50% of comp listings sitting > 30 days — soft ceiling on asking rent; 1,114 units permitted in Summit County in 2024 (397 in 5+ unit buildings).
- This rent runs 31% of the median local income ($53k/yr) — at the standard rent-burdened threshold; future hikes will face affordability resistance.
Forward outlook
- Local home prices are declining (-3.0%/yr); year-one equity from $961 of loan paydown is wiped out by about $4k of value loss. Plan a longer hold.
- Summit County population projected to shrink 6% by 2050 — rents likely to lag national; underwrite the cash flow, not the appreciation.
Negotiation context
- It's been on market 53 days — a 3% lower offer ($135k) is reasonable based on typical stale-listing flexibility.
- 2 sale attempts since 23y ago with the ask held roughly flat each time — persistent listings suggest the price (not the market) is what's stuck; bring a comps-based counter.
- Current owner paid $1k; list at $139k implies a 11483% gain — meaningful room to come down on a strong offer.
Risks & watch-outs
- Watch-outs: built in 1919 — expect roof / HVAC / electrical / plumbing capex.
Questions for the listing agent
- It's been on market 53 days. Have you received any prior offers? Is the seller open to a 3% concession, seller financing, or rate buy-down credit?
- Built in 1919 — when were the roof, HVAC, electrical panel, plumbing, and water heater last replaced?
- Is there a deadline driving the sale (1031 exchange, divorce, estate, relocation)? That informs how much negotiation room exists.
- Crime grade is F in this area — have there been break-ins, vandalism, or insurance claims at this property in the last 3 years? What carrier currently insures it and at what premium?
- What's the average days-on-market for RENTAL listings here right now (not sales)? A rising rental-DOM trend means longer vacancies and softer asking-rent achievability than the comps imply.
- What's the recent tenant-quality profile in this submarket — average credit score on applications, eviction rate, late-payment / NSF rate, and stable-employment percentage? A property-management company in the area should have these aggregated.
- How much new for-sale + rental construction is in the pipeline within 1–3 miles? Heavy new supply typically softens prices + rents 12–24 months out; constrained supply supports both.
Investment metrics
- 1% rule
- 0.98% ✗
- Cap rate
- 8.05%
- Cash-on-cash
- 6.29%
- DSCR
- 1.28
- GRM
- 8.5
CMA / ARV
- ARV (on-the-fly)
- $89,856
- Comps found
- 12
Show comp detail 12 sales within ~0.75 mi
| Address | Dist | Beds/Ba | Sqft | Sold | Price | $/sf | Match |
|---|---|---|---|---|---|---|---|
| 98 Shaker Dr | 0.10mi | 4/1.5 (+1) | 1,682 (-3%) | 10mo | $120,000 | $71 | 76 |
| 224 Allies St | 0.39mi | 3/1.0 | 1,637 (-5%) | 12mo | $76,500 | $47 | 59 |
| 198 N Arlington St | 0.10mi | 4/1.0 (+1) | 1,538 (-11%) | 15mo | $50,000 | $33 | 56 |
| 692 Roselawn Ave | 0.51mi | 4/1.0 (+1) | 1,673 (-3%) | 13mo | $82,000 | $49 | 52 |
| 788 Excelsior Ave | 0.37mi | 4/1.5 (+1) | 1,469 (-15%) | 1mo | $166,000 | $113 | 50 |
| 347 Cleveland St | 0.55mi | 3/1.5 | 1,607 (-7%) | 13mo | $84,000 | $52 | 50 |
| 1265 Newton St | 0.74mi | 4/1.5 (+1) | 1,641 (-5%) | 2mo | $80,000 | $49 | 48 |
| 48 Franklin St | 0.57mi | 3/2.0 | 1,502 (-13%) | 8mo | $80,000 | $53 | 45 |
| 851 Forrest Dr | 0.43mi | 4/2.0 (+1) | 1,520 (-12%) | 13mo | $72,450 | $48 | 45 |
| 1147 Newton St | 0.53mi | 3/2.0 | 1,932 (+12%) | 17mo | $84,000 | $43 | 42 |
| 333 Eastland Ave | 0.64mi | 3/1.5 | 1,482 (-14%) | 7mo | $147,000 | $99 | 38 |
| 1250 Honodle Ave | 0.72mi | 3/2.0 | 1,473 (-15%) | 14mo | $200,000 | $136 | 30 |
Match score weights: distance 35% · size 25% · config 20% · recency 20%. Top-matched comps best support the ARV.
Projected returns pro-forma
-3.0% appreciation · 4.51% rent growth · sell at horizon
- IRR
- -5.1%
- Equity multiple
- 0.81×
- Total profit
- $-7,465
- Equity at exit
- $20,725
- IRR
- 6.2%
- Equity multiple
- 1.49×
- Total profit
- $18,992
- Equity at exit
- $12,018
Cash invested: $38,920 (down + closing). Projections, not guarantees.
Landlord ↔ Tenant lean methodology
- Overall (STATE)
- 73 Landlord-Friendly
- State Ohio
- 73 Landlord-Friendly · R+6
- County
- — inherits STATE
- City
- — inherits STATE
ZIP-level market 44305
- Rents YoY
- 4.5%
- Active inventory
- 101
- Price-to-rent
- 8.5×
Monthly cashflow live
- Estimated rent
- $1,364 high interval (Pro) →
- Mortgage (P&I)
- −$729
- Tax from tax record
- −$87 /mo · $1,040/yr
- Insurance
- −$58
- HOA
- −$0
- Vacancy / Maint / Mgmt
- −$286
- Net cashflow
- $204
Break-even live
UW: 25.0% down · 7.5% · 30yr · 1.5% tax · 5.0% vac · 8.0% maint · 8.0% mgmt
Financing live
Cash to close
- Down payment
- $34,750
- Closing costs
- $4,170
- Reserves months
- —
- Total cash needed
- —
Loan-product check · same deal, 3 products live
Conventional
25% down · 7.5% · 30yr
- Down + closing
- —
- Monthly P&I
- —
- Monthly cashflow
- —
- DSCR
- —
- Eligible?
- —
Personal DTI + credit; lowest rate.
DSCR
20% down · 8.5% · 30yr
- Down + closing
- —
- Monthly P&I
- —
- Monthly cashflow
- —
- DSCR
- —
- Eligible?
- —
No personal income docs; deal must DSCR.
Hard money
10% down · 12.0% · 12mo
- Down + closing
- —
- Monthly P&I
- —
- Monthly cashflow
- —
- DSCR
- —
- Eligible?
- —
Short-term bridge; refi at stabilization.
Rent comps 40 comps
| Address | Beds | Baths | Sqft | Rent | $/sqft | DOM | Units | Dist |
|---|---|---|---|---|---|---|---|---|
| 846 Lee Dr Akron, OH | 4.0 | 1.5 | 1433 | $1,325 | $0.92 | 23d | 1 | 0.00mi |
| 846 Lee Dr Akron, OH | 4.0 | 1.0 | 1433 | $1,325 | $0.92 | 14d | 1 | 0.00mi |
| 797 E Market St Apt 220 Akron, OH | 2.0 | 1.5 | 1100 | $1,500 | $1.36 | 23d | 1 | 0.13mi |
| 77 Kent Ct Akron, OH | 4.0 | 1.0 | 1300 | $1,200 | $0.92 | 43d | 1 | 0.28mi |
| 208 Denver St Akron, OH | 3.0 | 1.0 | 1248 | $895 | $0.72 | 43d | 1 | 0.40mi |
| 1147 Newton St Akron, OH | 3.0 | 2.0 | 1932 | $1,250 | $0.65 | 21d | 1 | 0.51mi |
| 1113 Smithfarm Ave Akron, OH | 3.0 | 2.0 | 1296 | $1,600 | $1.23 | 23d | 1 | 0.54mi |
| 987 Boone St Akron, OH | 3.0 | 1.0 | 1248 | $1,100 | $0.88 | 23d | 1 | 0.55mi |
| 1071 Ackley St Akron, OH | 4.0 | 2.0 | 1164 | $1,175 | $1.01 | 43d | 1 | 0.64mi |
| 1076 Ackley St Akron, OH | 4.0 | 2.0 | 1998 | $2,000 | $1.00 | 14d | 1 | 0.66mi |
| 240 Arch St Akron, OH | 3.0 | 1.0 | 1182 | $1,375 | $1.16 | 43d | 1 | 0.76mi |
| 1190 Hazel St Akron, OH | 3.0 | 1.0 | 1124 | $1,425 | $1.27 | 43d | 1 | 0.76mi |
| 248 Arch St Akron, OH | 3.0 | 1.0 | 1210 | $1,300 | $1.07 | 43d | 1 | 0.77mi |
| 1125 2nd Ave Akron, OH | 3.0 | 1.0 | 1373 | $1,100 | $0.80 | 23d | 1 | 0.83mi |
| 435 Margaret St Akron, OH | 4.0 | 2.0 | 1900 | $1,450 | $0.76 | 43d | 1 | 0.83mi |
| 288 Kryder Ave Akron, OH | 4.0 | 1.0 | 1400 | $1,450 | $1.04 | 43d | 1 | 0.84mi |
| 1297 Pondview Ave Akron, OH | 4.0 | 1.0 | 1373 | $1,450 | $1.06 | 23d | 1 | 0.93mi |
| 1318 Arnold Ave Akron, OH | 3.0 | 1.0 | 1056 | $1,450 | $1.37 | 43d | 1 | 0.94mi |
| 377 Talbot Ave Akron, OH | 2.0 | 1.0 | 1070 | $1,050 | $0.98 | 43d | 1 | 0.97mi |
| 490 Gage St Akron, OH | 4.0 | 1.0 | 1326 | $1,053 | $0.79 | 43d | 1 | 0.97mi |
| 455 Spicer St Akron, OH | 2.0 | 1.0 | 1872 | $975 | $0.52 | 14d | 1 | 0.99mi |
| 1395 Goodyear Blvd Akron, OH | 3.0 | 1.5 | 1542 | $1,450 | $0.94 | 43d | 1 | 1.03mi |
| 578 Plum St Akron, OH | 3.0 | 1.0 | 1920 | $1,250 | $0.65 | 23d | 1 | 1.03mi |
| 589 Eastland Ave Akron, OH | 3.0 | 1.5 | 1345 | $1,300 | $0.97 | 43d | 1 | 1.03mi |
| 1182 5th Ave Akron, OH | 3.0 | 1.0 | 1248 | $1,250 | $1.00 | 14d | 1 | 1.03mi |
| 1438 Newton St Akron, OH | 4.0 | 1.0 | 1429 | $1,375 | $0.96 | 23d | 1 | 1.05mi |
| 548 Spicer St Akron, OH | 4.0 | 2.0 | 1487 | $1,100 | $0.74 | 23d | 1 | 1.14mi |
| 287 Wheeler St Akron, OH | 3.0 | 1.0 | 1100 | $1,350 | $1.23 | 23d | 1 | 1.17mi |
| 1428 Sara Ave Akron, OH | 2.0 | 1.0 | 1080 | $1,050 | $0.97 | 14d | 1 | 1.17mi |
| 488 Alexander St Akron, OH | 4.0 | 2.0 | 1311 | $1,350 | $1.03 | 23d | 1 | 1.18mi |
| 356 Rankin St Akron, OH | 4.0 | 1.5 | 1186 | $1,197 | $1.01 | 23d | 1 | 1.19mi |
| 497 Lucy St Akron, OH | 4.0 | 1.0 | 1600 | $1,500 | $0.94 | 43d | 1 | 1.21mi |
| 516 Whitney Ave Akron, OH | 4.0 | 2.0 | 1676 | $1,500 | $0.89 | 43d | 1 | 1.23mi |
| 990 Baird St Akron, OH | 3.0 | 1.0 | 1140 | $1,250 | $1.10 | 43d | 1 | 1.26mi |
| 406 Sumner St Akron, OH | 2.0–4.0 | 1.0–2.0 | 836 | $1,085 | $1.30 | 14d | 3 | 1.27mi |
| 1598 Pilgrim St Akron, OH | 3.0 | 1.0 | 1352 | $1,550 | $1.15 | 43d | 1 | 1.35mi |
| 1280 7th Ave Akron, OH | 2.0 | 1.0 | 1152 | $1,200 | $1.04 | 14d | 1 | 1.37mi |
| 566 Sumner St Akron, OH | 4.0 | 1.0 | 1170 | $1,200 | $1.03 | 43d | 1 | 1.37mi |
| 288 Cross St Akron, OH | 4.0 | 2.0 | 1512 | $1,295 | $0.86 | 43d | 1 | 1.43mi |
| 796 Brown St Akron, OH | 4.0 | 2.0 | 1200 | $900 | $0.75 | 43d | 1 | 1.48mi |
Listing history 5 events
-
2026-04-21status Pending
-
2026-02-27$139,000 Active
-
2003-10-21historical
-
2003-03-21$41,900
-
1985-07-03soldstatus $1,200
ⓘ Source: listings_history table (triggers on properties + properties_extension) + one-shot
backfill from property_details.listing_events for pre-trigger history.
Tax reassessment forecast OH · Partial reset (capped growth)
- Current annual tax
- $1,040 · $87/mo
- Projected year-2 tax
- $1,604 · $134/mo
- Expected delta
- +$564/yr (+$47/mo · 54.3%)
ⓘ Screening estimate from a state-policy table — verify with the county assessor before closing.
Climate risk First Street
- Flood 1/10 Low FEMA zone X (unshaded) · 0% chance over 30 yrs
- Wildfire 1/10 Low
- Heat 3/10 Moderate 7 d/yr ≥97°F today · 17 d/yr by 30 yrs out
- Wind 1/10 Low
- Air quality 3/10 Moderate 2 unhealthy d/yr today · 4 by 30 yrs out
Nearby sold comps map
Loading sold comps map…
Walkable amenities ~0.75 mi
Loading nearby amenities…
Taxation est. · year 1
- Rental income
- $16,366
- − Mortgage interest
- −$7,786
- − Property taxes
- −$1,040
- − Insurance
- −$695
- − Repairs & maintenance
- −$1,309
- − Management
- −$1,309
- − Depreciation
- −$4,044
- Taxable income
- $183
- Est. tax owed @ 24.0%
- −$44
- After-tax cash flow
- $2,403/yr
For passive investors: Depreciation is non-cash, so a rental often shows a tax loss while cash-flowing — sheltering income. Rental losses are passive: they offset passive income freely, and up to $25,000/yr can offset ordinary (W-2) income if you actively participate and your MAGI is under $100k (phasing out to $0 by $150k); unused losses carry forward. On sale, claimed depreciation is recaptured at up to 25%, and gains may owe capital-gains tax (a 1031 exchange can defer both). Figures are a year-1 estimate at your 24.0% rate — not tax advice; consult a CPA.
Schools (NCES district)
- District
- Akron City
- NCES district ID
- 3904348
- Math proficiency
- 22% ▼ -17.00%
- Reading proficiency
- 30% ▼ -12.00%
- Median HH income
- $33,811
- Composite
- 21.31/100
- National rank
- #8383
- State rank
- #602 of 656 in OH
Livability — Akron
- Score
- 81/100
- State rank
- #104
- US rank
- #1591
Category grades
Schools grade is shown separately in the Schools card above.
Census & demographics
- Census place
- Akron, OH
- County
- Summit County · 440,783 people
- City population
- 174,375
- Metro
- Akron, OH
- Population (ZIP)
- 21,103
- Household income
- $52,768
- Rent vs Own
- Severe rent burden
- 1021.0
Population outlook (Summit County) Hauer SSP2
- Today (2025)
- 546,583 people
- By 2030
- 544,028 · -0.5%
- By 2040
- 531,363 · -2.8%
- By 2050
- 514,923 · -5.8%
- By 2075
- 481,765 · -11.9%
- By 2100
- 432,265 · -20.9%
Race, ethnicity, and origin ACS 2023
- Neighborhood character
- Diverse neighborhood (Simpson 0.57)
- Race & ethnicity
- White 62% Black 20% Two or more races 12% Asian 5% Hispanic / Latino 2%
- Common ancestry
- Lithuanian 3% Slovak 2% Romanian 2%
- Foreign-born
- 4% · India, Philippines, Canada
- Languages at home
- 94% English-only · Other Asian/Pacific 3% Other Indo-European 1% Spanish 1%
Political lean MEDSL · Summit
- 2024 margin
- Lean D (+7.0) · D 53.0% · R 46.0%
- 2008→2024 swing
- -9.6pp toward R · 2008: 16.6pp · 2024: 7.0pp
- All cycles
- 2024: D+7.0 2020: D+9.6 2016: D+8.2 2012: D+14.8 2008: D+16.6
Not yet ingested
- Civics
- —
Market trends
- HPI YoY
- ▼ -140.39%
- Current HPI
- 190.6223
- Rent YoY
- ▲ 4.51%
- Metro
- Akron, OH
- State GDP YoY
- ▲ 1.98%
- F500 in state
- 48
Industry mix (Fortune 500 HQ in OH)
| Industry | F500 HQs | Revenue |
|---|---|---|
| Insurance | 3 | $145B |
|
||
| Industrial Machinery | 3 | $49B |
|
||
| Financial Services | 3 | $24B |
|
||
| Consumer Goods | 2 | $93B |
|
||
| Aerospace / Defense | 2 | $47B |
|
||
| Utilities | 2 | $33B |
|
||
Price history
+11483.3% since first listed5 events — show timeline
- 2026-04-21 Pending — MLSNOW
- 2026-02-27 Listed $139,000 MLSNOW
- 2003-10-21 Listing Removed — MLSNOW
- 2003-03-21 Listed $41,900 MLSNOW
- 1985-07-03 Sold (Public Records) $1,200 Public Records
Property tax history
+0.0%/yrLatest (2025): $1,040 · -23.6% YoY. Source: county tax records.
Cash-flow waterfall
monthlySold comps — $/sqft
last 12 mo · ≤1 miLoading sold comps…