9 Palmira Rd · DeBary, FL
Flood risk 1/10 · Minimal
- FEMA flood zone
- X (unshaded)
- Chance of flooding over 30 yrs
- 0.0%
- Est. flood insurance / yr
- $507 – $1,088
Fire risk 4/10 · Minor
- Est. fire insurance / yr
- $947 – $1,759
Heat risk 8/10 · Major
- Hot days now (above 108°F)
- 7 days/yr
- Hot days in 30 yrs
- 21 days/yr
Wind risk 9/10 · Severe
- Chance of severe wind over 30 yrs
- 99.0%
Air-quality risk 2/10 · Minimal
- Unhealthy air days now
- 1 days/yr
- Unhealthy air days in 30 yrs
- 1 days/yr
Risk factors via First Street. Map © Google.
Why this score? — see what drove the F grade
The composite is a weighted blend of 9 inputs, each scored 0–100. Each bar is that input's sub-score; the figure is the points it added to the 100-point composite (weight × sub-score).
- Cash flow +8.1/30.0
- ARV discount +7.5/15.0
- Schools +3.9/10.0
- Livability +3.7/5.0
- Rent growth +3.0/5.0
- Condition / age +2.5/5.0
- 1% rule +2.4/10.0
- DSCR +2.1/10.0
- Appreciation +0.0/10.0
$249,000
🖨 Deal sheet 📄 Offer letter ✓ Due diligence
Listing remarks
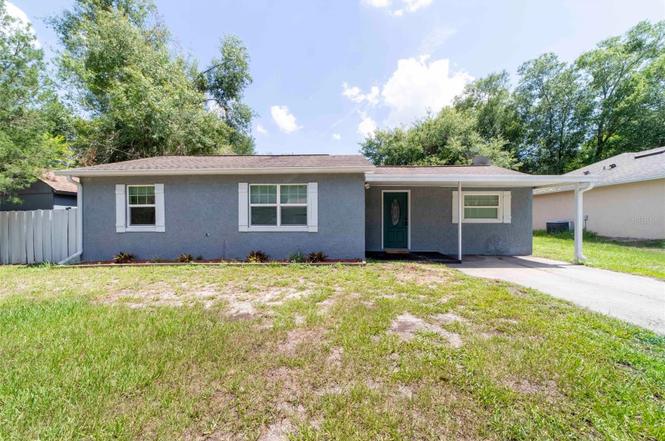
Virtually Staged. Welcome home to 9 Palmira Road, a stunningly updated oasis in the heart of DeBary, Florida. This move-in-ready property offers 2 bedrooms, 2 bathrooms, and a versatile den perfect for a home office, gym, or hobby room. Step inside to discover a bright, modern interior featuring fresh paint (2026) that beautifully highlights the home's recent 2023 remodel. Enjoy ultimate peace of mind with a long list of premium capital upgrades completed in 2023, including a brand-new AC system, complete home repiping, and a state-of-the-art water filtration system. The spacious layout flows seamlessly into the ultimate outdoor retreat—a large, fully fenced backyard offering endless
Key facts
- Brand-new ac system
- Versatile den
- 0.26 acre lot
Tags
Property features AI
Finance
- Other: Property type: Residential, single family; Zoning: R-3; Unfurnished
- Financial info: Lease restrictions apply
- HOA & community: No association; Development: Plantation Estates
Exterior
- Utilities: Private well water source; Septic tank sewer; Cable available
- Home design: Single-family residence; One story; Faces north
- Construction: Stucco exterior; Shingle roof; Block foundation; Built on a lot of about 0.26 acres
- Exterior features: Asphalt road access; Lot dimensions approximately 75 x 150
Interior
- Kitchen: Dishwasher; Microwave; Range; Refrigerator
- Bedrooms: 3 bedrooms
- Bathrooms: 1 full bathroom; 1 half bathroom
- Heating & cooling: Central heating; Central air conditioning
- Interior features: Ceiling fans; Open living room/dining room layout; Blinds and shutters
- Laundry & utility: Washer hookup
Neighborhood map
What this means for you Summary
Snapshot
- This is a 2-bed/2.0-bath single-family listed at $249k.
Deal economics
- At list price, monthly cash flow is $-245 ($-3k/yr) — negative.
- To cash-flow at today's rent, offer at most $206k (17.4% below list).
- To meet the 1% rule (rent ≥ 1% of price), the offer needs to be $184k (26.0% below list).
- Recommended offer: $184k (26.0% below list) — sets the bar for 1% rule.
- Cap rate 5.1% vs local median 3.8% in DeBary — top-decile yield for the area; either an underpriced asset or a hidden risk that comps aren't pricing in. Stress-test before assuming the spread holds.
Location & tenants
- Location reads 73/100 on livability (#312 in FL) — a middle-class / working-renter tenant base. Strengths: employment A+, housing A+, crime A-; Watch: amenities F, commute F, health & safety D-.
- Volusia (suburban): math 44% / reading 49% proficiency, ranked #47 of 73 in FL (top 64%) — families likely to look elsewhere, expect single-tenant / working-renter base with shorter leases.
- Zoned schools: Enterprise Elementary School (math 47% / reading 42%, grade F, #1,288 of 2,144 statewide, top 62%, 588 students, 66% FRL); University High School (math 28% / reading 46%, grade F, #340 of 667 statewide, top 52%, 2,901 students, 49% FRL).
- Market conditions: Rents rising (+1.9%/yr); 273 active listings in the ZIP; 1 comparable units currently listed for rent nearby; solid renter incomes; 3,402 units permitted in Volusia County in 2024 (681 in 5+ unit buildings).
Forward outlook
- Local home prices are declining (-3.0%/yr); year-one equity from $2k of loan paydown is wiped out by about $7k of value loss. Plan a longer hold.
- Volusia County population projected at +19% by 2050 — long-run rental-demand tailwind backs the buy-and-hold thesis.
Negotiation context
- Only 1 days on market — expect competitive offers; lowballing is unlikely to land.
- 2 sale attempts since 16y ago with the ask held roughly flat each time — persistent listings suggest the price (not the market) is what's stuck; bring a comps-based counter.
- Current owner paid $132k; list at $249k implies a 88% gain — meaningful room to come down on a strong offer.
Risks & watch-outs
- Watch-outs: built in 1951 — expect roof / HVAC / electrical / plumbing capex.
- Climate carrying-cost: severe wind risk, 99% chance of damaging wind over 30y; extreme-heat days projected 7→21/yr by 2055 (HVAC capex compounding) — expect insurance premiums to compound above CPI over the hold.
Questions for the listing agent
- What do current leases actually rent for vs. the listed asking? Can we see a recent rent roll and the last 12 months of T-12 income?
- Built in 1951 — when were the roof, HVAC, electrical panel, plumbing, and water heater last replaced?
- Is there a deadline driving the sale (1031 exchange, divorce, estate, relocation)? That informs how much negotiation room exists.
- Schools are B-rated — typically a magnet for longer-tenancy family renters. What's the average tenant stay here, and is there a school-zone premium baked into asking?
- The area grade is low — what's the realistic commute time and amenity access for the typical tenant pool here? Any planned neighborhood developments (good or bad) we should know about?
- What's the average days-on-market for RENTAL listings here right now (not sales)? A rising rental-DOM trend means longer vacancies and softer asking-rent achievability than the comps imply.
- What's the recent tenant-quality profile in this submarket — average credit score on applications, eviction rate, late-payment / NSF rate, and stable-employment percentage? A property-management company in the area should have these aggregated.
- How much new for-sale + rental construction is in the pipeline within 1–3 miles? Heavy new supply typically softens prices + rents 12–24 months out; constrained supply supports both.
Investment metrics
- 1% rule
- 0.74% ✗
- Cap rate
- 5.11%
- Cash-on-cash
- -4.22%
- DSCR
- 0.81
- GRM
- 11.3
CMA / ARV
No comps found within radius.
Projected returns pro-forma
-3.0% appreciation · 1.89% rent growth · sell at horizon
- IRR
- -24.6%
- Equity multiple
- 0.17×
- Total profit
- $-57,996
- Equity at exit
- $37,127
- IRR
- -23.8%
- Equity multiple
- -0.13×
- Total profit
- $-78,727
- Equity at exit
- $21,529
Cash invested: $69,720 (down + closing). Projections, not guarantees.
Landlord ↔ Tenant lean methodology
- Overall (STATE)
- 87 Strongly Landlord-Friendly
- State Florida
- 87 Strongly Landlord-Friendly · R+3
- County
- — inherits STATE
- City
- — inherits STATE
ZIP-level market 32713
- Rents YoY
- 1.9%
- Active inventory
- 273
- Price-to-rent
- 11.3×
Monthly cashflow live
- Estimated rent
- $1,842 medium interval (Pro) →
- Mortgage (P&I)
- −$1,306
- Tax from tax record
- −$291 /mo · $3,488/yr
- Insurance
- −$104
- HOA
- −$0
- Vacancy / Maint / Mgmt
- −$387
- Net cashflow
- $-245
Break-even live
UW: 25.0% down · 7.5% · 30yr · 1.5% tax · 5.0% vac · 8.0% maint · 8.0% mgmt
Financing live
Cash to close
- Down payment
- $62,250
- Closing costs
- $7,470
- Reserves months
- —
- Total cash needed
- —
Loan-product check · same deal, 3 products live
Conventional
25% down · 7.5% · 30yr
- Down + closing
- —
- Monthly P&I
- —
- Monthly cashflow
- —
- DSCR
- —
- Eligible?
- —
Personal DTI + credit; lowest rate.
DSCR
20% down · 8.5% · 30yr
- Down + closing
- —
- Monthly P&I
- —
- Monthly cashflow
- —
- DSCR
- —
- Eligible?
- —
No personal income docs; deal must DSCR.
Hard money
10% down · 12.0% · 12mo
- Down + closing
- —
- Monthly P&I
- —
- Monthly cashflow
- —
- DSCR
- —
- Eligible?
- —
Short-term bridge; refi at stabilization.
Rent comps 1 comps
| Address | Beds | Baths | Sqft | Rent | $/sqft | DOM | Units | Dist |
|---|---|---|---|---|---|---|---|---|
| 127 Debary Dr Debary, FL | 3.0 | 2.0 | 1015 | $2,295 | $2.26 | 23d | 1 | 0.31mi |
Listing history 2 events
-
2026-06-19remarks 693-char remark
-
2026-06-19$249,000 Active 1 DOM
ⓘ Source: listings_history table (triggers on properties + properties_extension) + one-shot
backfill from property_details.listing_events for pre-trigger history.
Tax reassessment forecast FL · Resets to sale price
- Current annual tax
- $3,488 · $291/mo
- Projected year-2 tax
- $3,488 · $291/mo
- Expected delta
- $0/yr ($0/mo · 0.0%)
ⓘ Screening estimate from a state-policy table — verify with the county assessor before closing.
Climate risk First Street
- Flood 1/10 Low FEMA zone X (unshaded) · 0% chance over 30 yrs
- Wildfire 4/10 Moderate
- Heat 8/10 Severe 7 d/yr ≥108°F today · 21 d/yr by 30 yrs out
- Wind 9/10 Extreme 99% chance of damaging wind over 30 yrs
- Air quality 2/10 Low 1 unhealthy d/yr today · 1 by 30 yrs out
Nearby sold comps map
Loading sold comps map…
Walkable amenities ~0.75 mi
Loading nearby amenities…
Taxation est. · year 1
- Rental income
- $22,099
- − Mortgage interest
- −$13,948
- − Property taxes
- −$3,488
- − Insurance
- −$1,245
- − Repairs & maintenance
- −$1,768
- − Management
- −$1,768
- − Depreciation
- −$7,244
- Taxable loss
- −$7,362
- Est. tax savings @ 24.0%
- +$1,767
- After-tax cash flow
- $-1,178/yr
For passive investors: Depreciation is non-cash, so a rental often shows a tax loss while cash-flowing — sheltering income. Rental losses are passive: they offset passive income freely, and up to $25,000/yr can offset ordinary (W-2) income if you actively participate and your MAGI is under $100k (phasing out to $0 by $150k); unused losses carry forward. On sale, claimed depreciation is recaptured at up to 25%, and gains may owe capital-gains tax (a 1031 exchange can defer both). Figures are a year-1 estimate at your 24.0% rate — not tax advice; consult a CPA.
Schools (NCES district)
- District
- Volusia
- NCES district ID
- 1201920
- Math proficiency
- 44% ▼ -9.00%
- Reading proficiency
- 49% ▼ -3.00%
- Median HH income
- $42,946
- Composite
- 39.2/100
- National rank
- #4019
- State rank
- #47 of 73 in FL
Livability — DeBary
- Score
- 73/100
- State rank
- #312
- US rank
- #5314
Category grades
Schools grade is shown separately in the Schools card above.
Census & demographics
- Census place
- DeBary, FL
- County
- Volusia County · 556,871 people
- City population
- 22,884
- Metro
- Deltona-Daytona Beach-Ormond Beach, FL
- Population (ZIP)
- 22,884
- Household income
- $88,500
- Rent vs Own
- Severe rent burden
- 265.0
Population outlook (Volusia County) Hauer SSP2
- Today (2025)
- 572,749 people
- By 2030
- 598,695 · +4.5%
- By 2040
- 644,880 · +12.6%
- By 2050
- 681,451 · +19.0%
- By 2075
- 759,957 · +32.7%
- By 2100
- 778,902 · +36.0%
Race, ethnicity, and origin ACS 2023
- Neighborhood character
- Predominantly White (73%)
- Race & ethnicity
- White 73% Hispanic / Latino 17% Two or more races 6% Black 5% Asian 3%
- Hispanic origin (detail)
- Mexican 1% Puerto Rican 10% Cuban 1%
- Common ancestry
- Lithuanian 2% Romanian 2% Serbian 2%
- Foreign-born
- 8% · Canada, Vietnam, South Korea
- Languages at home
- 87% English-only · Spanish 10% Vietnamese 2% Other Indo-European 1%
Political lean MEDSL · Volusia
- 2024 margin
- Strong R (+21.8) · D 38.7% · R 60.5%
- 2008→2024 swing
- -27.4pp toward R · 2008: 5.7pp · 2024: -21.8pp
- All cycles
- 2024: R+21.8 2020: R+14.1 2016: R+13.1 2012: R+1.2 2008: D+5.7
Not yet ingested
- Civics
- —
Market trends
- HPI YoY
- ▼ -247.35%
- Current HPI
- 294.803
- Rent YoY
- ▲ 1.89%
- Metro
- Deltona-Daytona Beach-Ormond Beach, FL
- State GDP YoY
- ▲ 3.28%
- F500 in state
- 36
Industry mix (Fortune 500 HQ in FL)
| Industry | F500 HQs | Revenue |
|---|---|---|
| Industrial Technology | 2 | $29B |
|
||
| Insurance | 2 | $17B |
|
||
| Retail | 1 | $60B |
|
||
| Technology Distribution | 1 | $58B |
|
||
| Homebuilding | 1 | $35B |
|
||
| Technology Manufacturing | 1 | $35B |
|
||
Price history
+1815.4% since first listed10 events — show timeline
- 2026-06-18 Listed $249,000 Stellar MLS as Distributed by MLS Grid
- 2018-05-10 Sold (Public Records) $132,500 Public Records
- 2010-10-07 Listing Removed — Stellar MLS as Distributed by MLS Grid
- 2010-04-07 Listed $89,900 Stellar MLS as Distributed by MLS Grid
- 2003-08-07 Sold (Public Records) $78,375 Public Records
- 2003-06-04 Sold (Public Records) $66,200 Public Records
- 1997-08-18 Sold (Public Records) $44,000 Public Records
- 1996-07-02 Sold (Public Records) $32,300 Public Records
- 1991-02-01 Sold (Public Records) $32,000 Public Records
- 1981-02-01 Sold (Public Records) $13,000 Public Records
Property tax history
+10.6%/yrLatest (2025): $3,488 · +1.5% YoY. Source: county tax records.
Cash-flow waterfall
monthlySold comps — $/sqft
last 12 mo · ≤1 miLoading sold comps…