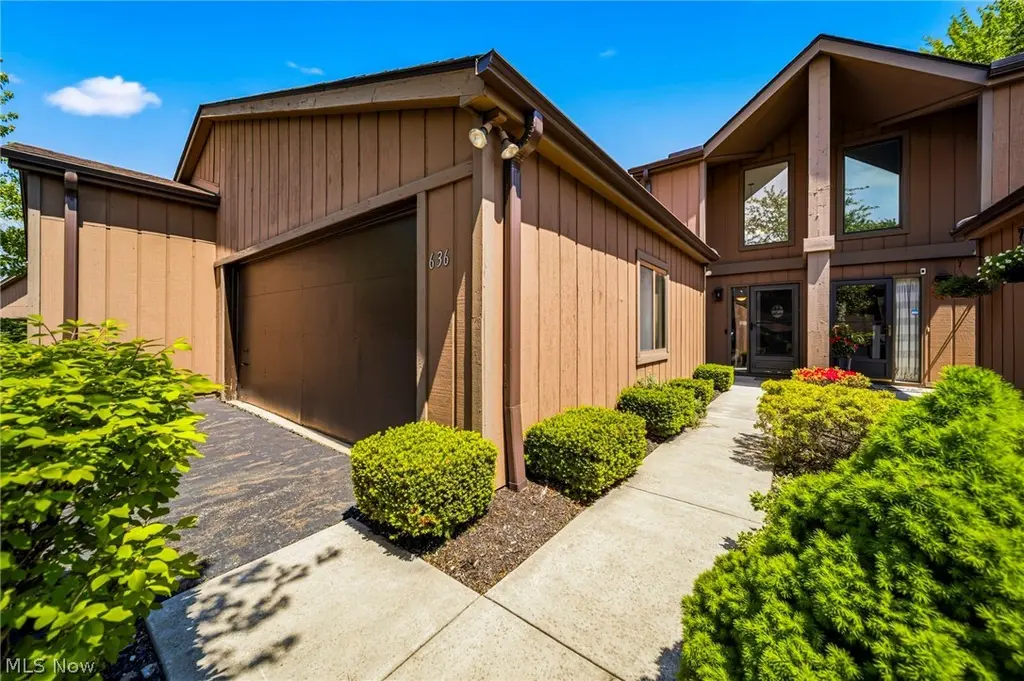
636 Cherry Park Oval · Aurora, OH
Flood risk No data
- FEMA flood zone
- —
- Chance of flooding over 30 yrs
- —
- Est. flood insurance / yr
- —
Fire risk No data
- Est. fire insurance / yr
- —
Heat risk No data
- Hot days now (above threshold)
- —
- Hot days in 30 yrs
- —
Wind risk No data
- Chance of severe wind over 30 yrs
- —
Air-quality risk No data
- Unhealthy air days now
- —
- Unhealthy air days in 30 yrs
- —
Risk factors via First Street. Map © Google.
Why this score? — see what drove the C- grade
The composite is a weighted blend of 9 inputs, each scored 0–100. Each bar is that input's sub-score; the figure is the points it added to the 100-point composite (weight × sub-score).
- ARV discount +15.0/15.0
- Cash flow +13.0/30.0
- Schools +7.2/10.0
- 1% rule +5.4/10.0
- DSCR +3.9/10.0
- Livability +3.8/5.0
- Rent growth +2.5/5.0
- Condition / age +2.5/5.0
- Appreciation +0.0/10.0
$275,000
🖨 Deal sheet 📄 Offer letter ✓ Due diligence
Listing remarks
Welcome home to this beautifully updated 3-bedroom, 2-bath condominium in the heart of Aurora! Step inside to soaring ceilings and an open, airy floor plan filled with natural light. The spacious living area offers stylish finishes and a warm, inviting feel, ideal for both relaxing and entertaining. The updated kitchen features modern appliances, ample cabinet space, and durable ceramic flooring. The first-floor primary suite provides comfort and convenience with a spacious closet and full bath. The second floor offers a similar primary bedroom plus an additional bedroom perfect for guests, family, or a home office. Enjoy the ease of in-unit laundry, extra storage, and a private patio where
Key facts
- Private patio
- Nearby parks
- Updated kitchen
Tags
Property features AI
Finance
- HOA & community: Homeowners association with monthly fee; HOA fee includes common area maintenance, insurance, structural maintenance, pest control, reserves, roof maintenance, sewer, snow removal, and trash
Exterior
- Parking: Attached garage with 2 spaces; Garage faces front; Garage door opener; Electricity in garage
- Utilities: Public water; Public sewer
- Home design: Two-story home; Entry level is first floor
- Construction: Wood siding; Asphalt/fiberglass roof; Built using public record year (year built from public records)
- Exterior features: Patio
Interior
- Kitchen: Kitchen on first floor
- Bedrooms: One main-level bedroom; Two upstairs bedrooms
- Flooring: Carpet in living areas and bedrooms; Ceramic tile in kitchen and laundry
- Bathrooms: Two full bathrooms; One main-level bathroom
- Heating & cooling: Baseboard heating; Central air conditioning
- Interior features: Built-in features; Ceiling fans; High ceilings; Open floor plan; Walk-in closet(s); Primary bedroom on main level
- Laundry & utility: In-unit laundry; Washer hookup; Gas dryer hookup
Neighborhood map
What this means for you Summary
Snapshot
- This is a 3-bed/2.0-bath condo listed at $275k.
Deal economics
- At list price, monthly cash flow is $-14 ($-163/yr) — negative.
- To cash-flow at today's rent, offer at most $273k (0.9% below list).
- Meets the 1% rule at list price ($3k rent vs $275k).
- Recommended offer: $273k (0.9% below list) — sets the bar for cash-flow.
- Cap rate 6.2% vs local median 2.5% in Aurora — top-decile yield for the area; either an underpriced asset or a hidden risk that comps aren't pricing in. Stress-test before assuming the spread holds.
Location & tenants
- Location reads 75/100 on livability (#258 in OH, #4,104 nationally) — a middle-class / working-renter tenant base. Strengths: schools A+, crime A+, employment A+; Watch: amenities F, commute F, health & safety F.
- Aurora City (suburban): math 79% / reading 84% proficiency, ranked #35 of 656 in OH (top 5%) — strong family-tenant draw, lease renewals of 3-5y typical; only 7% free/reduced lunch — higher-income household profile.
- Market conditions: 135 active listings in the ZIP; 2 comparable units currently listed for rent nearby; high-income renter base; 196 units permitted in Portage County in 2024 (10 in 5+ unit buildings).
Forward outlook
- Local home prices are declining (-3.0%/yr); year-one equity from $2k of loan paydown is wiped out by about $8k of value loss. Plan a longer hold.
Negotiation context
- Only 9 days on market — expect competitive offers; lowballing is unlikely to land.
- 6 sale attempts since 24y ago with the ask held roughly flat each time — persistent listings suggest the price (not the market) is what's stuck; bring a comps-based counter.
- Current owner paid $190k; 45% above their basis — modest negotiation headroom, anchor on the comps not their cost.
Questions for the listing agent
- What do current leases actually rent for vs. the listed asking? Can we see a recent rent roll and the last 12 months of T-12 income?
- What does the HOA fee cover, when was the last increase, and are there any pending special assessments or reserve-fund shortfalls?
- Any open or pending special assessments — roof, HVAC, plumbing, elevator, façade? What's the per-unit balance and payoff schedule, and is the seller paying it off at close or rolling it to the buyer?
- Is there a deadline driving the sale (1031 exchange, divorce, estate, relocation)? That informs how much negotiation room exists.
- Schools are A-rated — typically a magnet for longer-tenancy family renters. What's the average tenant stay here, and is there a school-zone premium baked into asking?
- What's the average days-on-market for RENTAL listings here right now (not sales)? A rising rental-DOM trend means longer vacancies and softer asking-rent achievability than the comps imply.
- What's the recent tenant-quality profile in this submarket — average credit score on applications, eviction rate, late-payment / NSF rate, and stable-employment percentage? A property-management company in the area should have these aggregated.
- How much new apartment / multifamily construction is in the pipeline within 1–3 miles? Heavy new supply (>2% of stock underway) typically softens rents 12–24 months out; light construction supports rent growth.
Investment metrics
- 1% rule
- 1.04% ✓
- Cap rate
- 6.23%
- Cash-on-cash
- -0.21%
- DSCR
- 0.99
- GRM
- 8.0
CMA / ARV
- ARV (median comp)
- $419,002
- List price
- $275,000
- Delta
- -34.37%
- Verdict
- UNDERPRICED
- Comps
- 20 within 1.0 mi
Projected returns pro-forma
-3.0% appreciation · 3.0% rent growth · sell at horizon
- IRR
- -16.5%
- Equity multiple
- 0.41×
- Total profit
- $-45,157
- Equity at exit
- $41,003
- IRR
- -8.1%
- Equity multiple
- 0.49×
- Total profit
- $-39,339
- Equity at exit
- $23,777
Cash invested: $77,000 (down + closing). Projections, not guarantees.
Landlord ↔ Tenant lean methodology
- Overall (STATE)
- 73 Landlord-Friendly
- State Ohio
- 73 Landlord-Friendly · R+6
- County
- — inherits STATE
- City
- — inherits STATE
ZIP-level market 44202
- Active inventory
- 135
- Price-to-rent
- 8.0×
Monthly cashflow live
- Estimated rent
- $2,856 medium interval (Pro) →
- Mortgage (P&I)
- −$1,442
- Tax from tax record
- −$277 /mo · $3,321/yr
- Insurance
- −$115
- HOA
- −$436
- Vacancy / Maint / Mgmt
- −$600
- Net cashflow
- $-14
Break-even live
UW: 25.0% down · 7.5% · 30yr · 1.5% tax · 5.0% vac · 8.0% maint · 8.0% mgmt
Financing live
Cash to close
- Down payment
- $68,750
- Closing costs
- $8,250
- Reserves months
- —
- Total cash needed
- —
Loan-product check · same deal, 3 products live
Conventional
25% down · 7.5% · 30yr
- Down + closing
- —
- Monthly P&I
- —
- Monthly cashflow
- —
- DSCR
- —
- Eligible?
- —
Personal DTI + credit; lowest rate.
DSCR
20% down · 8.5% · 30yr
- Down + closing
- —
- Monthly P&I
- —
- Monthly cashflow
- —
- DSCR
- —
- Eligible?
- —
No personal income docs; deal must DSCR.
Hard money
10% down · 12.0% · 12mo
- Down + closing
- —
- Monthly P&I
- —
- Monthly cashflow
- —
- DSCR
- —
- Eligible?
- —
Short-term bridge; refi at stabilization.
Rent comps 2 comps
| Address | Beds | Baths | Sqft | Rent | $/sqft | DOM | Units | Dist |
|---|---|---|---|---|---|---|---|---|
| 7340 Ferris ST Aurora, OH | 3.0 | 1.0–3.0 | 1138 | $3,230 | $2.84 | 1d | 1 | 0.85mi |
| 1177 Moneta Ave Aurora, OH | 4.0 | 2.0 | 1660 | $2,500 | $1.51 | 43d | 1 | 1.18mi |
HOA detail condo
- Monthly dues
- $436 · $5,232/yr
- Assessments
- None detected in remarks — confirm with the listing agent.
Listing history 14 events
-
2026-05-14$275,000 Active 980-char remark
-
2024-11-16historical
-
2024-10-16status Active
-
2024-09-17price $260,000
-
2024-09-17$269,000 Active
-
2021-05-03soldstatus $190,000
-
2021-04-30soldstatus $190,000
-
2021-02-24$190,000
-
2018-07-11soldstatus $145,500 Sold
-
2018-07-11soldstatus $145,500
-
2018-07-02status Pending
-
2018-06-08$164,900 Active
-
2002-12-13historical
-
2002-09-13$174,000
ⓘ Source: listings_history table (triggers on properties + properties_extension) + one-shot
backfill from property_details.listing_events for pre-trigger history.
Tax reassessment forecast OH · Partial reset (capped growth)
- Current annual tax
- $3,321 · $277/mo
- Projected year-2 tax
- $3,806 · $317/mo
- Expected delta
- +$484/yr (+$40/mo · 14.6%)
ⓘ Screening estimate from a state-policy table — verify with the county assessor before closing.
Nearby sold comps map
Loading sold comps map…
Walkable amenities ~0.75 mi
Loading nearby amenities…
Taxation est. · year 1
- Rental income
- $34,267
- − Mortgage interest
- −$15,404
- − Property taxes
- −$3,321
- − Insurance
- −$1,375
- − Repairs & maintenance
- −$2,741
- − Management
- −$2,741
- − HOA
- −$5,232
- − Depreciation
- −$8,000
- Taxable loss
- −$4,548
- Est. tax savings @ 24.0%
- +$1,092
- After-tax cash flow
- $929/yr
For passive investors: Depreciation is non-cash, so a rental often shows a tax loss while cash-flowing — sheltering income. Rental losses are passive: they offset passive income freely, and up to $25,000/yr can offset ordinary (W-2) income if you actively participate and your MAGI is under $100k (phasing out to $0 by $150k); unused losses carry forward. On sale, claimed depreciation is recaptured at up to 25%, and gains may owe capital-gains tax (a 1031 exchange can defer both). Figures are a year-1 estimate at your 24.0% rate — not tax advice; consult a CPA.
Schools (NCES district)
- District
- Aurora City
- NCES district ID
- 3904917
- Math proficiency
- 79% ▼ -7.00%
- Reading proficiency
- 84% ▼ -5.00%
- Median HH income
- $81,791
- Composite
- 71.93/100
- National rank
- #213
- State rank
- #35 of 656 in OH
Livability — Aurora
- Score
- 75/100
- State rank
- #258
- US rank
- #4104
Category grades
Schools grade is shown separately in the Schools card above.
Census & demographics
- Census place
- Aurora, OH
- County
- Portage · 165,699 people
- City population
- 22,857
- Metro
- Akron, OH
- Population (ZIP)
- 22,857
- Household income
- $116,556
- Rent vs Own
- Severe rent burden
- 4.9
Population outlook (Portage County) Hauer SSP2
- Today (2025)
- 166,109 people
- By 2030
- 167,752 · +1.0%
- By 2040
- 168,640 · +1.5%
- By 2050
- 167,469 · +0.8%
- By 2075
- 170,131 · +2.4%
- By 2100
- 167,958 · +1.1%
Race, ethnicity, and origin ACS 2023
- Neighborhood character
- Predominantly White (87%)
- Race & ethnicity
- White 87% Asian 4% Two or more races 4% Black 3%
- Common ancestry
- Romanian 9% Italian 3% Lithuanian 2%
- Foreign-born
- 6% · Canada, China, South Korea
- Languages at home
- 94% English-only · Other Indo-European 2% Other Asian/Pacific 1% Russian/Polish/Slavic 1%
Political lean MEDSL · Portage
- 2024 margin
- R (+15.5) · D 41.8% · R 57.3%
- 2008→2024 swing
- -24.5pp toward R · 2008: 9.0pp · 2024: -15.5pp
- All cycles
- 2024: R+15.5 2020: R+12.5 2016: R+10.2 2012: D+4.9 2008: D+9.0
Not yet ingested
- Civics
- —
Market trends
- HPI YoY
- ▼ -270.23%
- Current HPI
- 186.4919
- Rent YoY
- —
- Metro
- —
- State GDP YoY
- ▲ 1.98%
- F500 in state
- 48
Industry mix (Fortune 500 HQ in OH)
| Industry | F500 HQs | Revenue |
|---|---|---|
| Insurance | 3 | $145B |
|
||
| Industrial Machinery | 3 | $49B |
|
||
| Financial Services | 3 | $24B |
|
||
| Consumer Goods | 2 | $93B |
|
||
| Aerospace / Defense | 2 | $47B |
|
||
| Utilities | 2 | $33B |
|
||
Price history
+58.0% since first listed15 events — show timeline
- 2026-05-23 Pending — MLSNOW
- 2026-05-14 Listed $275,000 MLSNOW
- 2024-11-16 Listing Removed — MLSNOW
- 2024-10-16 Relisted — MLSNOW
- 2024-09-17 Price Changed $260,000 MLSNOW
- 2024-09-17 Listed $269,000 MLSNOW
- 2021-05-03 Sold (MLS) $190,000 MLSNOW
- 2021-04-30 Sold (Public Records) $190,000 Public Records
- 2021-02-24 Listed $190,000 MLSNOW
- 2018-07-11 Sold (Public Records) $145,500 Public Records
- 2018-07-11 Sold (MLS) $145,500 MLSNOW
- 2018-07-02 Pending — MLSNOW
- 2018-06-08 Listed $164,900 MLSNOW
- 2002-12-13 Listing Removed — MLSNOW
- 2002-09-13 Listed $174,000 MLSNOW
Property tax history
+4.9%/yrLatest (2025): $3,321 · +1.8% YoY. Source: county tax records.
Cash-flow waterfall
monthlySold comps — $/sqft
last 12 mo · ≤1 miLoading sold comps…