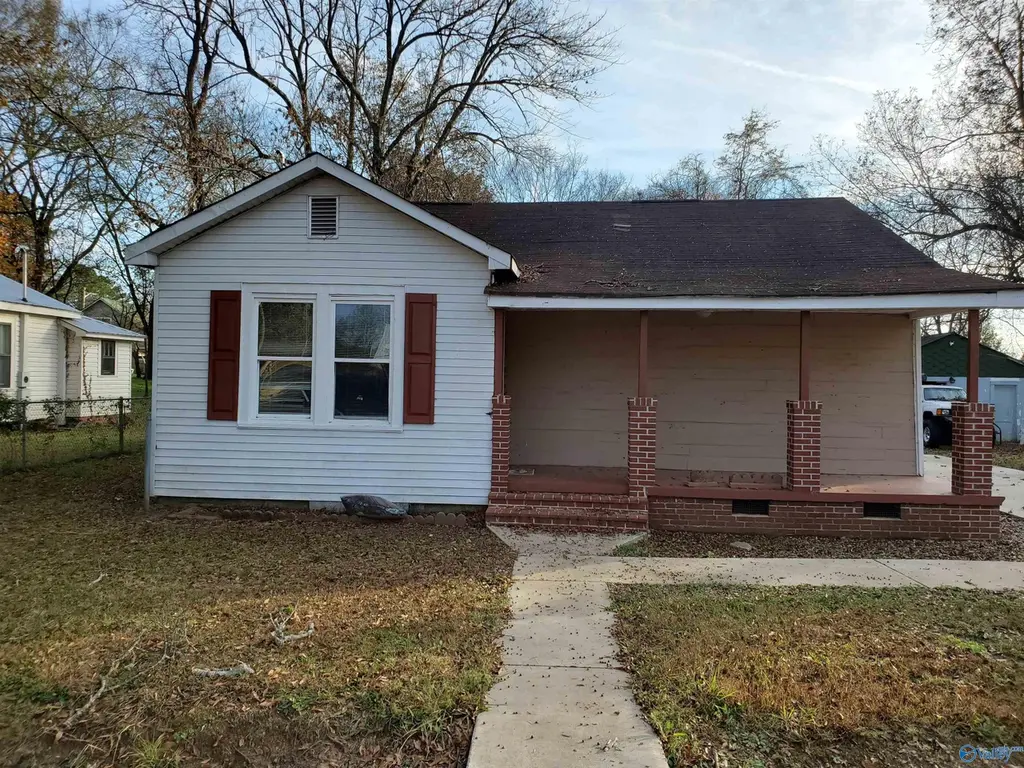
509 Appletree St · Scottsboro, AL
Flood risk 3/10 · Minor
- FEMA flood zone
- X (unshaded)
- Chance of flooding over 30 yrs
- 0.2%
- Est. flood insurance / yr
- $473 – $860
Fire risk 4/10 · Minor
- Est. fire insurance / yr
- $916 – $1,700
Heat risk 6/10 · Moderate
- Hot days now (above 107°F)
- 7 days/yr
- Hot days in 30 yrs
- 20 days/yr
Wind risk 4/10 · Minor
- Chance of severe wind over 30 yrs
- 17.0%
Air-quality risk 2/10 · Minimal
- Unhealthy air days now
- 1 days/yr
- Unhealthy air days in 30 yrs
- 1 days/yr
Risk factors via First Street. Map © Google.
Why this score? — see what drove the B- grade
The composite is a weighted blend of 9 inputs, each scored 0–100. Each bar is that input's sub-score; the figure is the points it added to the 100-point composite (weight × sub-score).
- Cash flow +26.2/30.0
- ARV discount +13.5/15.0
- DSCR +8.9/10.0
- 1% rule +5.8/10.0
- Livability +3.7/5.0
- Schools +3.4/10.0
- Rent growth +2.5/5.0
- Condition / age +2.5/5.0
- Appreciation +0.0/10.0
$135,000
🖨 Deal sheet 📄 Offer letter ✓ Due diligence
Listing remarks MLS
Charming 2 bedroom 2 bath bungalow located close to downtown. As per seller most of the windows are replaced, new wiring and sheetrock, mostly new plumbing.
Key facts
- New wiring
- New sheetrock
- Mostly new plumbing
Tags
Neighborhood map
What this means for you Summary
Snapshot
- This is a 2-bed/2.0-bath single-family listed at $135k.
Deal economics
- At list price, monthly cash flow is $344 ($4k/yr) — positive.
- The deal already cash-flows at list — no discount required.
- Meets the 1% rule at list price ($1k rent vs $135k).
- Recommended offer: $119k (12.0% below list) — sets the bar for market timing.
- Cap rate 9.3% vs local median 3.3% in Scottsboro — top-decile yield for the area; either an underpriced asset or a hidden risk that comps aren't pricing in. Stress-test before assuming the spread holds.
Location & tenants
- Location reads 74/100 on livability (#21 in AL, #4,752 nationally) — a middle-class / working-renter tenant base. Strengths: cost of living A+, health & safety A+, housing B+; Watch: schools C-, employment D+, amenities D-.
- Scottsboro City (town): math 27% / reading 54% proficiency, ranked #27 of 129 in AL (top 21%) — families likely to look elsewhere, expect single-tenant / working-renter base with shorter leases.
- Market conditions: 78 active listings in the ZIP; 2 comparable units currently listed for rent nearby; 46 units permitted in Jackson County in 2024 (0 in 5+ unit buildings).
Forward outlook
- Local home prices are declining (-3.0%/yr); year-one equity from $933 of loan paydown is wiped out by about $4k of value loss. Plan a longer hold.
- Jackson County population projected at -17% by 2050 — secular population decline; favor cash flow + early exit over multi-decade hold.
- At projected returns (-3.0% appreciation + 3.0% rent growth), your $38k cash investment doubles in ~10 years — after that, you're playing with house money.
Negotiation context
- It's been on market 212 days — a 12% lower offer ($119k) is reasonable based on typical stale-listing flexibility.
Risks & watch-outs
- Watch-outs: built in 1948 — expect roof / HVAC / electrical / plumbing capex.
- Climate carrying-cost: extreme-heat days projected 7→20/yr by 2055 (HVAC capex compounding) — expect insurance premiums to compound above CPI over the hold.
Questions for the listing agent
- It's been on market 212 days. Have you received any prior offers? Is the seller open to a 12% concession, seller financing, or rate buy-down credit?
- Built in 1948 — when were the roof, HVAC, electrical panel, plumbing, and water heater last replaced?
- Why hasn't it sold? Are there any deal-killer items the seller is aware of (foundation, flood, title, zoning, code violations)?
- Is there a deadline driving the sale (1031 exchange, divorce, estate, relocation)? That informs how much negotiation room exists.
- What's the average days-on-market for RENTAL listings here right now (not sales)? A rising rental-DOM trend means longer vacancies and softer asking-rent achievability than the comps imply.
- What's the recent tenant-quality profile in this submarket — average credit score on applications, eviction rate, late-payment / NSF rate, and stable-employment percentage? A property-management company in the area should have these aggregated.
- How much new for-sale + rental construction is in the pipeline within 1–3 miles? Heavy new supply typically softens prices + rents 12–24 months out; constrained supply supports both.
Investment metrics
- 1% rule
- 1.08% ✓
- Cap rate
- 9.35%
- Cash-on-cash
- 10.91%
- DSCR
- 1.49
- GRM
- 7.7
CMA / ARV
- ARV (median comp)
- $155,805
- List price
- $135,000
- Delta
- -13.35%
- Verdict
- UNDERPRICED
- Comps
- 20 within 1.0 mi
Show comp detail 12 sales within ~0.75 mi
| Address | Dist | Beds/Ba | Sqft | Sold | Price | $/sf | Match |
|---|---|---|---|---|---|---|---|
| 524 Thomas St | 0.09mi | 3/2.0 (+1) | 1,232 (-1%) | 14mo | $187,000 | $152 | 78 |
| 604 South St | 0.19mi | 2/2.0 | 1,285 (+4%) | 19mo | $234,000 | $182 | 70 |
| 605 Cedar Hill Dr | 0.25mi | 3/2.0 (+1) | 1,309 (+6%) | 7mo | $135,000 | $103 | 68 |
| 106 Magnolia Ln | 0.31mi | 2/1.0 | 1,320 (+6%) | 6mo | $150,000 | $114 | 66 |
| 314 Beverly St | 0.67mi | 3/2.0 (+1) | 1,247 (+1%) | 1mo | $185,800 | $149 | 62 |
| 208 Scott St | 0.55mi | 3/1.0 (+1) | 1,230 (-1%) | 7mo | $70,000 | $57 | 58 |
| 322 Sharon St | 0.73mi | 3/2.0 (+1) | 1,260 (+2%) | 7mo | $187,000 | $148 | 52 |
| 303 Hodges St | 0.32mi | 3/1.5 (+1) | 1,317 (+6%) | 21mo | $199,900 | $152 | 50 |
| 806 South Houston | 0.55mi | 2/1.0 | 1,388 (+12%) | 3mo | $189,000 | $136 | 48 |
| 219 Chestnut St | 0.37mi | 3/2.0 (+1) | 1,056 (-15%) | 8mo | $165,000 | $156 | 46 |
| 602 S Scott St | 0.68mi | 2/2.0 | 1,338 (+8%) | 16mo | $165,000 | $123 | 42 |
| 704 Recreation Ln | 0.39mi | 3/1.0 (+1) | 1,140 (-8%) | 21mo | $159,900 | $140 | 42 |
Match score weights: distance 35% · size 25% · config 20% · recency 20%. Top-matched comps best support the ARV.
Projected returns pro-forma
-3.0% appreciation · 3.0% rent growth · sell at horizon
- IRR
- -0.0%
- Equity multiple
- 1.00×
- Total profit
- $-44
- Equity at exit
- $20,129
- IRR
- 9.6%
- Equity multiple
- 1.74×
- Total profit
- $27,916
- Equity at exit
- $11,672
Cash invested: $37,800 (down + closing). Projections, not guarantees.
Landlord ↔ Tenant lean methodology
- Overall (STATE)
- 90 Strongly Landlord-Friendly
- State Alabama
- 90 Strongly Landlord-Friendly · R+15
- County
- — inherits STATE
- City
- — inherits STATE
ZIP-level market 35768
- Home prices YoY
- -16.1%
- Active inventory
- 78
- Price-to-rent
- 7.7×
Monthly cashflow live
- Estimated rent
- $1,454 medium interval (Pro) →
- Mortgage (P&I)
- −$708
- Tax from tax record
- −$41 /mo · $490/yr
- Insurance
- −$56
- HOA
- −$0
- Vacancy / Maint / Mgmt
- −$305
- Net cashflow
- $344
Break-even live
UW: 25.0% down · 7.5% · 30yr · 1.5% tax · 5.0% vac · 8.0% maint · 8.0% mgmt
Financing live
Cash to close
- Down payment
- $33,750
- Closing costs
- $4,050
- Reserves months
- —
- Total cash needed
- —
Loan-product check · same deal, 3 products live
Conventional
25% down · 7.5% · 30yr
- Down + closing
- —
- Monthly P&I
- —
- Monthly cashflow
- —
- DSCR
- —
- Eligible?
- —
Personal DTI + credit; lowest rate.
DSCR
20% down · 8.5% · 30yr
- Down + closing
- —
- Monthly P&I
- —
- Monthly cashflow
- —
- DSCR
- —
- Eligible?
- —
No personal income docs; deal must DSCR.
Hard money
10% down · 12.0% · 12mo
- Down + closing
- —
- Monthly P&I
- —
- Monthly cashflow
- —
- DSCR
- —
- Eligible?
- —
Short-term bridge; refi at stabilization.
Rent comps 2 comps
| Address | Beds | Baths | Sqft | Rent | $/sqft | DOM | Units | Dist |
|---|---|---|---|---|---|---|---|---|
| 208 Meadow St Unit B Scottsboro, AL | 3.0 | 2.0 | 1100 | $1,350 | $1.23 | 14d | 1 | 0.65mi |
| 314 Beverly St Scottsboro, AL | 3.0 | 2.0 | 1247 | $1,550 | $1.24 | 14d | 1 | 0.67mi |
Listing history 17 events
-
2026-06-19days on market $135,000 Active 212 DOM
-
2026-06-18days on market $135,000 Active 211 DOM
-
2026-06-17days on market $135,000 Active 210 DOM
-
2026-06-16days on market $135,000 Active 209 DOM
-
2026-06-15days on market $135,000 Active 208 DOM
-
2026-06-14days on market $135,000 Active 206 DOM
-
2026-06-12days on market $135,000 Active 205 DOM
-
2026-06-09days on market $135,000 Active 202 DOM
-
2026-06-08days on market $135,000 Active 201 DOM
-
2026-06-07days on market $135,000 Active 200 DOM
-
2026-06-07days on market $135,000 Active 199 DOM
-
2026-06-04days on market $135,000 Active 196 DOM
-
2026-06-02days on market $135,000 Active 195 DOM
-
2026-06-01days on market $135,000 Active 194 DOM
-
2026-05-31days on market $135,000 Active 193 DOM
-
2026-05-31days on market $135,000 Active 192 DOM
-
2025-11-19$135,000 Active 156-char remark
Show marketing remark (156 chars)
Charming 2 bedroom 2 bath bungalow located close to downtown. As per seller most of the windows are replaced, new wiring and sheetrock, mostly new plumbing.
ⓘ Source: listings_history table (triggers on properties + properties_extension) + one-shot
backfill from property_details.listing_events for pre-trigger history.
Tax reassessment forecast AL · Resets to sale price
- Current annual tax
- $490 · $41/mo
- Projected year-2 tax
- $554 · $46/mo
- Expected delta
- +$64/yr (+$5/mo · 13.0%)
ⓘ Screening estimate from a state-policy table — verify with the county assessor before closing.
Climate risk First Street
- Flood 3/10 Moderate FEMA zone X (unshaded) · 20% chance over 30 yrs
- Wildfire 4/10 Moderate
- Heat 6/10 Major 7 d/yr ≥107°F today · 20 d/yr by 30 yrs out
- Wind 4/10 Moderate 17% chance of damaging wind over 30 yrs
- Air quality 2/10 Low 1 unhealthy d/yr today · 1 by 30 yrs out
Nearby sold comps map
Loading sold comps map…
Walkable amenities ~0.75 mi
Loading nearby amenities…
Taxation est. · year 1
- Rental income
- $17,448
- − Mortgage interest
- −$7,562
- − Property taxes
- −$490
- − Insurance
- −$675
- − Repairs & maintenance
- −$1,396
- − Management
- −$1,396
- − Depreciation
- −$3,927
- Taxable income
- $2,003
- Est. tax owed @ 24.0%
- −$481
- After-tax cash flow
- $3,643/yr
For passive investors: Depreciation is non-cash, so a rental often shows a tax loss while cash-flowing — sheltering income. Rental losses are passive: they offset passive income freely, and up to $25,000/yr can offset ordinary (W-2) income if you actively participate and your MAGI is under $100k (phasing out to $0 by $150k); unused losses carry forward. On sale, claimed depreciation is recaptured at up to 25%, and gains may owe capital-gains tax (a 1031 exchange can defer both). Figures are a year-1 estimate at your 24.0% rate — not tax advice; consult a CPA.
Schools (NCES district)
- District
- Scottsboro City
- NCES district ID
- 0102940
- Math proficiency
- 27% ▼ -26.00%
- Reading proficiency
- 54% ▼ -3.00%
- Median HH income
- $38,210
- Composite
- 33.67/100
- National rank
- #5388
- State rank
- #27 of 129 in AL
Livability — Scottsboro
- Score
- 74/100
- State rank
- #21
- US rank
- #4752
Category grades
Schools grade is shown separately in the Schools card above.
Census & demographics
- Census place
- Scottsboro, AL
- Population (ZIP)
- 12,394
Population outlook (Jackson County) Hauer SSP2
- Today (2025)
- 50,261 people
- By 2030
- 48,655 · -3.2%
- By 2040
- 45,119 · -10.2%
- By 2050
- 41,518 · -17.4%
- By 2075
- 33,507 · -33.3%
- By 2100
- 26,385 · -47.5%
Race, ethnicity, and origin ACS 2023
- Neighborhood character
- Predominantly White (87%)
- Race & ethnicity
- White 87% Two or more races 5% Hispanic / Latino 4% Black 3% Native American 1%
- Common ancestry
- Serbian 2% Slovak 1% Iranian 1%
- Foreign-born
- 2% · Canada, Vietnam
- Languages at home
- 96% English-only · Spanish 3% Vietnamese 1%
Political lean MEDSL · Jackson
- 2024 margin
- Solid R (+71.4) · D 13.9% · R 85.4%
- 2008→2024 swing
- -34.5pp toward R · 2008: -36.9pp · 2024: -71.4pp
- All cycles
- 2024: R+71.4 2020: R+67.5 2016: R+62.5 2012: R+41.9 2008: R+36.9
Not yet ingested
- Civics
- —
Market trends
- HPI YoY
- ▼ -37.15%
- Current HPI
- 193.1223
- Rent YoY
- —
- Metro
- —
- State GDP YoY
- ▲ 2.94%
- F500 in state
- 4
Industry mix (Fortune 500 HQ in AL)
| Industry | F500 HQs | Revenue |
|---|---|---|
| Financial Services | 1 | $8B |
|
||
| Healthcare | 1 | $5B |
|
||
Price history
1 event — show timeline
- 2025-11-19 Listed $135,000 VMLS
Property tax history
+1.9%/yrLatest (2025): $490 · +7.0% YoY. Source: county tax records.
Cash-flow waterfall
monthlySold comps — $/sqft
last 12 mo · ≤1 miLoading sold comps…