941 Marion St · Daytona Beach, FL
Flood risk 6/10 · Moderate
- FEMA flood zone
- X (unshaded)
- Chance of flooding over 30 yrs
- 0.52%
- Est. flood insurance / yr
- $507 – $1,088
Fire risk 2/10 · Minimal
- Est. fire insurance / yr
- $947 – $1,759
Heat risk 9/10 · Severe
- Hot days now (above 103°F)
- 6 days/yr
- Hot days in 30 yrs
- 17 days/yr
Wind risk 10/10 · Severe
- Chance of severe wind over 30 yrs
- 99.0%
Air-quality risk 2/10 · Minimal
- Unhealthy air days now
- 2 days/yr
- Unhealthy air days in 30 yrs
- 2 days/yr
Risk factors via First Street. Map © Google.
Why this score? — see what drove the B grade
The composite is a weighted blend of 9 inputs, each scored 0–100. Each bar is that input's sub-score; the figure is the points it added to the 100-point composite (weight × sub-score).
- Cash flow +30.0/30.0
- DSCR +10.0/10.0
- 1% rule +9.7/10.0
- ARV discount +7.5/15.0
- Livability +4.2/5.0
- Schools +3.9/10.0
- Rent growth +3.4/5.0
- Condition / age +2.5/5.0
- Appreciation +0.0/10.0
$125,000
🖨 Deal sheet 📄 Offer letter ✓ Due diligence
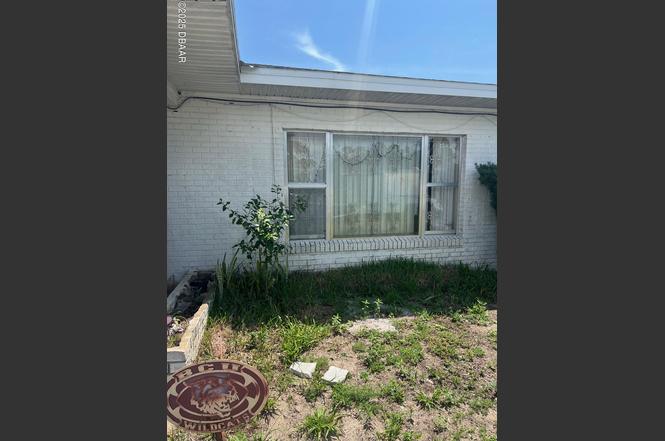
Listing remarks
This home will need total renovation. No appliances except water heater. Lots of potential. Roof is around 7 years old.
Key facts
- 7,405 sq ft lot
- Parking
- Built 1965
Neighborhood map
What this means for you Summary
Snapshot
- This is a 3-bed/2.0-bath single-family listed at $125k.
Deal economics
- At list price, monthly cash flow is $580 ($7k/yr) — positive.
- The deal already cash-flows at list — no discount required.
- Meets the 1% rule at list price ($2k rent vs $125k).
- Recommended offer: $121k (3.0% below list) — sets the bar for market timing.
Location & tenants
- Location reads 83/100 on livability (#46 in FL, #867 nationally) — a professional / high-income tenant draw. Strengths: amenities A+, commute A+, cost of living A+; Watch: schools D+, employment D-.
- Volusia (suburban): math 44% / reading 49% proficiency, ranked #47 of 73 in FL (top 64%) — families likely to look elsewhere, expect single-tenant / working-renter base with shorter leases.
- Market conditions: Rents rising (+3.6%/yr); 310 active listings in the ZIP; 33 comparable units currently listed for rent nearby; rentals at typical pace (median 24d on market — plan ~3-4 weeks tenant-placement turnaround); lower-income renter base — watch delinquency; 3,402 units permitted in Volusia County in 2024 (681 in 5+ unit buildings).
- At $1,834/mo this rent would consume 53% of the median local household income ($42k/yr) (locally 2772% of renters already pay >50% of income on rent) — very limited rent-growth headroom before tenants either downsize or default.
Forward outlook
- Local home prices are declining (-3.0%/yr); year-one equity from $864 of loan paydown is wiped out by about $4k of value loss. Plan a longer hold.
- Volusia County population projected at +19% by 2050 — long-run rental-demand tailwind backs the buy-and-hold thesis.
- At projected returns (-3.0% appreciation + 3.6% rent growth), your $35k cash investment doubles in ~6 years — after that, you're playing with house money.
Negotiation context
- It's been on market 35 days — a 3% lower offer ($121k) is reasonable based on typical stale-listing flexibility.
Risks & watch-outs
- Climate carrying-cost: major flood risk; severe wind risk, 99% chance of damaging wind over 30y; extreme-heat days projected 6→17/yr by 2055 (HVAC capex compounding) — expect insurance premiums to compound above CPI over the hold.
Questions for the listing agent
- It's been on market 35 days. Have you received any prior offers? Is the seller open to a 3% concession, seller financing, or rate buy-down credit?
- Built in 1965 — when were the roof, HVAC, electrical panel, plumbing, and water heater last replaced?
- Is there a deadline driving the sale (1031 exchange, divorce, estate, relocation)? That informs how much negotiation room exists.
- Schools are D-rated, which usually means shorter tenancies and higher turnover. Who's the typical renter profile here, and what's been the actual vacancy rate?
- What's the average days-on-market for RENTAL listings here right now (not sales)? A rising rental-DOM trend means longer vacancies and softer asking-rent achievability than the comps imply.
- What's the recent tenant-quality profile in this submarket — average credit score on applications, eviction rate, late-payment / NSF rate, and stable-employment percentage? A property-management company in the area should have these aggregated.
- How much new for-sale + rental construction is in the pipeline within 1–3 miles? Heavy new supply typically softens prices + rents 12–24 months out; constrained supply supports both.
Investment metrics
- 1% rule
- 1.47% ✓
- Cap rate
- 11.86%
- Cash-on-cash
- 19.87%
- DSCR
- 1.88
- GRM
- 5.7
CMA / ARV
No comps found within radius.
Projected returns pro-forma
-3.0% appreciation · 3.57% rent growth · sell at horizon
- IRR
- 12.7%
- Equity multiple
- 1.51×
- Total profit
- $17,747
- Equity at exit
- $18,638
- IRR
- 22.0%
- Equity multiple
- 2.93×
- Total profit
- $67,503
- Equity at exit
- $10,808
Cash invested: $35,000 (down + closing). Projections, not guarantees.
Landlord ↔ Tenant lean methodology
- Overall (STATE)
- 87 Strongly Landlord-Friendly
- State Florida
- 87 Strongly Landlord-Friendly · R+3
- County
- — inherits STATE
- City
- — inherits STATE
ZIP-level market 32114
- Home prices YoY
- -21.8%
- Rents YoY
- 3.6%
- Active inventory
- 310
- Price-to-rent
- 5.7×
Monthly cashflow live
- Estimated rent
- $1,834 high interval (Pro) →
- Mortgage (P&I)
- −$656
- Tax from tax record
- −$161 /mo · $1,938/yr
- Insurance
- −$52
- HOA
- −$0
- Vacancy / Maint / Mgmt
- −$385
- Net cashflow
- $580
Break-even live
UW: 25.0% down · 7.5% · 30yr · 1.5% tax · 5.0% vac · 8.0% maint · 8.0% mgmt
Financing live
Cash to close
- Down payment
- $31,250
- Closing costs
- $3,750
- Reserves months
- —
- Total cash needed
- —
Loan-product check · same deal, 3 products live
Conventional
25% down · 7.5% · 30yr
- Down + closing
- —
- Monthly P&I
- —
- Monthly cashflow
- —
- DSCR
- —
- Eligible?
- —
Personal DTI + credit; lowest rate.
DSCR
20% down · 8.5% · 30yr
- Down + closing
- —
- Monthly P&I
- —
- Monthly cashflow
- —
- DSCR
- —
- Eligible?
- —
No personal income docs; deal must DSCR.
Hard money
10% down · 12.0% · 12mo
- Down + closing
- —
- Monthly P&I
- —
- Monthly cashflow
- —
- DSCR
- —
- Eligible?
- —
Short-term bridge; refi at stabilization.
Rent comps 33 comps
| Address | Beds | Baths | Sqft | Rent | $/sqft | DOM | Units | Dist |
|---|---|---|---|---|---|---|---|---|
| 207 Francis Parkman Pl Unit 1 Daytona Beach, FL | 2.0 | 1.0 | 1200 | $1,550 | $1.29 | 23d | 1 | 0.30mi |
| 311 Country Club Oval Unit 311-112 Daytona Beach, FL | 2.0 | 1.0 | 940 | $1,375 | $1.46 | 14d | 1 | 0.32mi |
| 920 Lockhart St Daytona Beach, FL | 4.0 | 2.0 | 1248 | $2,250 | $1.80 | 14d | 1 | 0.45mi |
| 940 Lockhart St Daytona Beach, FL | 3.0 | 2.0 | 1071 | $1,850 | $1.73 | 19d | 1 | 0.47mi |
| 329 Wilder Blvd Daytona Beach, FL | 2.0 | 2.0 | 1161 | $1,900 | $1.64 | 23d | 1 | 0.49mi |
| 1350 Virginia Ave Apt 17 Daytona Beach, FL | 2.0 | 2.0 | 950 | $1,399 | $1.47 | 23d | 1 | 0.58mi |
| 1229 S Beach St Daytona Beach, FL | 1.0–3.0 | 1.0–2.0 | 906 | $2,125 | $2.34 | 19d | 1 | 0.59mi |
| 1351 S Ridgewood Ave #26 Daytona Beach, FL | 2.0 | 1.5 | 988 | $1,285 | $1.30 | 14d | 1 | 0.60mi |
| 808 Valencia Ave Daytona Beach, FL | 3.0 | 2.0 | 1222 | $2,200 | $1.80 | 23d | 1 | 0.60mi |
| 1500 Virginia Ave Daytona Beach, FL | 2.0 | 2.0 | 910 | $1,475 | $1.62 | 23d | 1 | 0.64mi |
| 721 S Beach St Unit 115A Daytona Beach, FL | 2.0 | 2.0 | 1025 | $1,850 | $1.80 | 14d | 1 | 0.66mi |
| 1401 S Palmetto Ave Daytona Beach, FL | 1.0–2.0 | 1.0–2.0 | 890 | $1,800 | $2.02 | 23d | 3 | 0.66mi |
| 1504 Virginia Ave Daytona Beach, FL | 1.0–2.0 | 1.0–2.0 | 842 | $1,650 | $1.96 | 23d | 3 | 0.68mi |
| 1174 Margina Ave Daytona Beach, FL | 3.0 | 2.0 | 1190 | $2,340 | $1.97 | 23d | 1 | 0.72mi |
| 213 Live Oak Ave Unit B Daytona Beach, FL | 2.0 | 1.0 | 900 | $1,285 | $1.43 | 23d | 1 | 0.85mi |
| 213 Live Oak Ave Unit A Daytona Beach, FL | 2.0 | 1.0 | 900 | $1,255 | $1.39 | 23d | 1 | 0.85mi |
| 342 S Segrave St Daytona Beach, FL | 2.0 | 1.0 | 900 | $1,125 | $1.25 | 23d | 1 | 0.87mi |
| 1436 Suwanee Rd Daytona Beach, FL | 4.0 | 2.0 | 1823 | $2,500 | $1.37 | 23d | 1 | 0.93mi |
| 131 Cottage Ln Unit 1 Daytona Beach, FL | 2.0 | 1.0 | 1829 | $1,600 | $0.87 | 23d | 1 | 0.96mi |
| 1505 Edgewater Rd Daytona Beach, FL | 3.0 | 2.0 | 1209 | $1,800 | $1.49 | 23d | 1 | 1.12mi |
| 716 Boston Ave South Daytona, FL | 2.0 | 2.0 | 1373 | $2,100 | $1.53 | 14d | 1 | 1.12mi |
| 1830 S Palmetto Ave Unit 4 South Daytona, FL | 2.0 | 1.0 | 900 | $1,450 | $1.61 | 23d | 1 | 1.29mi |
| 127 Moore Ave Daytona Beach, FL | 2.0 | 2.0 | 1616 | $1,900 | $1.18 | 23d | 1 | 1.32mi |
| 204 S Keech St Daytona Beach, FL | 3.0 | 2.0 | 1641 | $2,250 | $1.37 | 23d | 1 | 1.33mi |
| 2007 Schulte Ave Unit 1 Daytona Beach, FL | 2.0 | 1.0 | 975 | $1,300 | $1.33 | 23d | 1 | 1.33mi |
| 2037 Schulte Ave Daytona Beach, FL | 3.0 | 1.5 | 1170 | $2,600 | $2.22 | 23d | 1 | 1.36mi |
| 1952 Menger Cir South Daytona, FL | 3.0 | 2.0 | 1600 | $2,300 | $1.44 | 23d | 1 | 1.37mi |
| 1224 S Peninsula Dr #322 Daytona Beach, FL | 2.0 | 2.0 | 1038 | $1,600 | $1.54 | 14d | 1 | 1.38mi |
| 535 Olive St South Daytona, FL | 2.0 | 1.0 | 1024 | $1,725 | $1.68 | 11d | 1 | 1.39mi |
| 793 Aspen Dr South Daytona, FL | 2.0 | 2.0 | 1300 | $1,940 | $1.49 | 23d | 1 | 1.43mi |
| 100 Silver Beach Ave #816 Daytona Beach, FL | 2.0 | 2.0 | 1095 | $1,950 | $1.78 | 23d | 1 | 1.43mi |
| 1909 S Atlantic Ave Daytona Beach, FL | 2.0 | 1.0–2.0 | 1146 | $2,250 | $1.96 | 23d | 2 | 1.47mi |
| 602 Temko Ter Daytona Beach, FL | 3.0 | 2.0 | 1642 | $3,500 | $2.13 | 23d | 1 | 1.50mi |
Listing history 2 events
-
2025-07-24status Pending
-
2025-06-19$125,000 Active
ⓘ Source: listings_history table (triggers on properties + properties_extension) + one-shot
backfill from property_details.listing_events for pre-trigger history.
Tax reassessment forecast FL · Resets to sale price
- Current annual tax
- $1,938 · $161/mo
- Projected year-2 tax
- $1,938 · $161/mo
- Expected delta
- $0/yr ($0/mo · 0.0%)
ⓘ Screening estimate from a state-policy table — verify with the county assessor before closing.
Climate risk First Street
- Flood 6/10 Major FEMA zone X (unshaded) · 52% chance over 30 yrs
- Wildfire 2/10 Low
- Heat 9/10 Extreme 6 d/yr ≥103°F today · 17 d/yr by 30 yrs out
- Wind 10/10 Extreme 99% chance of damaging wind over 30 yrs
- Air quality 2/10 Low 2 unhealthy d/yr today · 2 by 30 yrs out
Nearby sold comps map
Loading sold comps map…
Walkable amenities ~0.75 mi
Loading nearby amenities…
Taxation est. · year 1
- Rental income
- $22,005
- − Mortgage interest
- −$7,002
- − Property taxes
- −$1,938
- − Insurance
- −$625
- − Repairs & maintenance
- −$1,760
- − Management
- −$1,760
- − Depreciation
- −$3,636
- Taxable income
- $5,283
- Est. tax owed @ 24.0%
- −$1,268
- After-tax cash flow
- $5,687/yr
For passive investors: Depreciation is non-cash, so a rental often shows a tax loss while cash-flowing — sheltering income. Rental losses are passive: they offset passive income freely, and up to $25,000/yr can offset ordinary (W-2) income if you actively participate and your MAGI is under $100k (phasing out to $0 by $150k); unused losses carry forward. On sale, claimed depreciation is recaptured at up to 25%, and gains may owe capital-gains tax (a 1031 exchange can defer both). Figures are a year-1 estimate at your 24.0% rate — not tax advice; consult a CPA.
Schools (NCES district)
- District
- Volusia
- NCES district ID
- 1201920
- Math proficiency
- 44% ▼ -9.00%
- Reading proficiency
- 49% ▼ -3.00%
- Median HH income
- $42,946
- Composite
- 39.2/100
- National rank
- #4019
- State rank
- #47 of 73 in FL
Livability — Daytona Beach
- Score
- 83/100
- State rank
- #46
- US rank
- #867
Category grades
Schools grade is shown separately in the Schools card above.
Census & demographics
- Census place
- Daytona Beach, FL
- County
- Volusia County · 556,871 people
- City population
- 67,539
- Metro
- Deltona-Daytona Beach-Ormond Beach, FL
- Population (ZIP)
- 37,747
- Household income
- $41,736
- Rent vs Own
- Severe rent burden
- 2772.0
Population outlook (Volusia County) Hauer SSP2
- Today (2025)
- 572,749 people
- By 2030
- 598,695 · +4.5%
- By 2040
- 644,880 · +12.6%
- By 2050
- 681,451 · +19.0%
- By 2075
- 759,957 · +32.7%
- By 2100
- 778,902 · +36.0%
Race, ethnicity, and origin ACS 2023
- Neighborhood character
- Diverse neighborhood (Simpson 0.65)
- Race & ethnicity
- Black 45% White 36% Hispanic / Latino 11% Two or more races 7% Asian 2%
- Hispanic origin (detail)
- Mexican 2% Puerto Rican 4%
- Common ancestry
- Romanian 1% Slovak 1% Lithuanian 1%
- Foreign-born
- 7% · Canada, South Korea
- Languages at home
- 90% English-only · Spanish 7% Arabic 1%
Political lean MEDSL · Volusia
- 2024 margin
- Strong R (+21.8) · D 38.7% · R 60.5%
- 2008→2024 swing
- -27.4pp toward R · 2008: 5.7pp · 2024: -21.8pp
- All cycles
- 2024: R+21.8 2020: R+14.1 2016: R+13.1 2012: R+1.2 2008: D+5.7
Not yet ingested
- Civics
- —
Market trends
- HPI YoY
- ▼ -75.93%
- Current HPI
- 272.5149
- Rent YoY
- ▲ 3.57%
- Metro
- Deltona-Daytona Beach-Ormond Beach, FL
- State GDP YoY
- ▲ 3.28%
- F500 in state
- 36
Industry mix (Fortune 500 HQ in FL)
| Industry | F500 HQs | Revenue |
|---|---|---|
| Industrial Technology | 2 | $29B |
|
||
| Insurance | 2 | $17B |
|
||
| Retail | 1 | $60B |
|
||
| Technology Distribution | 1 | $58B |
|
||
| Homebuilding | 1 | $35B |
|
||
| Technology Manufacturing | 1 | $35B |
|
||
Price history
2 events — show timeline
- 2025-07-24 Pending — Daytona MLS
- 2025-06-19 Listed $125,000 Daytona MLS
Property tax history
+18.7%/yrLatest (2025): $1,938 · -0.5% YoY. Source: county tax records.
Cash-flow waterfall
monthlySold comps — $/sqft
last 12 mo · ≤1 miLoading sold comps…