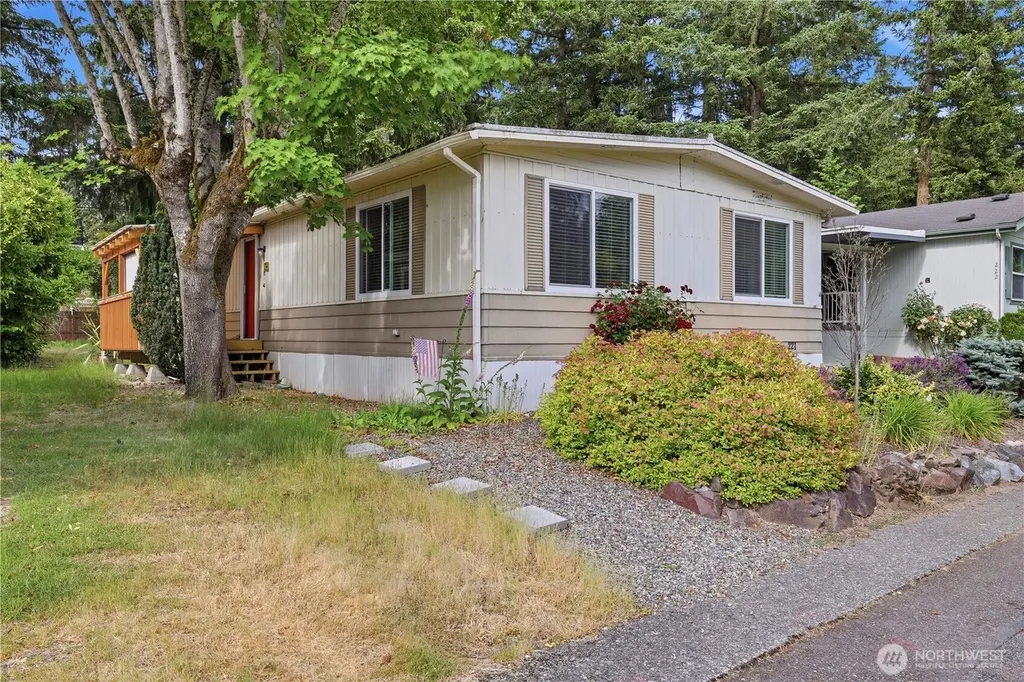
18425 NE 95th St #221 · Redmond, WA
Flood risk No data
- FEMA flood zone
- —
- Chance of flooding over 30 yrs
- —
- Est. flood insurance / yr
- —
Fire risk No data
- Est. fire insurance / yr
- —
Heat risk No data
- Hot days now (above threshold)
- —
- Hot days in 30 yrs
- —
Wind risk No data
- Chance of severe wind over 30 yrs
- —
Air-quality risk No data
- Unhealthy air days now
- —
- Unhealthy air days in 30 yrs
- —
Risk factors via First Street. Map © Google.
Why this score? — see what drove the B grade
The composite is a weighted blend of 9 inputs, each scored 0–100. Each bar is that input's sub-score; the figure is the points it added to the 100-point composite (weight × sub-score).
- Cash flow +30.0/30.0
- DSCR +10.0/10.0
- 1% rule +9.9/10.0
- Schools +7.5/10.0
- ARV discount +6.8/15.0
- Livability +4.4/5.0
- Rent growth +2.7/5.0
- Condition / age +2.5/5.0
- Appreciation +0.0/10.0
$184,950
🖨 Deal sheet (PDF) 📄 Offer letter ✓ Due diligence
Listing remarks
Imagine being able to enjoy this summer in this lovely air conditioned 2 bedroom mobile home in Friendly Village Mobile Home Park (for people 55 years old or older). This terrific home is in move-in condition. Whether it'll be a convenience or a necessity, the ramp will be greatly appreciated. Built in 1974, the home has 1248 square feet and a large, mostly level backyard. The primary bedroom has a walk-in closet and a primary bathroom with a spacious shower. Comfortable warmth in the winter will be provided by the pellet stove and electric furnace. The double pane windows and floors are only a few years old. Friendly Village is a wonderful place to live. There's a clubhouse with a large me
Key facts
- Walk-in closet
- Exercise room
- Double pane windows
Tags
Property features AI
Finance
- Other: Bus line nearby; Approximately 224 homes in the park
- Financial info: Land lease required ($860); Listing terms: Cash
- HOA & community: Located in Friendly Village manufactured home park; Park amenities include clubhouse, common area, community waterfront, exercise room, laundry, pool, recreational area, RV parking, and trails; Park approved for sale; Senior community
Exterior
- Parking: Carport
- Utilities: Public water; City sewer; Electric service (PSE)
- Home design: Manufactured double-wide home (Brookwood Rex); One level; Skirted with metal
- Construction: Metal/vinyl construction materials; Metal roof
- Exterior features: Metal/vinyl exterior; Metal shed in backyard; Patio/porch/deck; Located on a cul-de-sac; Paved access
Interior
- Kitchen: Dishwasher; Microwave; Refrigerator; Stove/Range
- Bedrooms: 2 bedrooms
- Flooring: Vinyl; Carpet
- Bathrooms: 1 full bath; 1 three-quarter bath; 1 bathtub; 1 shower
- Heating & cooling: Forced air heating; Forced air cooling
- Interior features: Water heater (electric) located in outside closet; Pellet stove
- Laundry & utility: Washer; Dryer
Neighborhood map
What this means for you Summary
Snapshot
- This is a 2-bed/2.0-bath manufactured listed at $185k.
Deal economics
- At list price, monthly cash flow is $902 ($11k/yr) — positive.
- The deal already cash-flows at list — no discount required.
- Meets the 1% rule at list price ($3k rent vs $185k).
- Cap rate 12.1% vs local median 1.4% in Redmond — top-decile yield for the area; either an underpriced asset or a hidden risk that comps aren't pricing in. Stress-test before assuming the spread holds.
Location & tenants
- Location reads 88/100 on livability (#10 in WA, #186 nationally) — a professional / high-income tenant draw. Strengths: amenities A+, commute A+, employment A+; Watch: cost of living F.
- Lake Washington School District (suburban): math 79% / reading 85% proficiency, ranked #3 of 291 in WA (top 1%) — strong family-tenant draw, lease renewals of 3-5y typical; only 10% free/reduced lunch — higher-income household profile.
- Zoned schools: Emily Dickinson Elementary (305 students, 11% FRL); Evergreen Middle School (771 students, 10% FRL); Redmond High School (2,218 students, 15% FRL) — zoned schools at 12% FRL track the district average.
- Market conditions: Rents flat; 337 active listings in the ZIP; 40 comparable units currently listed for rent nearby; rentals leasing fast (median 7d on market — plan ~1-2 weeks tenant-placement turnaround); high-income renter base; 10,555 units permitted in King County in 2024 (7,119 in 5+ unit buildings).
Forward outlook
- Local home prices are declining (-3.0%/yr); year-one equity from $1k of loan paydown is wiped out by about $6k of value loss. Plan a longer hold.
- King County population projected at +44% by 2050 — long-run rental-demand tailwind backs the buy-and-hold thesis.
- At projected returns (-3.0% appreciation + 0.7% rent growth), your $52k cash investment doubles in ~7 years — after that, you're playing with house money.
Negotiation context
- Only 7 days on market — expect competitive offers; lowballing is unlikely to land.
- 5 sale attempts since 21y ago with the ask held roughly flat each time — persistent listings suggest the price (not the market) is what's stuck; bring a comps-based counter.
- Current owner paid $130k; 42% above their basis — modest negotiation headroom, anchor on the comps not their cost.
Questions for the listing agent
- Built in 1974 — when were the roof, HVAC, electrical panel, plumbing, and water heater last replaced?
- Is there a deadline driving the sale (1031 exchange, divorce, estate, relocation)? That informs how much negotiation room exists.
- Schools are A-rated — typically a magnet for longer-tenancy family renters. What's the average tenant stay here, and is there a school-zone premium baked into asking?
- What's the average days-on-market for RENTAL listings here right now (not sales)? A rising rental-DOM trend means longer vacancies and softer asking-rent achievability than the comps imply.
- What's the recent tenant-quality profile in this submarket — average credit score on applications, eviction rate, late-payment / NSF rate, and stable-employment percentage? A property-management company in the area should have these aggregated.
- How much new for-sale + rental construction is in the pipeline within 1–3 miles? Heavy new supply typically softens prices + rents 12–24 months out; constrained supply supports both.
Investment metrics
- 1% rule
- 1.49% ✓
- Cap rate
- 12.14%
- Cash-on-cash
- 20.89%
- DSCR
- 1.93
- GRM
- 5.6
CMA / ARV
- ARV (on-the-fly)
- $182,208
- Comps found
- 6
Show comp detail 6 sales within ~0.75 mi
| Address | Dist | Beds/Ba | Sqft | Sold | Price | $/sf | Match |
|---|---|---|---|---|---|---|---|
| 18425 NE 95th St #76 | 0.07mi | 3/2.0 (+1) | 1,248 (0%) | 1mo | $175,000 | $140 | 91 |
| 18425 NE 95th St #183 | 0.04mi | 3/2.0 (+1) | 1,248 (0%) | 12mo | $172,450 | $138 | 83 |
| 18425 NE 95th St #43 | 0.10mi | 3/2.0 (+1) | 1,334 (+7%) | 9mo | $257,000 | $193 | 72 |
| 18425 NE 95th St #148 | 0.10mi | 3/2.0 (+1) | 1,344 (+8%) | 11mo | $265,000 | $197 | 69 |
| 18425 NE 95th St #85 | 0.10mi | 2/2.0 | 1,104 (-12%) | 10mo | $155,000 | $140 | 68 |
| 18425 NE 95th St #108 | 0.09mi | 3/2.0 (+1) | 1,344 (+8%) | 19mo | $196,500 | $146 | 62 |
Match score weights: distance 35% · size 25% · config 20% · recency 20%. Top-matched comps best support the ARV.
Projected returns pro-forma
-3.0% appreciation · 0.65% rent growth · sell at horizon
- IRR
- 10.6%
- Equity multiple
- 1.41×
- Total profit
- $21,124
- Equity at exit
- $27,577
- IRR
- 17.7%
- Equity multiple
- 2.30×
- Total profit
- $67,555
- Equity at exit
- $15,991
Cash invested: $51,786 (down + closing). Projections, not guarantees.
Landlord ↔ Tenant lean methodology
- Overall (STATE)
- 28 Tenant-Leaning
- State Washington
- 28 Tenant-Leaning · D+8
- County
- — inherits STATE
- City
- — inherits STATE
ZIP-level market 98052
- Rents YoY
- 0.7%
- Active inventory
- 337
- Price-to-rent
- 5.6×
Monthly cashflow live
- Estimated rent
- $2,759 high interval (Pro) →
- Mortgage (P&I)
- −$970
- Tax est. 1.5%
- −$231 /mo · $2,774/yr
- Insurance
- −$77
- HOA
- −$0
- Vacancy / Maint / Mgmt
- −$579
- Net cashflow
- $902
Break-even live
Sensitivity live
| Price | -10% $1,029 | -5% $966 | +0% $902 | +5% $838 | +10% $774 |
|---|---|---|---|---|---|
| Rent | -10% $684 | -5% $793 | +0% $902 | +5% $1,011 | +10% $1,120 |
| Rate | -1.0pp $995 | -0.5pp $949 | base $902 | +0.5pp $854 | +1.0pp $805 |
UW: 25.0% down · 7.5% · 30yr · 1.5% tax · 5.0% vac · 8.0% maint · 8.0% mgmt
Financing live
Cash to close
- Down payment
- $46,238
- Closing costs
- $5,548
- Reserves months
- —
- Total cash needed
- —
Loan-product check · same deal, 3 products live
Conventional
25% down · 7.5% · 30yr
- Down + closing
- —
- Monthly P&I
- —
- Monthly cashflow
- —
- DSCR
- —
- Eligible?
- —
Personal DTI + credit; lowest rate.
DSCR
20% down · 8.5% · 30yr
- Down + closing
- —
- Monthly P&I
- —
- Monthly cashflow
- —
- DSCR
- —
- Eligible?
- —
No personal income docs; deal must DSCR.
Hard money
10% down · 12.0% · 12mo
- Down + closing
- —
- Monthly P&I
- —
- Monthly cashflow
- —
- DSCR
- —
- Eligible?
- —
Short-term bridge; refi at stabilization.
Rent comps 40 comps
| Address | Beds | Baths | Sqft | Rent | $/sqft | DOM | Units | Dist |
|---|---|---|---|---|---|---|---|---|
| 9056 Avondale Rd NE Redmond, WA | 3.0 | 1.0 | 1500 | $3,400 | $2.27 | 6d | 1 | 0.23mi |
| 9981 Avondale Rd NE Redmond, WA | 2.0 | 2.5 | 1280 | $2,900 | $2.27 | 45d | 1 | 0.26mi |
| 9009 Avondale Rd NE Unit K122 Redmond, WA | 2.0 | 2.0 | 958 | $2,800 | $2.92 | 26d | 1 | 0.39mi |
| 9009 Avondale Rd NE Redmond, WA | 2.0 | 2.0 | 1026 | $2,672 | $2.60 | 45d | 2 | 0.43mi |
| 17771 NE 90th St Redmond, WA | 1.0–3.0 | 1.0–2.0 | 1062 | $2,965 | $2.79 | 0d | 13 | 0.52mi |
| 8653 Avondale Rd NE Unit B204 Redmond, WA | 3.0 | 2.0 | 1164 | $3,150 | $2.71 | 45d | 1 | 0.59mi |
| 17202 NE 85th Pl Redmond, WA | 2.0 | 1.0–2.0 | 891 | $2,457 | $2.76 | 0d | 4 | 0.73mi |
| 17634 NE Union Hill Rd Redmond, WA | 1.0–2.0 | 1.0–2.0 | 822 | $2,987 | $3.63 | 0d | 5 | 0.80mi |
| 10909 Avondale Rd NE Unit P161 Redmond, WA | 3.0 | 2.5 | 1487 | $3,600 | $2.42 | 19d | 1 | 0.87mi |
| 8222 169th Ave NE Unit C4 Redmond, WA | 2.0 | 1.0 | 831 | $2,195 | $2.64 | 26d | 1 | 1.10mi |
| 8020 169th Ave NE Unit 12 Redmond, WA | 2.0 | 1.0 | 750 | $1,999 | $2.67 | 26d | 1 | 1.16mi |
| 8020 169th Ave NE Apt 2 Redmond, WA | 2.0 | 1.0 | 750 | $1,999 | $2.67 | 0d | 1 | 1.16mi |
| 11305 183rd Pl NE Redmond, WA | 3.0 | 1.0–3.0 | 1211 | $3,495 | $2.89 | 0d | 1 | 1.17mi |
| 16910 NE 80th St Redmond, WA | 2.0 | 1.0 | 825 | $1,995 | $2.42 | 21d | 1 | 1.18mi |
| 16518 NE 91st St Redmond, WA | 1.0–2.0 | 1.0 | 900 | $2,725 | $3.03 | 6d | 8 | 1.22mi |
| 8851 166th Ave NE Unit A101 Redmond, WA | 1.0 | 1.0 | 772 | $1,995 | $2.58 | 23d | 1 | 1.22mi |
| 7805 170th Pl NE Redmond, WA | 1.0 | 1.0 | 725 | $2,388 | $3.29 | 0d | 2 | 1.22mi |
| 16405 NE 95th St Redmond, WA | 1.0–2.0 | 1.0–1.5 | 940 | $2,400 | $2.55 | 45d | 4 | 1.24mi |
| 8839 166th Ave NE Unit C101 Redmond, WA | 1.0 | 1.0 | 772 | $2,000 | $2.59 | 12d | 1 | 1.24mi |
| 8845 166th Ave NE Unit B104 Redmond, WA | 1.0 | 1.0 | 772 | $2,400 | $3.11 | 0d | 1 | 1.24mi |
| 8700 164th Ave NE Redmond, WA | 1.0 | 1.0 | 865 | $2,861 | $3.31 | 45d | 1 | 1.31mi |
| 8704 164th Ave NE Redmond, WA | 2.0 | 1.0 | 950 | $1,135 | $1.19 | 45d | 1 | 1.32mi |
| 16590 NE 83rd St Redmond, WA | 2.0 | 1.0–2.0 | 769 | $3,295 | $4.28 | 11d | 3 | 1.32mi |
| 9200 Redmond Woodinville Rd NE Redmond, WA | 1.0 | 1.0 | 750 | $2,128 | $2.84 | 0d | 2 | 1.33mi |
| 8920 Redmond Woodinville Rd NE Unit 8946 Redmond, WA | 1.0 | 1.0 | 756 | $1,695 | $2.24 | 6d | 1 | 1.35mi |
| 8920 Redmond Woodinville Rd NE Unit 8952 Redmond, WA | 2.0 | 1.0 | 875 | $1,885 | $2.15 | 6d | 1 | 1.35mi |
| 10509 165th Pl NE Unit 1545767P Redmond, WA | 2.0 | 2.0 | 990 | $6,032 | $6.09 | 16d | 1 | 1.35mi |
| 7705 168th Ave NE Redmond, WA | 1.0 | 1.0 | 731 | $2,794 | $3.82 | 4d | 4 | 1.35mi |
| 17620 NE 69th Ct Redmond, WA | 1.0–3.0 | 1.0–2.0 | 994 | $3,474 | $3.49 | 0d | 21 | 1.36mi |
| 9398 Redmond Woodinville Rd NE #126 Redmond, WA | 1.0 | 1.0 | 750 | $1,962 | $2.62 | 45d | 1 | 1.36mi |
| 9110 Woodinville Redmond Rd NE Unit PM-UF-RED9110_302 Redmond, WA | 2.0 | 1.0 | 925 | $2,375 | $2.57 | 6d | 1 | 1.36mi |
| 9200 Woodinville Redmond Rd NE Unit D 326 Redmond, WA | 2.0 | 2.5 | 1330 | $2,995 | $2.25 | 45d | 1 | 1.37mi |
| 16771 Redmond Way Redmond, WA | 3.0 | 1.0–2.0 | 928 | $3,983 | $4.29 | 0d | 266 | 1.39mi |
| 8280 164th Ave NE Redmond, WA | 2.0 | 1.0–2.0 | 828 | $3,494 | $4.22 | 0d | 9 | 1.40mi |
| 16550 NE 79th St Redmond, WA | 1.0–2.0 | 1.0–2.0 | 818 | $3,383 | $4.13 | 4d | 3 | 1.40mi |
| 16595 Redmond Way Redmond, WA | 1.0–2.0 | 1.0–2.0 | 830 | $4,487 | $5.40 | 0d | 27 | 1.43mi |
| 16255 NE 87th St Redmond, WA | 3.0 | 1.0–2.0 | 776 | $2,285 | $2.95 | 0d | 7 | 1.43mi |
| 9484 Redmond Woodinville Rd NE Unit C204 Redmond, WA | 2.0 | 1.0 | 800 | $2,295 | $2.87 | 45d | 1 | 1.43mi |
| 16275 NE 85th St #313 Redmond, WA | 2.0 | 2.0 | 983 | $3,095 | $3.15 | 23d | 1 | 1.44mi |
| 9474 Redmond Woodinville Rd NE Redmond, WA | 2.0 | 1.0 | 844 | $2,400 | $2.84 | 0d | 1 | 1.44mi |
Listing history 5 events
-
2026-06-13statusdays on market $184,950 Pending 7 DOM
-
2026-06-09days on market $184,950 Active 4 DOM
-
2026-06-08days on market $184,950 Active 3 DOM
-
2026-06-07remarks 699-char remark
-
2026-06-07$184,950 Active 2 DOM
ⓘ Source: listings_history table (triggers on properties + properties_extension) + one-shot
backfill from property_details.listing_events for pre-trigger history.
Nearby sold comps map
Loading sold comps map…
Walkable amenities ~0.75 mi
Loading nearby amenities…
Taxation est. · year 1
- Rental income
- $33,111
- − Mortgage interest
- −$10,360
- − Property taxes
- −$2,774
- − Insurance
- −$925
- − Repairs & maintenance
- −$2,649
- − Management
- −$2,649
- − Depreciation
- −$5,380
- Taxable income
- $8,374
- Est. tax owed @ 24.0%
- −$2,010
- After-tax cash flow
- $8,810/yr
For passive investors: Depreciation is non-cash, so a rental often shows a tax loss while cash-flowing — sheltering income. Rental losses are passive: they offset passive income freely, and up to $25,000/yr can offset ordinary (W-2) income if you actively participate and your MAGI is under $100k (phasing out to $0 by $150k); unused losses carry forward. On sale, claimed depreciation is recaptured at up to 25%, and gains may owe capital-gains tax (a 1031 exchange can defer both). Figures are a year-1 estimate at your 24.0% rate — not tax advice; consult a CPA.
Schools (NCES district)
- District
- Lake Washington School District
- NCES district ID
- 5304230
- Math proficiency
- 79% ▬ 0.00%
- Reading proficiency
- 85% ▲ 1.00%
- Median HH income
- $103,849
- Composite
- 75.15/100
- National rank
- #251
- State rank
- #3 of 291 in WA
Livability — Redmond
- Score
- 88/100
- State rank
- #10
- US rank
- #186
Category grades
Schools grade is shown separately in the Schools card above.
Census & demographics
- Census place
- Redmond, WA
- County
- King County · 2,251,916 people
- City population
- 103,482
- Metro
- Seattle-Tacoma-Bellevue, WA
- Population (ZIP)
- 80,717
- Household income
- $163,460
- Rent vs Own
- Severe rent burden
- 3044.0
Population outlook (King County) Hauer SSP2
- Today (2025)
- 2,576,485 people
- By 2030
- 2,803,316 · +8.8%
- By 2040
- 3,255,921 · +26.4%
- By 2050
- 3,706,444 · +43.9%
- By 2075
- 4,746,063 · +84.2%
- By 2100
- 5,407,730 · +109.9%
Race, ethnicity, and origin ACS 2023
- Neighborhood character
- Diverse neighborhood (Simpson 0.62)
- Race & ethnicity
- White 47% Asian 38% Two or more races 7% Hispanic / Latino 7% Black 2%
- Hispanic origin (detail)
- Mexican 5%
- Common ancestry
- Portuguese 2% Italian 2% Scotch-Irish 2%
- Foreign-born
- 44% · China, Canada, South Korea
- Languages at home
- 53% English-only · Other Asian/Pacific 11% Chinese 10% Other Indo-European 10%
Political lean MEDSL · King
- 2024 margin
- Solid D (+51.7) · D 74.2% · R 22.5% · Other 3.4%
- 2008→2024 swing
- +9.6pp toward D · 2008: 42.1pp · 2024: 51.7pp
- All cycles
- 2024: D+51.7 2020: D+52.7 2016: D+50.4 2012: D+39.9 2008: D+42.1
Not yet ingested
- Civics
- —
Market trends
- HPI YoY
- ▼ -1157.66%
- Current HPI
- 434.1949
- Rent YoY
- ▲ 0.65%
- Metro
- Seattle-Tacoma-Bellevue, WA
- State GDP YoY
- ▲ 4.65%
- F500 in state
- 22
Industry mix (Fortune 500 HQ in WA)
| Industry | F500 HQs | Revenue |
|---|---|---|
| Retail | 2 | $269B |
|
||
| Technology / Retail | 1 | $638B |
|
||
| Technology | 1 | $245B |
|
||
| Telecommunications | 1 | $38B |
|
||
| Food / Beverage | 1 | $36B |
|
||
| Automotive / Trucks | 1 | $34B |
|
||
Price history
+827.1% since first listed23 events — show timeline
- 2026-06-05 Listed $184,950 NWMLS as Distributed by MLS Grid
- 2022-11-04 Sold (MLS) $130,000 NWMLS as Distributed by MLS Grid
- 2022-10-06 Pending — NWMLS as Distributed by MLS Grid
- 2022-08-23 Listed $138,500 NWMLS as Distributed by MLS Grid
- 2020-01-24 Sold (MLS) $57,500 NWMLS as Distributed by MLS Grid
- 2020-01-08 Pending — NWMLS as Distributed by MLS Grid
- 2020-01-07 Pending — NWMLS as Distributed by MLS Grid
- 2020-01-06 Relisted — NWMLS as Distributed by MLS Grid
- 2020-01-01 Delisted — NWMLS as Distributed by MLS Grid
- 2019-11-18 Price Changed $60,000 NWMLS as Distributed by MLS Grid
- 2019-11-07 Price Changed $65,000 NWMLS as Distributed by MLS Grid
- 2019-10-26 Price Changed $75,000 NWMLS as Distributed by MLS Grid
- 2019-09-23 Price Changed $80,000 NWMLS as Distributed by MLS Grid
- 2019-08-08 Price Changed $85,000 NWMLS as Distributed by MLS Grid
- 2019-08-02 Price Changed $90,000 NWMLS as Distributed by MLS Grid
- 2019-07-22 Price Changed $95,000 NWMLS as Distributed by MLS Grid
- 2019-07-15 Price Changed $100,000 NWMLS as Distributed by MLS Grid
- 2019-07-10 Price Changed $105,000 NWMLS as Distributed by MLS Grid
- 2019-07-02 Price Changed $110,000 NWMLS as Distributed by MLS Grid
- 2019-06-24 Price Changed $115,000 NWMLS as Distributed by MLS Grid
- 2019-06-12 Listed $125,000 NWMLS as Distributed by MLS Grid
- 2005-08-11 Sold (MLS) $19,950 NWMLS as Distributed by MLS Grid
- 2005-07-06 Listed $19,950 NWMLS as Distributed by MLS Grid
Cash-flow waterfall
monthlySold comps — $/sqft
last 12 mo · ≤1 miLoading sold comps…