8702 Division Ave · Birmingham, AL
Flood risk No data
- FEMA flood zone
- —
- Chance of flooding over 30 yrs
- —
- Est. flood insurance / yr
- —
Fire risk No data
- Est. fire insurance / yr
- —
Heat risk No data
- Hot days now (above threshold)
- —
- Hot days in 30 yrs
- —
Wind risk No data
- Chance of severe wind over 30 yrs
- —
Air-quality risk No data
- Unhealthy air days now
- —
- Unhealthy air days in 30 yrs
- —
Risk factors via First Street. Map © Google.
Why this score? — see what drove the B grade
The composite is a weighted blend of 9 inputs, each scored 0–100. Each bar is that input's sub-score; the figure is the points it added to the 100-point composite (weight × sub-score).
- Cash flow +30.0/30.0
- ARV discount +15.0/15.0
- 1% rule +10.0/10.0
- DSCR +10.0/10.0
- Livability +3.4/5.0
- Rent growth +3.0/5.0
- Condition / age +1.0/5.0
- Schools +0.9/10.0
- Appreciation +0.0/10.0
$59,900
🖨 Deal sheet 📄 Offer letter ✓ Due diligence
Listing remarks
SPACIOUS HOME
Key facts
- 7,840 sq ft lot
- Built 1935
- Listed 5 days
Property features AI
Finance
- HOA & community: No association fees
Exterior
- Parking: Driveway parking
- Security: No security features listed
- Utilities: Public water; Electric water heater; Internet service available
- Home design: Existing home; Single-story layout (all rooms listed on main level); Wood construction
- Construction: Wood construction; Crawl space foundation
- Exterior features: No pool; No patio or garden/patio; No decks; Not waterfront; Lot approximately 0.18 acres
Interior
- Kitchen: No kitchen appliance details provided
- Bedrooms: Three bedrooms on the main level
- Flooring: Hardwood floors
- Bathrooms: One full bathroom with tub/shower combo on the main level
- Heating & cooling: Central heating; Central cooling
- Interior features: Hardwood flooring; Ceilings: other (see remarks); No additional interior features listed
- Laundry & utility: Main-level laundry room with washer hookup and electric dryer hookup
Neighborhood map
What this means for you Summary
Snapshot
- This is a 3-bed/1.0-bath single-family listed at $60k. Condition is rated poor.
Deal economics
- At list price, monthly cash flow is $536 ($6k/yr) — positive.
- The deal already cash-flows at list — no discount required.
- Meets the 1% rule at list price ($1k rent vs $60k).
- Cap rate 17.0% vs local median 6.2% in Birmingham — top-decile yield for the area; either an underpriced asset or a hidden risk that comps aren't pricing in. Stress-test before assuming the spread holds.
Location & tenants
- Location reads 67/100 on livability (#78 in AL) — a middle-class / working-renter tenant base. Strengths: commute A+, cost of living A+, housing A+; Watch: amenities C-, crime F, employment F.
- Birmingham City (urban): math 4% / reading 20% proficiency, ranked #116 of 129 in AL (top 90%) — low school quality limits family demand, transient renter base, plan for 1-2y turnover; 82% free/reduced lunch — lower-income household profile, screen leases tightly.
- Zoned schools: Robinson Elementary School (math 2% / reading 12%, grade F, #601 of 627 statewide, top 98%, 344 students, 85% FRL); Woodlawn High Schoolmagnet (math 2% / reading 2%, grade F, #291 of 305 statewide, top 100%, 738 students, 91% FRL).
- Market conditions: Rents rising (+1.8%/yr); 128 active listings in the ZIP; 40 comparable units currently listed for rent nearby; rentals lingering (median 44d on market — plan ~5-8 weeks vacancy on turnover, expect pricing pressure); 62% of comp listings sitting > 30 days — soft ceiling on asking rent; lower-income renter base — watch delinquency; 2,114 units permitted in Jefferson County in 2024 (556 in 5+ unit buildings).
- This rent runs 34% of the median local income ($43k/yr) — at the standard rent-burdened threshold; future hikes will face affordability resistance.
Forward outlook
- Local home prices are declining (-3.0%/yr); year-one equity from $414 of loan paydown is wiped out by about $2k of value loss. Plan a longer hold.
- Jefferson County population projected to shrink 4% by 2050 — rents likely to lag national; underwrite the cash flow, not the appreciation.
- At projected returns (-3.0% appreciation + 1.8% rent growth), your $17k cash investment doubles in ~4 years — after that, you're playing with house money.
Negotiation context
- Only 5 days on market — expect competitive offers; lowballing is unlikely to land.
Risks & watch-outs
- Watch-outs: built in 1935 — expect roof / HVAC / electrical / plumbing capex.
Questions for the listing agent
- Have any recent inspections been done? Can we get a copy of the seller's disclosures and any deferred-maintenance estimates?
- Built in 1935 — when were the roof, HVAC, electrical panel, plumbing, and water heater last replaced?
- Is there a deadline driving the sale (1031 exchange, divorce, estate, relocation)? That informs how much negotiation room exists.
- Schools are F-rated, which usually means shorter tenancies and higher turnover. Who's the typical renter profile here, and what's been the actual vacancy rate?
- Crime grade is F in this area — have there been break-ins, vandalism, or insurance claims at this property in the last 3 years? What carrier currently insures it and at what premium?
- What's the average days-on-market for RENTAL listings here right now (not sales)? A rising rental-DOM trend means longer vacancies and softer asking-rent achievability than the comps imply.
- What's the recent tenant-quality profile in this submarket — average credit score on applications, eviction rate, late-payment / NSF rate, and stable-employment percentage? A property-management company in the area should have these aggregated.
- How much new for-sale + rental construction is in the pipeline within 1–3 miles? Heavy new supply typically softens prices + rents 12–24 months out; constrained supply supports both.
Investment metrics
- 1% rule
- 2.01% ✓
- Cap rate
- 17.03%
- Cash-on-cash
- 38.36%
- DSCR
- 2.71
- GRM
- 4.2
CMA / ARV
- ARV (on-the-fly)
- $81,900
- Comps found
- 12
Show comp detail 12 sales within ~0.75 mi
| Address | Dist | Beds/Ba | Sqft | Sold | Price | $/sf | Match |
|---|---|---|---|---|---|---|---|
| 8606 N 2nd Ave | 0.16mi | 3/1.0 | 1,130 (+4%) | 7mo | $95,100 | $84 | 81 |
| 8313 3rd Ave S | 0.48mi | 3/1.0 | 1,195 (+9%) | 2mo | $90,000 | $75 | 60 |
| 8229 Rugby Ave | 0.65mi | 3/2.0 | 1,120 (+3%) | 7mo | $46,000 | $41 | 55 |
| 636 83rd Pl | 0.71mi | 3/1.0 | 1,062 (-3%) | 8mo | $40,000 | $38 | 55 |
| 8334 4th Ave S | 0.46mi | 2/1.0 (-1) | 1,029 (-6%) | 11mo | $128,750 | $125 | 55 |
| 306 S 83rd St | 0.53mi | 3/1.0 | 1,176 (+8%) | 13mo | $88,000 | $75 | 52 |
| 8405 3rd Ave S | 0.40mi | 3/1.0 | 1,232 (+13%) | 10mo | $65,000 | $53 | 52 |
| 518 84th St S | 0.56mi | 2/1.0 (-1) | 993 (-9%) | 4mo | $45,500 | $46 | 51 |
| 429 86th Pl S | 0.43mi | 2/1.0 (-1) | 936 (-14%) | 2mo | $45,000 | $48 | 50 |
| 8311 7th Ave S | 0.75mi | 4/1.0 (+1) | 1,143 (+5%) | 8mo | $130,000 | $114 | 46 |
| 411 Valley Rd | 0.51mi | 3/2.0 | 1,252 (+15%) | 8mo | $110,000 | $88 | 41 |
| 9048 Bel Air Dr | 0.65mi | 2/1.0 (-1) | 940 (-14%) | 8mo | $90,000 | $96 | 34 |
Match score weights: distance 35% · size 25% · config 20% · recency 20%. Top-matched comps best support the ARV.
Projected returns pro-forma
-3.0% appreciation · 1.82% rent growth · sell at horizon
- IRR
- 33.1%
- Equity multiple
- 2.37×
- Total profit
- $23,051
- Equity at exit
- $8,931
- IRR
- 39.5%
- Equity multiple
- 4.49×
- Total profit
- $58,464
- Equity at exit
- $5,179
Cash invested: $16,772 (down + closing). Projections, not guarantees.
Landlord ↔ Tenant lean methodology
- Overall (STATE)
- 90 Strongly Landlord-Friendly
- State Alabama
- 90 Strongly Landlord-Friendly · R+15
- County
- — inherits STATE
- City
- — inherits STATE
ZIP-level market 35206
- Home prices YoY
- -32.0%
- Rents YoY
- 1.8%
- Active inventory
- 128
- Price-to-rent
- 4.2×
Monthly cashflow live
- Estimated rent
- $1,203 high interval (Pro) →
- Mortgage (P&I)
- −$314
- Tax est. 1.5%
- −$75 /mo · $898/yr
- Insurance
- −$25
- HOA
- −$0
- Vacancy / Maint / Mgmt
- −$253
- Net cashflow
- $536
Break-even live
UW: 25.0% down · 7.5% · 30yr · 1.5% tax · 5.0% vac · 8.0% maint · 8.0% mgmt
Financing live
Cash to close
- Down payment
- $14,975
- Closing costs
- $1,797
- Reserves months
- —
- Total cash needed
- —
Loan-product check · same deal, 3 products live
Conventional
25% down · 7.5% · 30yr
- Down + closing
- —
- Monthly P&I
- —
- Monthly cashflow
- —
- DSCR
- —
- Eligible?
- —
Personal DTI + credit; lowest rate.
DSCR
20% down · 8.5% · 30yr
- Down + closing
- —
- Monthly P&I
- —
- Monthly cashflow
- —
- DSCR
- —
- Eligible?
- —
No personal income docs; deal must DSCR.
Hard money
10% down · 12.0% · 12mo
- Down + closing
- —
- Monthly P&I
- —
- Monthly cashflow
- —
- DSCR
- —
- Eligible?
- —
Short-term bridge; refi at stabilization.
Rent comps 40 comps
| Address | Beds | Baths | Sqft | Rent | $/sqft | DOM | Units | Dist |
|---|---|---|---|---|---|---|---|---|
| 8416 Division Ave Birmingham, AL | 3.0 | 2.0 | 1470 | $1,350 | $0.92 | 44d | 1 | 0.25mi |
| 8513 4th Ave S Birmingham, AL | 3.0 | 1.0 | 1150 | $1,150 | $1.00 | 44d | 1 | 0.35mi |
| 425 87th St S Birmingham, AL | 2.0 | 1.0 | 890 | $1,077 | $1.21 | 44d | 1 | 0.42mi |
| 8240 2nd Ave S Birmingham, AL | 2.0 | 1.0 | 990 | $875 | $0.88 | 23d | 1 | 0.46mi |
| 8408 5th Ave S Birmingham, AL | 3.0 | 1.0 | 1100 | $1,528 | $1.39 | 44d | 1 | 0.46mi |
| 8408 5th Ave S Birmingham, AL | 3.0 | 1.0 | 890 | $1,295 | $1.46 | 10d | 1 | 0.46mi |
| 8333 4th Ave N Birmingham, AL | 4.0 | 2.0 | 1384 | $1,300 | $0.94 | 44d | 1 | 0.47mi |
| 8300 4th Ave N Birmingham, AL | 4.0 | 2.0 | 1455 | $1,300 | $0.89 | 44d | 1 | 0.55mi |
| 8149 1st Ave S Birmingham, AL | 3.0 | 2.0 | 1300 | $1,200 | $0.92 | 44d | 1 | 0.58mi |
| 8202 4th Ave S Birmingham, AL | 3.0 | 1.0 | 1178 | $1,075 | $0.91 | 44d | 1 | 0.60mi |
| 8917 Roebuck Blvd Apt 11 Birmingham, AL | 2.0 | 1.0 | 880 | $725 | $0.82 | 16d | 1 | 0.60mi |
| 8128 2nd Ave S Birmingham, AL | 4.0 | 1.0 | 1390 | $1,150 | $0.83 | 23d | 1 | 0.63mi |
| 8129 2nd Ave S Unit B Birmingham, AL | 2.0 | 1.0 | 900 | $800 | $0.89 | 44d | 1 | 0.65mi |
| 624 83rd Pl S Birmingham, AL | 2.0 | 1.0 | 780 | $975 | $1.25 | 44d | 1 | 0.66mi |
| 8211 Rugby Ave Birmingham, AL | 4.0 | 1.0 | 966 | $1,250 | $1.29 | 44d | 1 | 0.67mi |
| 636 83rd Pl S Birmingham, AL | 2.0 | 2.0 | 1062 | $1,175 | $1.11 | 44d | 1 | 0.69mi |
| 8108 4th Ave S Birmingham, AL | 3.0 | 2.0 | 1384 | $1,200 | $0.87 | 44d | 1 | 0.71mi |
| 8242 Vassar Ave Birmingham, AL | 4.0 | 1.0 | 1212 | $1,100 | $0.91 | 44d | 1 | 0.76mi |
| 8021 1st Ave S Unit A Birmingham, AL | 3.0 | 1.0 | 980 | $950 | $0.97 | 23d | 1 | 0.78mi |
| 8035 4th Ave S Birmingham, AL | 3.0 | 2.0 | 1096 | $1,050 | $0.96 | 44d | 1 | 0.81mi |
| 512 81st St S Birmingham, AL | 3.0 | 1.0 | 1156 | $1,150 | $0.99 | 44d | 1 | 0.82mi |
| 730 82nd Pl S Birmingham, AL | 3.0 | 1.0 | 896 | $1,023 | $1.14 | 3d | 1 | 0.83mi |
| 514 81st St S Birmingham, AL | 4.0 | 2.0 | 1174 | $1,295 | $1.10 | 44d | 1 | 0.83mi |
| 745 82nd Pl S Birmingham, AL | 3.0 | 2.0 | 1200 | $1,168 | $0.97 | 2d | 1 | 0.85mi |
| 8020 4th Ave N Birmingham, AL | 3.0 | 1.0 | 1200 | $1,200 | $1.00 | 44d | 1 | 0.85mi |
| 8122 Rugby Ave Unit B Birmingham, AL | 2.0 | 1.0 | 900 | $795 | $0.88 | 44d | 1 | 0.89mi |
| 731 81st St S Birmingham, AL | 3.0 | 1.0 | 1221 | $995 | $0.81 | 10d | 1 | 0.91mi |
| 735 81st St S Birmingham, AL | 3.0 | 2.0 | 1224 | $1,400 | $1.14 | 23d | 1 | 0.92mi |
| 775 81st Pl S Birmingham, AL | 3.0 | 1.0 | 1232 | $1,095 | $0.89 | 23d | 1 | 0.97mi |
| 7829 3rd Ave S Birmingham, AL | 3.0 | 1.5 | 1005 | $1,025 | $1.02 | 44d | 1 | 0.99mi |
| 7931 7th Ave S Birmingham, AL | 3.0 | 1.0 | 1320 | $1,450 | $1.10 | 44d | 1 | 1.00mi |
| 764 81st St S Unit B Birmingham, AL | 2.0 | 1.0 | 800 | $800 | $1.00 | 44d | 1 | 1.01mi |
| 8229 9th Ave S Birmingham, AL | 2.0 | 1.0 | 997 | $1,195 | $1.20 | 3d | 1 | 1.02mi |
| 8013 Rugby Ave Birmingham, AL | 3.0 | 2.0 | 1460 | $1,150 | $0.79 | 23d | 1 | 1.03mi |
| 8621 10th Ave S Birmingham, AL | 3.0 | 2.0 | 1240 | $1,400 | $1.13 | 23d | 1 | 1.04mi |
| 7815 4th Ave S Birmingham, AL | 3.0 | 2.0 | 1496 | $1,650 | $1.10 | 1d | 1 | 1.05mi |
| 7801 3rd Ave S Unit B Birmingham, AL | 2.0 | 1.5 | 1100 | $1,000 | $0.91 | 44d | 1 | 1.06mi |
| 768 80th Pl S Unit 1 Birmingham, AL | 3.0 | 2.0 | 1134 | $1,200 | $1.06 | 44d | 1 | 1.07mi |
| 7728 1st Ave S Apt C Birmingham, AL | 2.0 | 1.0 | 950 | $950 | $1.00 | 44d | 1 | 1.14mi |
| 7721 1st Ave S Birmingham, AL | 3.0 | 1.0 | 956 | $949 | $0.99 | 23d | 1 | 1.16mi |
Listing history 2 events
-
2026-05-14status Pending
-
2026-05-06$59,900 Active
ⓘ Source: listings_history table (triggers on properties + properties_extension) + one-shot
backfill from property_details.listing_events for pre-trigger history.
Nearby sold comps map
Loading sold comps map…
Walkable amenities ~0.75 mi
Loading nearby amenities…
Taxation est. · year 1
- Rental income
- $14,433
- − Mortgage interest
- −$3,355
- − Property taxes
- −$898
- − Insurance
- −$300
- − Repairs & maintenance
- −$1,155
- − Management
- −$1,155
- − Depreciation
- −$1,743
- Taxable income
- $5,828
- Est. tax owed @ 24.0%
- −$1,399
- After-tax cash flow
- $5,036/yr
For passive investors: Depreciation is non-cash, so a rental often shows a tax loss while cash-flowing — sheltering income. Rental losses are passive: they offset passive income freely, and up to $25,000/yr can offset ordinary (W-2) income if you actively participate and your MAGI is under $100k (phasing out to $0 by $150k); unused losses carry forward. On sale, claimed depreciation is recaptured at up to 25%, and gains may owe capital-gains tax (a 1031 exchange can defer both). Figures are a year-1 estimate at your 24.0% rate — not tax advice; consult a CPA.
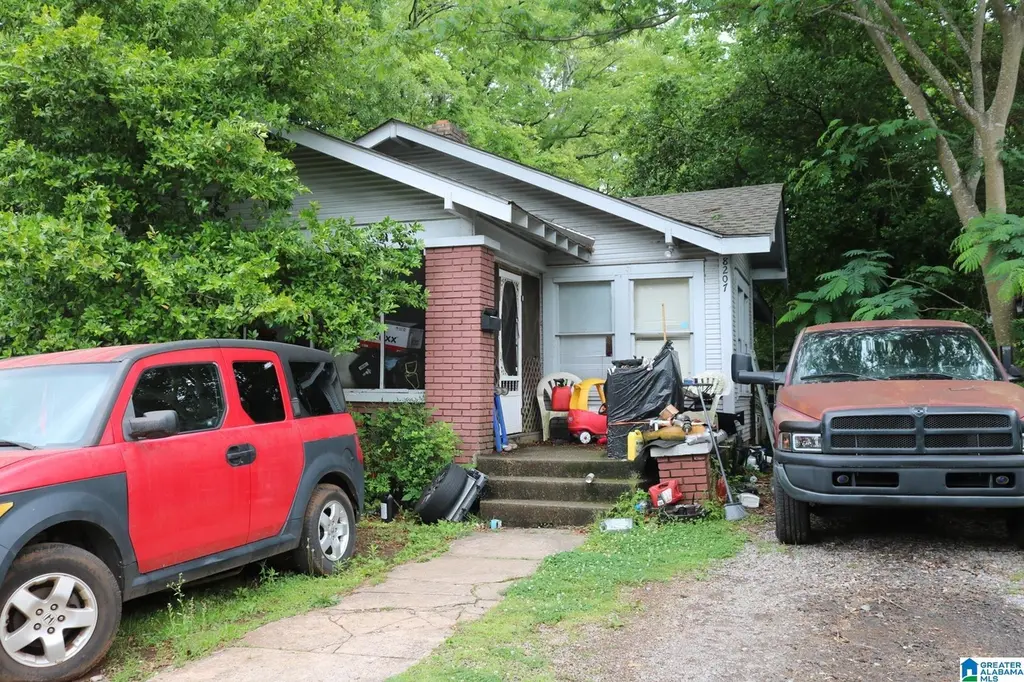
Condition & rehab AI · 1 photo
This property is in poor condition with extensive repairs and maintenance needed. Immediate attention to the driveway and exterior is crucial for safety and curb appeal.
Repairs flagged
- Major Abandoned vehicles — Safety hazard and obstruction
- Major Driveway debris — Safety hazard and obstruction
- Major Exterior cleaning — Neglect and potential structural issues
Value-add opportunities
- Both Clean and organize the driveway — Improves curb appeal and safety
- Both Exterior cleaning and maintenance — Improves curb appeal and safety
- Both Interior cleaning and repairs — Improves safety and functionality
Renovation cost estimate screening
| Repair item | Severity | Est. cost |
|---|---|---|
| Abandoned vehicles · Safety hazard and obstruction | Major | $15,000–50,000 |
| Driveway debris · Safety hazard and obstruction | Major | $15,000–50,000 |
| Exterior cleaning · Neglect and potential structural issues | Major | $15,000–50,000 |
| Total estimated repair cost · 3 items | $45,000–150,000 |
Value-add ROI direction
- Both Clean and organize the driveway — Improves curb appeal and safety ↑
- Both Exterior cleaning and maintenance — Improves curb appeal and safety ↑
- Both Interior cleaning and repairs — Improves safety and functionality ↑
ⓘ Cost ranges are severity-bucket heuristics (US national rule-of-thumb). Get contractor quotes + a written scope before underwriting a rehab budget.
Schools (NCES district)
- District
- Birmingham City
- NCES district ID
- 0100390
- Math proficiency
- 4% ▼ -17.00%
- Reading proficiency
- 20% ▼ -4.00%
- Median HH income
- $31,988
- Composite
- 9.49/100
- National rank
- #9850
- State rank
- #116 of 129 in AL
Livability — Birmingham
- Score
- 67/100
- State rank
- #78
- US rank
- #10412
Category grades
Schools grade is shown separately in the Schools card above.
Census & demographics
- Census place
- Birmingham, AL
- County
- Jefferson County · 527,445 people
- City population
- 210,422
- Metro
- Birmingham-Hoover, AL
- Population (ZIP)
- 15,621
- Household income
- $42,549
- Rent vs Own
- Severe rent burden
- 1169.0
Population outlook (Jefferson County) Hauer SSP2
- Today (2025)
- 669,185 people
- By 2030
- 669,694 · +0.1%
- By 2040
- 661,388 · -1.2%
- By 2050
- 643,086 · -3.9%
- By 2075
- 577,267 · -13.7%
- By 2100
- 474,758 · -29.1%
Race, ethnicity, and origin ACS 2023
- Neighborhood character
- Predominantly Black (73%)
- Race & ethnicity
- Black 73% White 22% Two or more races 3% Hispanic / Latino 2%
- Common ancestry
- Slovak 1%
- Foreign-born
- 3% · Canada
- Languages at home
- 97% English-only · Spanish 2% Other Indo-European 0%
Political lean MEDSL · Jefferson
- 2024 margin
- D (+10.4) · D 54.6% · R 44.2% · Other 1.2%
- 2008→2024 swing
- +5.4pp toward D · 2008: 5.1pp · 2024: 10.4pp
- All cycles
- 2024: D+10.4 2020: D+13.2 2016: D+7.2 2012: D+6.0 2008: D+5.1
Not yet ingested
- Civics
- —
Market trends
- HPI YoY
- ▼ -68.70%
- Current HPI
- 146.2168
- Rent YoY
- ▲ 1.82%
- Metro
- Birmingham-Hoover, AL
- State GDP YoY
- ▲ 2.94%
- F500 in state
- 4
Industry mix (Fortune 500 HQ in AL)
| Industry | F500 HQs | Revenue |
|---|---|---|
| Financial Services | 1 | $8B |
|
||
| Healthcare | 1 | $5B |
|
||
Price history
2 events — show timeline
- 2026-05-14 Pending — Greater Alabama MLS
- 2026-05-06 Listed $59,900 Greater Alabama MLS
Cash-flow waterfall
monthlySold comps — $/sqft
last 12 mo · ≤1 miLoading sold comps…